Development of Surface Roughness Standards for Pathways Used by Wheelchair Users: Final Report
Development of Surface Roughness Standards for Pathways Used by Wheelchair Users: Final Report
December 2014
Human Engineering Research Laboratories
VA Pittsburgh Healthcare System
6425 Penn Avenue, Suite 400
Pittsburgh, PA 15206
http://www.herl.pitt.edu/
Email: herl@shrs.pitt.edu
Executive Summary
Over two million people in the United States use a wheelchair for mobility. These Americans not only rely on their assistive technology to complete simple, daily tasks, but they also depend on functional and accessible sidewalks to do so. The Americans with Disabilities Act Accessibility Guidelines (ADAAG), established by the Access Board, provide suggestions for pathways; however, the ones related to surface roughness are subjective and not measurable. This ambiguity results in public pathways with many bumps and cracks, which can lead to harmful whole-body vibrations (WBVs) for wheelchair users. ISO standard 2631-1 specifies zones for how much vibration exposure can be dangerous, but it is unknown how surface roughness can affect the amount of vibration that wheelchair users feel. To develop a standard for surface roughness, a literature review on previous studies related to wheelchair vibrations as well as roughness measurement and analysis techniques was completed. Subjective and objective information was also gathered and analyzed from a human subject study where subjects traveled over various surfaces in their own wheelchairs. Seventy-six subjects, as of May, 2014, were recruited to travel over nine engineered wooden pathways with varying roughnesses. A subset of 38 subjects also traveled over 18 outdoor, real-world pathways. While the subjects traveled over the surfaces, accelerometers recorded vibrations at the seat, footrest, and backrest. After traveling over each surface, subjects were asked to subjectively rate each surface and decide whether the surface was acceptable or not. Both RMS accelerations and subjective ratings were compared to surface roughness to see if a correlation existed. As expected, the results show that as surface roughness increased, RMS accelerations increased and subjective ratings decreased. Some real-world surfaces generated RMS accelerations above the ISO health guidance zone, suggesting that some sidewalks are causing harmful vibrations to wheelchair users. Some surfaces were also rated as unacceptable by more than half of the subjects showing that these surfaces were causing discomfort to the people traveling over them. Based on the combination of RMS data and subjective feedback from wheelchair users, we are proposing a roughness index threshold of 1.20 in/ft for any short distance segments (less than 10 ft). For longer surfaces (greater than 100 ft), a roughness index of 0.60 in/ft should be adopted.
KEY FINDINGS:
-
There are ways to measure and analyze surface roughness for roadways, but none are capable of being directly transferred to pedestrian pathways.
-
Previous studies have found that wheelchair users are exposed to potentially harmful vibrations in their communities and the magnitude of those vibrations are dependent on surface characteristics
-
As surface roughness increases, the magnitude of vibrations increases.
-
As surface roughness increases, subject ratings of the surface decreases.
-
To calculate roughness, a profile of the surface with a resolution of 1 mm should be used.
-
The profile should be filtered with a “wheelpath” algorithm with a 2.5 in diameter wheel.
-
The roughness limit for any local area (less than 10 ft, such as a curb cut with low vision bubbles) should be 1.2 in/ft.
-
For longer surfaces (greater than 100 ft) a roughness of 0.60 in/ft should be adopted.
FUTURE WORK:
-
Work with ASTM Committee E17 to develop and approve roughness measuring standard
-
Develop and validate a tool to measure pathway accessibility including roughness and other right-of-way features
1. Background
People with disabilities can participate in the community and have very active lifestyles. A study has shown that people in Pittsburgh who use power WCs as their primary mode of transportation will travel 1.6 km on a normal day. (Cooper, et al., 2002) However, in an active and highly accessible environment, such as the convention centers and cities where they hold the National Veterans Wheelchair Games (NVWG), WC users can travel up to almost 8 km per day. (Cooper, et al., 2002) A similar study of manual WC users revealed that on typical days they travel 2.0 km, and in a highly accessible setting, such as at the NVWG, they will travel an average of 6.5 km per day; one subject in this study traveled 19.4 km in one day. (Tolerico, 2006)
A factor that influences this activity level is the degree to which the WC rider is comfortable and safe during these activities. One measure of comfort and safety is to determine the Whole Body Vibrations (WBV) exposure levels to which WC users are exposed. There is a wide body of occupational hazards research that has demonstrated a correlation from WBV exposure to discomfort and injury to nearly all of the body’s organs. Research suggests that exposure to shock and vibration may be linked to many symptoms such as muscle fatigue (Zimmerman, 1993), back injury (Pope, 1992; Pope, 1999), neck pain (Boninger et al, 2003) and disc degeneration. Literature suggests that the seated posture, which occurs during WC use, is a compromising position for the spine and many associated body tissues. Daily shock and vibration experienced during WC riding can also increase an individual’s rate of fatigue (VanSickle et al, 2001) and limit their functional activity and community participation. Because of these harmful effects, it is critical to understand and attempt to reduce the amount of WBVs that are transmitted when navigating over rough terrains. (Cooper et al, 2004; Requejo et al, 2009)
The ISO 2631-1 standard for evaluation of human exposure to whole-body vibration is the most accepted standard for vehicle vibration studies and establishes limits for safety, fatigue and comfort called the exposure caution zone. The exposure caution zone (Figure 1) is based upon the time of exposure and weighted magnitude of acceleration and reflects the maximum allowable limit for human safety. Furthermore, according to the ISO 2631-1, an RMS value of approximately 1.15 m/s2 over a 4-8 hour period is the maximum allowable vibration value. However, exposure of vibration levels within the caution zone may still result in elevated risk of health impairment (ISO, 1997) if they occur repeatedly over a long period of time (e.g. several years).
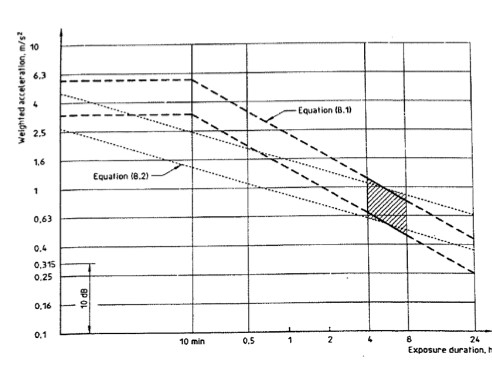
Figure 1: ISO Standard 2631-1. The health guidance zone is between the dashed lines
Legislation
The Architectural Barriers Act of 1968 (ABA) ensures that buildings which are designed, built or altered by federal funding or leased by federal agencies are accessible to the public. The Americans with Disabilities Act of 1990 (ADA) greatly expands the scope and details of the ABA. The ADA states that "physical or mental disabilities in no way diminish a person’s right to fully participate in all aspects of society…" It is a purpose of the ADA "to provide a clear and comprehensive national mandate for the elimination of discrimination against individuals with disabilities and to provide clear, strong, consistent, enforceable standards addressing discrimination against individuals with disabilities." Title V of the ADA mandated that the Architectural and Transportation Barriers Compliance Board (Access Board) set up minimum guidelines "to ensure that buildings, facilities, rail passenger cars, and vehicles are accessible, in terms of architecture and design, transportation, and communication, to individuals with disabilities." (ADA, 1990)
The Access Board has established ADA Accessibility Guidelines (ADAAG) for Buildings and Facilities that give specific instructions and limitations about what is considered accessible. However, the only guidelines related to floor or ground surfaces are that they "shall be stable, firm, and slip resistant." (ADA, 1990) Unfortunately, these restrictions can be interpreted differently and do not directly address the issue of surface roughness. Typical ADA accessible pathways are made of asphalt, pavement and concrete; however, packed crushed stone, gravel fines compacted with a roller, packed soil and other natural materials bonded with synthetic materials can provide the required degree of stability and firmness. The current ADAAG guidelines (Table 1) provide a description of the suggested width and slope, but do not provide guidance on pathway roughness except that obstacles should be no more than 1/2" high. The frequency (obstacles per unit length), profile, and orientations of safe and passable obstacles are not prescribed. (ADAAG, 2002) The absence of roughness guidelines is an unfortunate limitation to the ADAAG, as there are many stakeholders involved in the development processes and construction of public walkways (city planners, community councils, architects and contractors) each of which are not likely to understand the implications of terrain characteristics on the health, comfort and safety of WC riders.
Table 1: ADAAG- Accessible Route Guidelines
|
Parameter |
Requirement |
|
Clear Width |
Minimum 36" |
|
Openings |
Maximum 1/2" |
|
Obstacle Height |
|
|
1/4" |
No slope required |
|
1/4"-1/2" |
Beveled with Maximum 1:2 slope |
|
Ramps Max Slope |
|
|
1:12-1:16 |
maximum 30" high, 30' long |
|
1:16-1:20 |
Maximum 30" high, 40' long |
|
Cross Slope |
Maximum 1:50 |
A study done by Wolf et al. looked at the effects of roughness of nine different sidewalk surfaces; six studied over three years and three surfaces added in the last year. Wolf et al. compared poured concrete (control) to different types of brick sidewalks. They varied in composition (Concrete, Clay), spacing (bevel size, no bevel) and degree of herringbone placement (45, 90) as shown in Table 2. Sidewalks were installed by an Interlocking Concrete Pavement Institute (ICPI) certified contractor. Ten nondisabled subjects were recruited over the three year period. Accelerations were recorded on the seat and footrest of the chair as the subjects drove over the surfaces. They concluded that for manual WCs, the 90 degree surfaces with 0 and 2mm bevels resulted in significantly lower WBV than the standard poured concrete surface. For power WCs, the 90 degree surface with no bevel resulted in significantly less WBV at the seat and the 90 degree surfaces with 0, 2 and 4mm bevels resulted in significantly less WBV at the footrest than the poured concrete surface. The results also showed that the 90 degree surface with an 8mm bevel had the highest WBV while the 90 degree surface with no bevel resulted in the lowest WBV. The fact that the poured concrete surface resulted in significantly higher vibrations than some brick surfaces was most likely caused by the large gaps between the slabs of concrete. (Wolf et al, 2007)
Table 2: Specifications of Surfaces Tested
| Dimension (mm) | |||||||
| Surface | Name | Edge Detail | Compo-sition | Length | Width | Height |
Installed Pattern |
|
1 |
Poured Concrete |
— |
Concrete |
— |
— |
— |
Smooth |
|
2 |
Holland Paver |
Square (no bevel) |
Concrete |
198 |
98 |
60 |
90° |
|
3 |
Holland Paver |
2 mm bevel |
Concrete |
198 |
98 |
80 |
90° |
|
4 |
Holland Paver |
8 mm bevel |
Concrete |
198 |
98 |
60 |
90° |
|
5 |
Whitacre-Greer |
4 mm bevel |
Clay |
204 |
102 |
57 |
45° |
|
6 |
Pathway Paver |
Square (no bevel) |
Clay |
204 |
102 |
57 |
45° |
|
7 |
Holland Paver |
6 mm bevel |
Concrete |
198 |
98 |
60 |
90° |
|
8 |
Holland Paver |
6 mm bevel |
Concrete |
198 |
98 |
60 |
45° |
|
9 |
Holland Paver |
4 mm bevel |
Concrete |
198 |
98 |
60 |
90° |
Another study conducted on 6 of the same surfaces (Poured concrete; 90 degree with 0, 2, and 8mm bevels; 45 degree with 0 and 4mm bevels) showed that for power WCs traveling at a speed of 1 m/s, the ISO 2631 limit for an 8-hour exposure to vibrations was exceeded by the 90-degree, 8mm bevel surface and the 45-degree, 4mm bevel surface. At a speed of 2 m/s the exposure limit would be exceeded in less than 3 hours of continuous driving on all surfaces. (Cooper et al, 2004) While WC users do not typically drive continuously for 3 hours, they do travel above 8 hours a day on average and experience some amount of vibrations during all movement. (Tolerico, 2006)
To see the extent of whole body vibration exposure that WCs users feel during a typical day, Garcia-Mendez, et al. conducted a study on health risks of vibration exposure to WC users in the community. By attaching vibration data loggers, wheel encoders and seat occupancy sensors to manual WCs, they were able to record vibrations on the WC for two weeks while the users were at a national WC event and at home in their community. The results showed that all of the participants were exposed to vibration levels at the seat surface that were within or above the health caution zone set by the ISO 2631-1 standard. (Garcia-Mendez, 2012)
Literature Review
The literature review focused on two topics. The first review of the literature focused on the effects of surface roughness on the health and safety of WC riders. The second topic was to explore ways to measure, design, and monitor the quality of pathway surfaces for WC users. Therefore two separate searches were conducted. A literature review was completed using searches on PubMed and Google Scholar in October of 2010, and more recently in November of 2011 to identify any new articles. For the search on WC vibrations, both databases were searched for titles that had the word wheelchair and any of the following: vibration, shock, surface, roughness, firmness, sidewalk, or pathway. The second search was conducted by searching titles for the word roughness and any of the following: road, roadway, measurement, profile, or profiling. This search was only conducted on Google Scholar and was limited to the fields of engineering, computer science, and mathematics. We performed a systematic review of the relevant literature. Relevance was determined first by reviewing abstracts, and then reviewing entire articles. First, abstracts of all of the papers identified through the keyword searches were compiled into a single document, and each was reviewed. If the abstract suggested the manuscript was relevant to the topic, the entire manuscript was then reviewed. Only manuscripts that were deemed irrelevant were then discarded, and the remaining manuscripts were included in this review.
Subject testing
A study was designed to investigate a correlation between surface roughness and WBV exposure to WC users in an attempt to determine which surfaces should be considered acceptable. The study also investigated a correlation between surface roughness and subjective feedback from WC users. Both manual and power WC users were included in the study so that the results would not benefit or harm either group.
Prior to starting the study; subjects consented to participate in the IRB-approved study. The inclusion criteria were that the subject must use a manual or power WC as their primary means of mobility (greater than 50% of the day), propel their WC independently without their feet touching the ground, speak English, report that they are free from active pressure sores, and that they do not use a pacemaker. After being consented, subjects completed a baseline questionnaire that included demographics, WC type, and types of sidewalks on which they typically travel, among other variables (Questions are shown in Appendix A). Tri-axial accelerometers were attached at the backrest, seat frame and footplates to record vibrations (Figure 2). After completing the questionnaire subjects were asked to drive their WC over a series of various outdoor surfaces as well as a 16 ft indoor test platform, which had a series of wood slats that could be changed to vary the roughness from almost perfectly smooth to very rough. The order of engineered surfaces was varied in a random order for each subject to reduce any sequence bias that may occur. A trial was considered acceptable if the time for the trial was between 4.390 and 5.366 seconds which is a rate of 1m/s (+/- 10%), an average velocity for WC users and a velocity that has been used for past studies. (Cooper, 2004) After a subject traveled over a surface three acceptable times, with a maximum of five attempts, they were asked to provide a subjective rating of the surface.
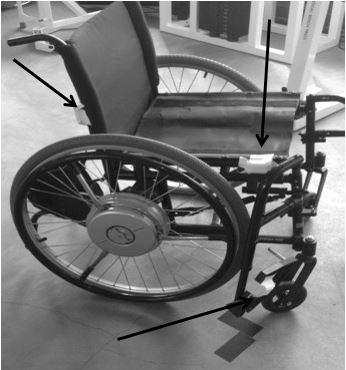
Figure 2: Picture of Wheelchair with Accelerometers
Engineered Surfaces
The engineered surfaces consisted of a 16ft x 4ft runway with a 4ft x 4ft flat platform on each end. (Figure 3) The 16ft test area was constructed with two rows of 48 pieces of 3/4in poplar hardwood separated at 4in intervals. The board configurations resulted in gaps of 0in, 0.8in, 1.25in, 1.55in and 2.00in. These gaps were chosen so that there was a large range of surfaces that would result in vibrations and questionnaire results that would span the range necessary for the study. The surface configurations are described in Table 3. The roughness index is a measurement how much vertical deviation a standard wheel will experience as it travels over these surfaces and will be explained in more detail later on.
Table 3: Engineered Surface Identification
|
Surface ID: |
Roughness Index (in/ft): |
Crack Frequency (in): |
Crack Width (in): |
|
1 |
0.2052 |
No cracks |
0 |
|
2 |
0.3087 |
12 |
0.80 |
|
3 |
0.3827 |
8 |
0.80 |
|
4 |
0.5717 |
12 |
1.25 |
|
5 |
0.5783 |
4 |
0.80 |
|
6 |
0.7184 |
8 |
1.25 |
|
7 |
0.9211 |
8 |
1.55 |
|
8 |
1.2132 |
4 |
1.25 |
|
9 |
1.5449 |
8 |
2.00 |
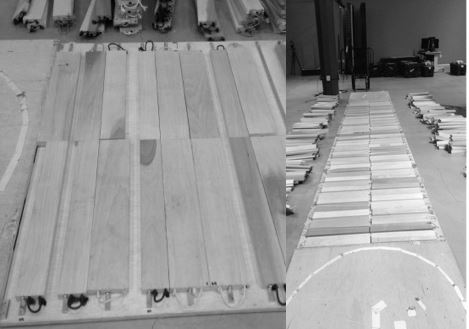
Figure 3: Pictures of wooden surfaces
Outside Surfaces
Subsets of the subjects also traveled over outdoor surfaces around the area at which they were tested with the accelerometers attached to their chairs and rated those surfaces. A total of twelve outside surfaces were tested which included a variety of brick, concrete, and asphalt surfaces. Pictures of these surfaces are available in Appendix B.
Questionnaire
A full version of the questionnaire given to the subjects after traveling over each surface can be found in Appendix C. The questionnaire was developed by the study investigators. The first question, shown in Figure 4, was based on ASTM 1927-28: Standard Guide for Conducting Subjective Pavement Ride Quality Ratings. This standard, which will be described later, is used to conduct subjective ratings of roadways so it was used in the same manner to conduct subjective ratings of our engineered and outdoor surfaces.
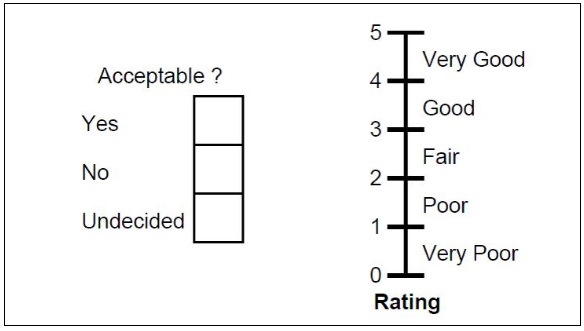
Figure 4: Present Serviceability Rating Form
Data acquisition
The accelerometers used for subjects 1-28 were ADXL 335Z wired tri-axle accelerometers and data was collected using National Instruments Signal Express software. The data were collected from all three orthogonal directions at 100 Hz. The rest of the subjects had shimmer 2R wireless accelerometers attached to their chairs. This data were collected via Bluetooth and a Matlab program. (The MathWorks Inc, Natick, Massachusetts) These data were collected at a preset frequency of 102.4 Hz. These accelerations were then analyzed using the RMS method described in ISO 2631-1. The ISO standard states to collect measurements in the direction with the highest vibrations. The vertical z-axis was chosen because it is parallel to the spine and lower legs of the subject, both of which are high-risk areas for negative health outcomes. Frequency ratings were also applied to the data based on the ISO standard. The RMS is calculated using the following equation:
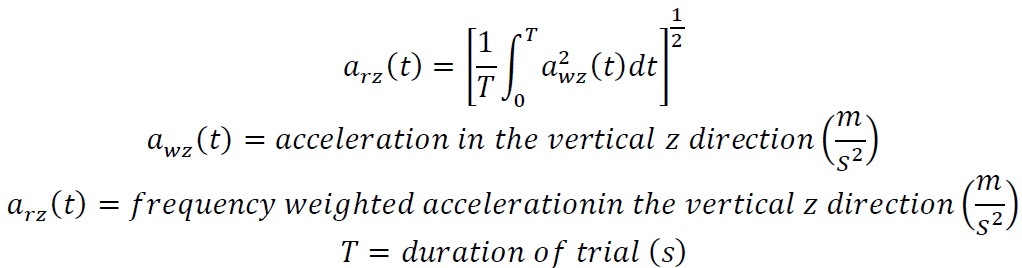
Equation 1: Root Mean Square
If the vibration data has infrequent high magnitude shocks, ISO 2631-1 recommends that the Vibration Dose Value is a better way to quantify the vibrations. VDV should be used if the crest factor is greater than 9, where the crest factor is defined as the modulus of the ratio of the maximum instantaneous peak value of the frequency-weighted acceleration signal to its RMS value. VDV is calculated using the following equation:
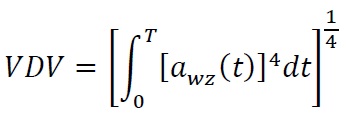
Equation 2: Vibration Dose Value
Roughness Measurement
The surface profiles were measured with a custom-built pathway measurement tool (PathMeT), which was created from a power WC frame that was instrumented with a wheel encoder and an Acuity AR700 distance measurement laser. Because brick pavers are typically laid with 3-5 mm between them and a limitation to a study conducted by Yamanaka was that the profilograph they used did not have a high enough resolution, we wanted our measurements to be recorded with a spacing or about 1 mm. (Yamanaka, 2006) The recording frequency of the laser and encoder were not set, but were recorded at approximately 1200 Hz, which resulted in an accuracy of less than 1mm when it was traveling at 1m/s. PathMeT was driven over the surfaces on two flat boards to eliminate the error caused by the tires falling into the cracks. (Figure 5)
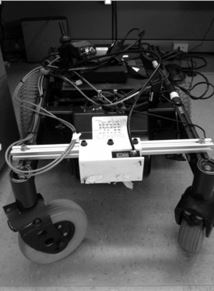
Figure 5: Picture of Original PathMeT
Road Roughness Measurements
The literature review found methods of measuring and recording surface profiles including the rod and level, dipstick, rolling straight-edge, profilograph (Figure 6), rolling profilers, Road-Response Type Measuring System (RRTMS) (Figure 7) and inertial profilers (Figure 8). One of the original methods was the profilograph, which was adopted in the early 1900’s, and can directly measure surface roughness by using an array of wheels on each side to establish a reference plane for measuring deviations. (Figure 6) The roughness is measured as the absolute sum of deviations of the center wheel. (Gillespie, 1992; Sayers, 1998)
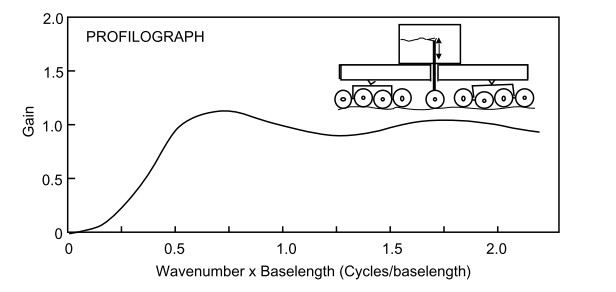
Figure 6: Schematic of Profilograph (Sayers and Karamihas 1998)
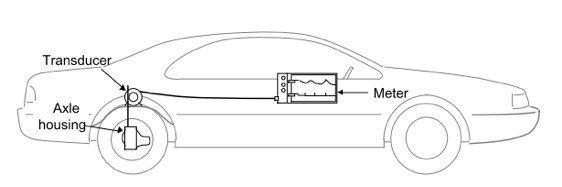
Figure 7: Schematic of RTRRMS (Sayers and Karamihas 1998)
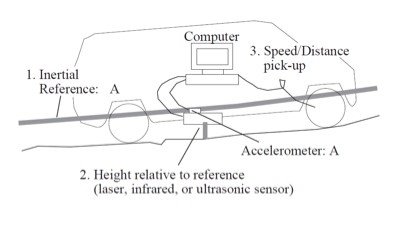
Figure 8: Schematic of Inertial Profiler (Sayers and Karamihas 1998)
During the 1960s, an automobile-mountable measurement device began a new era of surface roughness measurements, with some advantages and disadvantages. The major advantages of these systems were their low cost and their ability to mount onto any vehicle. These RTRRMS systems recorded cumulative axle displacement over a given distance and thus reported surface roughness as inches/mile. Also known as "road meters", two examples of these systems were the Mays Ride Meter and the PCA Meter. (Gillespie, 1992; Sayers, 1998)
The disadvantages to using the RTRRMS were the inconsistencies introduced by variations between the different commercialized RTRRMS systems and also that were mounted onto different automobiles that may have had different suspension systems. Consequently, measurements from identical surfaces could be different depending on which device and automobile were used. This effect was compounded by the influence of minor differences even within identical vehicles, such as fuel level, number of passengers, or tire pressure. With this variability, developing a consistent and reliable database of road roughness measures and related thresholds was impossible. The need for standardized and consistent measures was necessary throughout the world. This led to the development of an effort organized and conducted by the World Bank in Brazil in 1982 known as the International Road Roughness Experiment. One goal of the experiment was to establish a correlation and calibration standard for roughness measurements. In processing the data, it became clear that nearly all roughness measuring instruments in use throughout the world were capable of producing measures on the same scale, if that scale was suitably selected. A number of methods were tested, and the in/mi calibration reference from NCHRP Report 228 was found to be the most suitable for defining a universal scale. (Gillespie, 1992; Sayers, 1998)
Another method of measuring surface profiles is with an inertial profiler. (Figure 8) An inertial profiler uses an accelerometer and a non-contacting sensor, such as a laser transducer, to measure height. Data processing algorithms converts vertical acceleration measured by the accelerometer to an inertial reference that defines the instant height of the accelerometer in the host vehicle. The height of the reference from the ground is measured by the sensor and subtracted from the reference. The distance traveled is usually measured by wheel rotations or a speedometer. These profilers are convenient because they can be attached to any vehicle. However, because they use acceleration measurements, they are inaccurate at low speeds. Most roadway inertial profilers cannot measure accurately at speeds less than 15 km/hr. (Sayers, 1998)
The Present Serviceability Index (PSI) is another method of measuring surface roughness and performance of pavement. It is the first and most commonly used method for relative objective measures of surface condition with the public’s perception of serviceability. However, the primary use of PSI is to evaluate the ability of the pavement to serve its users by providing safe and smooth driving surfaces. Between 1958 and 1960, the American Association of State Highway Officials conducted a study of pavement performance on surfaces in Illinois, Minnesota, and Indiana. A panel of raters evaluated roadway surfaces by riding in a car over the pavement and filling out a PSR (Present Serviceability Rating) form. (Figure 9) While the PSR measurements were being conducted by the panelists, other objective measurements (Total crack length, slope variance, rutting depth, etc.) were being taken on the same roads. The PSI equation (Equation 3) was derived to be able to use the objective measurements of the road to predict the panel’s rating. These equations allowed objective measurements taken from a stretch of highway to predict the rider perception of that roadway and thus be a way to determine whether the pavement is acceptable or needs to be replaced. The PSI equations produce a scale of zero to five; five indicates an excellent ride condition while zero refers to a very poor ride quality. Manual observation is still considered possibly the strongest and most accurate evaluation of a road surface because of their attention to detail; however, it requires a substantial amount of human-hours and associated cost. (Sayers, 1998; Latif, 2009)
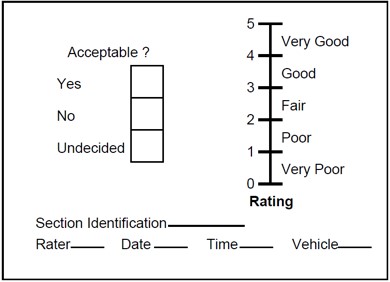
Figure 9: PSR Evaluation Form (Sayers and Karamihas 1998)
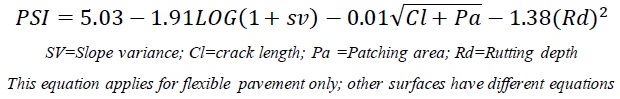
Equation 3: Present Serviceability Index
Road Roughness Analysis
The literature review also found several approaches that have been used to process the surface roughness measurements into meaningful indices. These indices include moving average, Ride Number (RN), International Roughness Index (IRI), and Power Spectral Density (PSD). However, the gold-standard for designing and evaluating roadway roughness is the (IRI) which was developed by the International Road Roughness Experiment (IRRE) and establishes equivalence between several methods of roughness measurements. The IRI also has an ASTM standard measurement protocol for consistent measurements. (ASTM E1926) The IRI is the cumulative sum of displacement of the upper mass (Ms) of a standardized ‘quarter-car’ model when it is simulated to travel over a road profile (Z(x)) which was either measured, or generated for the purposes of designing a new roadway. The characteristics of the ‘quarter-car model are shown in Figure 10 (Sayers, 1998; Loizos, 2008)
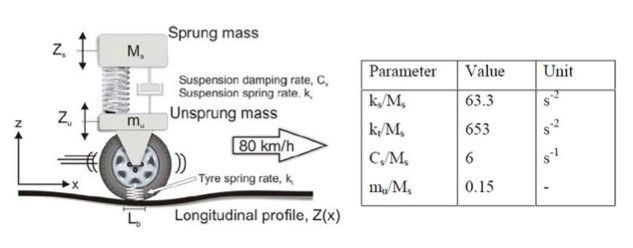
Figure 10: Quarter-car picture and variables (Loizos and Plati 2008)
The strength of the IRI is its stability and portability. Although the in/mi measure from RTRRMS has been popular since the 1940’s, as discussed above, values varied from one vehicle over time or from different vehicles on the same road. Since the IRI model is defined by its mathematical quarter-car model, it is not affected by the measurement procedure or the characteristics of the vehicle that was utilized in collecting the profile measures. Another important factor concerning the IRI is that it was designed to focus on road serviceability. Serviceability is a criterion measure for highway surfaces based on surface roughness, which is then used as a determinant need for rehabilitation of highway surfaces. (Figure 11) (Shafizadeh, 2002; Loizos, 2008)
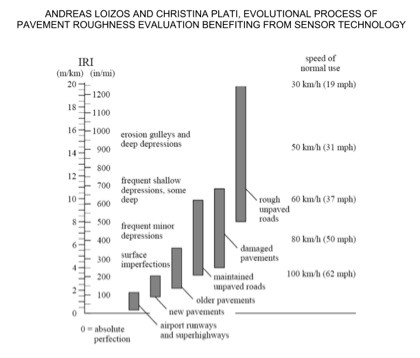
Figure 11: IRI Scale (Sayers and Karamihas 1998)
A study done in Japan addressed the usability of IRI on sidewalks used by WC’s. (Yamanaka, 2006) The study had ten subjects ride in a manual WC over nineteen different surfaces. The subjects were then asked to rate the smoothness of the ride and if they felt shaking. Vibration measurements were also recorded during the trials using speedometers attached to a caster wheel of the chair. Profile measurements were taken using a profilograph that could measure displacement on a 10mm interval. The results showed that there was a strong relationship between user assessment and vibration data. However, the relationship between the IRI and user assessment was not significant. The researchers concluded that this was probably due to the fact that the front tires of the WC would produce vibrations while running over small cracks and bumps that the profilograph, with a 10mm interval, could miss. Therefore the person would feel the bump, but the profilograph would not record it.
Although the IRI is accepted as a measure of serviceability in numerous countries, research has indicated that IRI may be limited in predicting serviceability because it is a broad measure of roughness and filters out potentially informative data from small areas of the roadway. Another analysis technique widely used to evaluate roughness is a Power Spectral Density (PSD) analysis of the road profiles.
The PSD provides a concise description of road roughness measured in frequencies and accompanying amplitudes. This is accomplished by describing the distribution of the pavement profile variance as a function of wavelength. The height (y) of the surface profile represents pavement roughness and is a function of spatial distance (x) along the pavement. To generate a PSD, a Fourier transform of the data is performed and scaled to show how the variance of the profile is spread over different frequencies. PSD analysis is valuable because it helps identify the source of the roughness. Short wavelengths (less than 3 m) are a result of irregularities of the top pavement layers while long wavelengths (10 m or longer) are caused by irregularities found in lower pavement layers. (Loizos, 2008)
PSD can also be evaluated in terms of roughness by plotting the PSD of elevation, PSD of slope, or vertical acceleration versus wavelength. The most commonly used are PSD of slope plots because they allow a direct view of the variance within a slope throughout a given distance of the pavement. Slope is also a more valuable parameter of pavement surface properties when wavelength is known. These plots can be used for the calculation of an index (Root Mean Square) of elevation or slope by calculating the area under the curve to evaluate pavement surface conditions. However, because they are dominated by longer wavelengths, these RMS values are not a reliable index measure of pavement surface smoothness. Additionally, these RMS indices do not consider parameters such as vehicle speed and characteristics in order to be used to evaluate ride quality. (Loizos, 2008) IRI and PSD are of limited value in predicting serviceability on short roadways, as they must have a reasonably long sample size to obtain accurate estimates; they are also not effective at pinpointing local defects.
To address these shortcomings, engineers have also analyzed profile data using Wavelet Theory (WT). This theory decomposes a signal into different frequency components and then presents each component with a resolution matched to its scale. It can detect sharp changes in magnitude of the profile as well as addressing the issue of location where irregularities and deformities occur. Therefore, the WT is able to identify the locations of surface revealing, depressions, settlement, potholes, surface heaving and humps, something that only manual labor intensive subjective procedures were previously able to measure accurately. The WT detects these problems through local analysis which reveals the aspects that the other signal analysis techniques miss (discontinuities in higher derivatives, breakdown points and trends). WT also addresses the issue of lost time information, which occurs in PSD analysis, by using short width and long width windows at high and low frequencies respectively. This gives WT an infinite set of possible basis functions and greatly reduced computation time. (Wei, Fwa et al.)
Study Population
As of May, 2014, 76 subjects participated in our study; however, not all of the subjects traveled over every surface. Surfaces 7 and 9 were added after 17 subjects had already participated in the study. Some subjects withdrew from the study before completing every surface due to time constraints
In order to test many subjects at once, we tested at several sites. Subjects 1-17 were tested at the Wild Wood Hotel in Snowmass, CO during the National Disabled Veterans Winter Sports Clinic. Subjects 28-45 were tested at the Richmond Convention Center in Richmond, VA during the National Veterans Wheelchair Games. All other subjects were tested at the Human Engineering Research Laboratories and University of Pittsburgh in Pittsburgh, PA.
Demographic Questionnaire Data
Of the 76 subjects tested, 60 were males and 16 were females. The average age for participants was 49.0 ± 13.8. There were 37 manual WC users and 39 power wheel chair users. Most reported spending between 6-24 hrs/day in their chair. 43.4% of subjects were either somewhat unsatisfied or very unsatisfied with the pathways they typically travel, and damaged or warped pathways were their biggest complaint. Table 4 contains the questionnaire results stated above.
Table 4: Participant Demographics
|
Number of Subjects |
76 |
|
Gender |
60 Male; 16 Female |
|
Average Age |
49.0 (±13.8) |
|
Chair Type: |
37 Manual; 39 Power |
|
Hours/Day in Wheelchair |
|
|
<1 hr |
0 |
|
1-2 hrs |
1 |
|
3-5 hrs |
8 |
|
6-12 hrs |
33 |
|
12-24 hrs |
33 |
|
Satisfaction with Typical Pathways |
|
|
Very Unsatisfied |
7 |
|
Kind of Unsatisfied |
26 |
|
Neutral |
14 |
|
Kind of Satisfied |
21 |
|
Very Satisfied |
8 |
|
Biggest Complaint About Pathways |
|
|
Roughness |
27 |
|
Cross Slope |
12 |
|
Steepness |
20 |
|
Damaged/Warped |
40 |
|
Average Days/week leaving home |
5.6 |
|
Average distance traveled per day |
|
|
<300 feet (1 block, 90 meters) |
8 |
|
300 to 3000 feet (1-10 blocks) |
23 |
|
3000 to 5000 feet (10-17 blocks) |
14 |
|
5000 to 10,000 feet (1-2 miles) |
12 |
|
10,000 to 20,000 feet (2-5 miles) |
13 |
|
>25,000 feet (5 miles) |
9 |
Roughness Calculation
Using the IRI as a model, the roughness index was found by summing the vertical deviations of the surface profile for a given horizontal distance. It was noted however that the wheel and crack size had significant influences on how a chair would react to the surface. If the crack depth was deep enough, the wheel would be suspended by the two sides of the surface and never hit the bottom as shown in Figure 122 {sic}. Therefore, if the depth of the cracks were doubled, the chair would have the exact same reaction to the surface. The diameter and flexibility of the wheel also will determine how far down into the gap the wheel will travel. For example, a 26in diameter hard rubber tire that may be on the rear axle of the WC will not drop into a crack as far as a 2.5in diameter wheel that may be on the front of a manual WC. Because of the multitude of tires available for WCs, it was decided to choose a "standard wheel" for the analysis. The one selected for analysis was considered the worst case tire; a 2.5 in diameter hard rubber wheel (which is often used as a front caster for manual WCs).
The laser data were filtered using a 3-point moving average filter to minimize the vertical deviations caused by the noise of the laser. A "wheelpath" algorithm was then run to determine how the "standard wheel" would travel over each surface profile. The Pathway Roughness Index was calculated by summing the vertical deviations of the wheelpath data. (Figure 133) {sic}
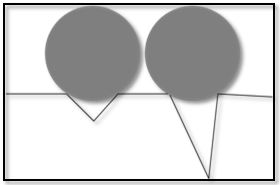
Figure 12: Schematic of Crack Depth
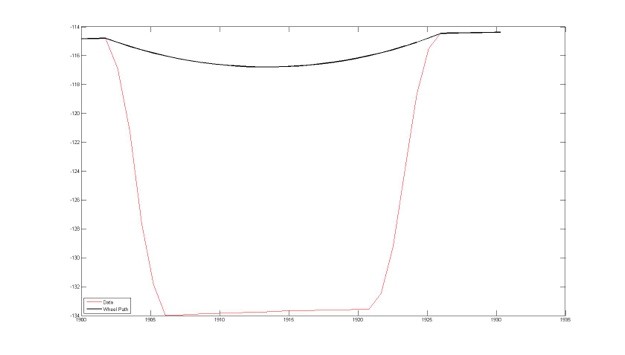
Figure 13: Picture of Wheelpath algorithm bridging a gap
The accelerations collected at the seat frame, footplates, and backrest were converted to RMS accelerations and VDV values.
Table 5 presents the average RMS accelerations and Table 6 presents the VDV values for each surface. As described earlier, ISO 2631-1 recommends using VDV instead of RMS when there are infrequent high magnitude shocks and the crest factor is greater than 9. Another way they suggest to determine which value to use is to use VDV if the following proportion is exceeded.
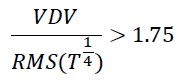
In our data analysis, this proportion was only reached at the seat accelerometer for two outside surfaces, which were both made of large concrete slabs. Because the ratio was less than 1.75 for all other surfaces, the rest of the data will only be presented as RMS accelerations.
Table 5: Average RMS Values

[Click image above to view HTML version]
Table 6: Average VDV Values

[Click image above to view HTML version]
Figure 14 is the graphical representation of the total RMS data for all surfaces based on roughness. The slopes of the linear trend lines show that as surface roughness increased, average RMS accelerations consequently increased. The slopes for the seat and footrest are similar while the slope for backrest is only about half that of the footrest. The R2 values show that the data fits the linear trend line fairly well.
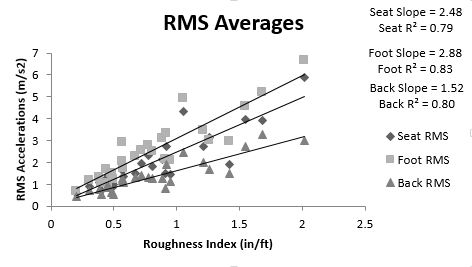
Figure 14: Total RMS Averages across all surfaces
Engineered vs. Outside
Figures 15-17 show the vibrations at the seat, footrest and backrest respectively with the engineered and outside surfaces separated. The seat values are of particular importance because vertical vibrations transferred through the seat of a seated individual are the most hazardous. The high R2 values for the engineered surfaces show that vibrations for a particular surface can be predicted by knowing the surfaces roughness. The lower R2 values for the outside surfaces show that there is a larger variation of data.
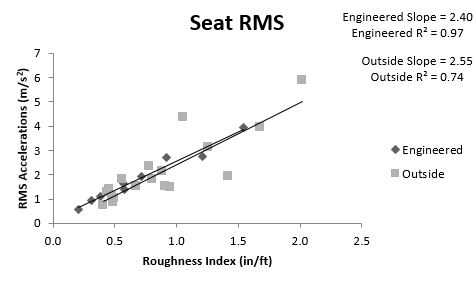
Figure 15: RMS for Seat
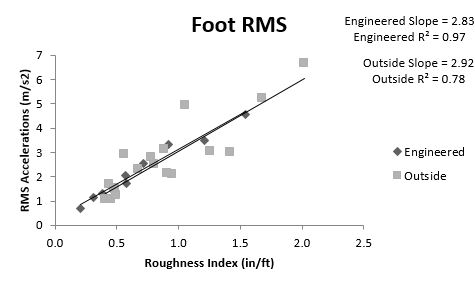
Figure 16: RMS for Footrest
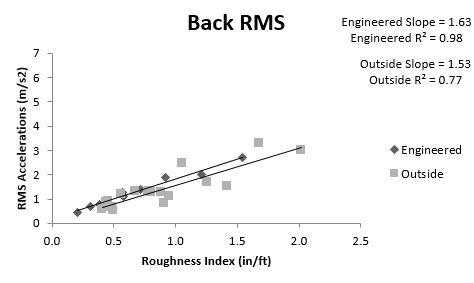
Figure 17: RMS for Backrest
Manual vs. Power (RMS Values)
Figure 18 shows the seat RMS values with manual and power WCs separated for all of the surfaces. The different slopes of the linear trend lines show that manual WCs will have a greater increase in vibrations for a particular increase in surface roughness than power WCs. The R2 values suggest that the data for both types of WCs the data is fairly linear.
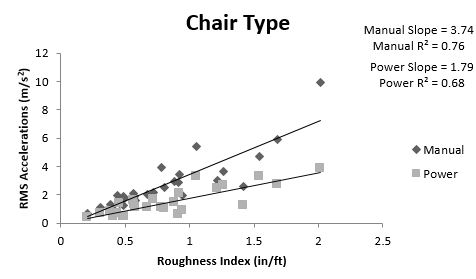
Figure 18: Seat RMS of Manual vs. Power wheelchair
The last section demonstrated that the vibration data for the engineered surfaces are much more consistent than the outside surfaces. Figure 19 displays the same axes as Figure 18 but with the engineered data only. The R2 values become much higher. The manual WC trend line still has a larger slope and overall the RMS values for manual WCs are higher than power WCs. The vibration data for the roughest three surfaces show that there might be some other surface characteristic besides roughness that is contributing to the data. The vibration data from surface 8 is lower than surface 7 (especially for manual WCs) even though surface 8 is rougher according to the roughness index. The characteristics of the surfaces show that surface 8 has smaller gaps than surface 7 (1.25 inches compared to 1.55 inches), but they occur at a higher frequency (every 4 inches compared to every 8 inches). This could indicate that the size of gaps in surfaces may be more important than the frequency of the gaps. Wolf et al found a similar result in their study when they found that a brick surface with small but highly frequent bevels resulted in lower vibrations than a concrete surface that had larger gaps at large intervals (4’) between the slabs. (Wolf, 2007)
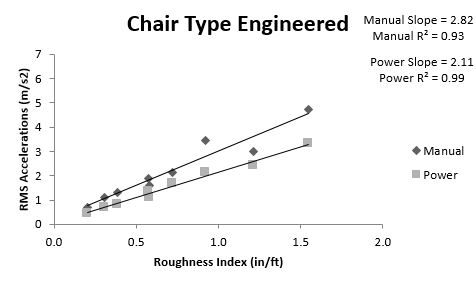
Figure 19: Seat RMS of Manual vs. Power Wheelchair Engineered
As shown in Table 5, the standard deviations of the RMS values for the engineered surfaces are roughly half the average indicating that there is large variability of data. For this reason, the majority of the data presented in this paper are presented as means without error or confidence levels. However, Figure 20 does show the average seat RMS data for all of the surfaces with 95 percent confidence bars.
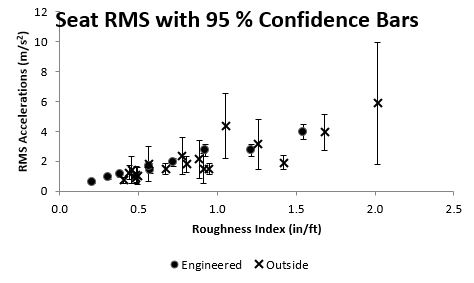
Figure 20: Seat RMS values with 95 percent confidence bars
Questionnaire Data
Table 7 displays the results from the surface questionnaire for all surfaces. Percent Acceptable is the percent of the subjects that answered that the surface was acceptable on the questionnaire. Rating mean is the average of the ratings that the subjects chose for each surface after they traveled over them. Figure 21 shows a graphical representation of the data presented in Table 7.
Table 7: Questionnaire Results
|
Roughness |
% Acceptable |
Rating Mean |
N |
Rating Std. Deviation |
|
0.205 |
100.00% |
4.48 |
75 |
0.75 |
|
0.309 |
95.90% |
3.92 |
74 |
0.91 |
|
0.383 |
98.60% |
3.79 |
75 |
0.98 |
|
0.405 |
100.00% |
3.9 |
15 |
0.78 |
|
0.441 |
100.00% |
4.32 |
11 |
0.68 |
|
0.457 |
100.00% |
4.33 |
9 |
0.56 |
|
0.485 |
100.00% |
4.09 |
11 |
0.63 |
|
0.486 |
100.00% |
4.17 |
15 |
0.72 |
|
0.494 |
100.00% |
4.64 |
11 |
0.45 |
|
0.565 |
87.50% |
4.06 |
8 |
0.56 |
|
0.572 |
86.50% |
3.24 |
75 |
1.04 |
|
0.578 |
90.40% |
3.44 |
73 |
1.1 |
|
0.673 |
60.00% |
2.23 |
15 |
1.24 |
|
0.718 |
84.50% |
3.13 |
72 |
1.16 |
|
0.778 |
100.00% |
3.09 |
11 |
0.77 |
|
0.804 |
100.00% |
3.13 |
15 |
0.97 |
|
0.885 |
85.70% |
2.86 |
8 |
0.75 |
|
0.914 |
90.90% |
4.05 |
11 |
0.76 |
|
0.921 |
71.90% |
2.64 |
58 |
1.12 |
|
0.947 |
100.00% |
3.53 |
15 |
0.97 |
|
1.053 |
25.00% |
2.13 |
8 |
0.83 |
|
1.213 |
63.00% |
2.58 |
73 |
1.35 |
|
1.26 |
77.80% |
2.94 |
9 |
1.07 |
|
1.421 |
20.00% |
1.43 |
15 |
0.82 |
|
1.545 |
41.40% |
1.82 |
58 |
1.12 |
|
1.68 |
27.30% |
1.32 |
11 |
0.98 |
|
2.017 |
12.50% |
1.19 |
8 |
1.1 |
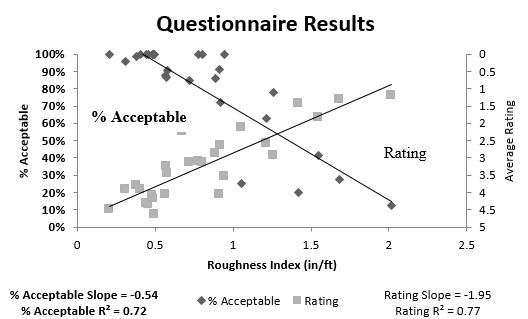
Figure 21: Questionnaire for All Surfaces
Engineered vs. Outside (Questionnaire Results)
Tables 8 and 9 and Figures 22 and 23 show the questionnaire results broken down by engineered and outdoor surfaces. The slopes of the linear trend lines for the engineered and outside surfaces are similar for both the Percent Acceptable and Rating data. However, just like with the RMS acceleration data, there is much more variability in the outside data than the engineered data as shown by the R2 values in both graphs.
Table 8: Engineered Questionnaire Results
|
Roughness |
% Acceptable |
Mean |
N |
Std. Deviation |
|
0.205 |
100.00% |
4.48 |
75 |
0.75 |
|
0.309 |
95.90% |
3.92 |
74 |
0.91 |
|
0.383 |
98.60% |
3.79 |
75 |
0.98 |
|
0.572 |
86.50% |
3.24 |
75 |
1.04 |
|
0.578 |
90.40% |
3.44 |
73 |
1.1 |
|
0.718 |
84.50% |
3.13 |
72 |
1.16 |
|
0.921 |
71.90% |
2.64 |
58 |
1.12 |
|
1.213 |
63.00% |
2.58 |
73 |
1.35 |
|
1.545 |
41.40% |
1.82 |
58 |
1.12 |
Table 9: Outdoor Questionnaire Results
|
Roughness |
% Acceptable |
Mean |
N |
Std. Deviation |
|
0.405 |
100.00% |
3.9 |
15 |
0.78 |
|
0.441 |
100.00% |
4.32 |
11 |
0.68 |
|
0.457 |
100.00% |
4.33 |
9 |
0.56 |
|
0.485 |
100.00% |
4.09 |
11 |
0.63 |
|
0.486 |
100.00% |
4.17 |
15 |
0.72 |
|
0.494 |
100.00% |
4.64 |
11 |
0.45 |
|
0.565 |
87.50% |
4.06 |
8 |
0.56 |
|
0.673 |
60.00% |
2.23 |
15 |
1.24 |
|
0.778 |
100.00% |
3.09 |
11 |
0.77 |
|
0.804 |
100.00% |
3.13 |
15 |
0.97 |
|
0.885 |
85.70% |
2.86 |
8 |
0.75 |
|
0.914 |
90.90% |
4.05 |
11 |
0.76 |
|
0.947 |
100.00% |
3.53 |
15 |
0.97 |
|
1.053 |
25.00% |
2.13 |
8 |
0.83 |
|
1.26 |
77.80% |
2.94 |
9 |
1.07 |
|
1.421 |
20.00% |
1.43 |
15 |
0.82 |
|
1.68 |
27.30% |
1.32 |
11 |
0.98 |
|
2.017 |
12.50% |
1.19 |
8 |
1.1 |
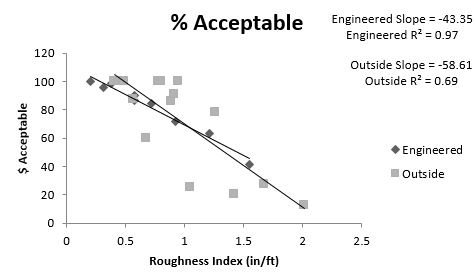
Figure 22: Percent Acceptable Engineered vs. Outside
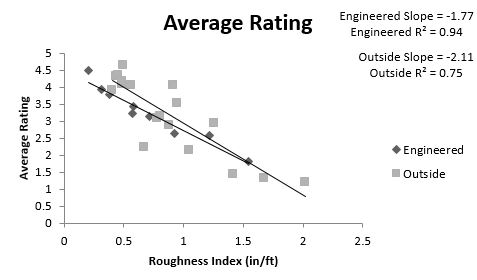
Figure 23: Average Rating Engineered vs. Outside
Manual vs. Power (Questionnaire Data)
Figures 24 and 25 show the results of the questionnaire data separated by manual and power WCs. It should be noted that even though manual WC users had higher vibrations for all engineered surfaces, on average they rated all surfaces better than power chair users.
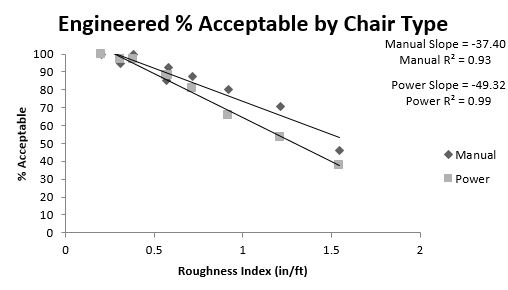
Figure 24: Percent Acceptable Manual vs. Power Wheelchair Engineered
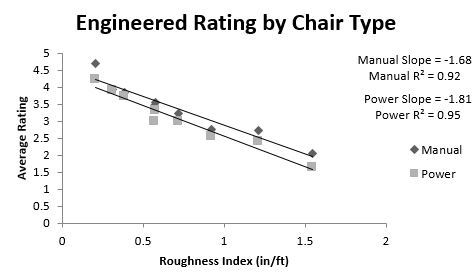
Figure 25: Rating Manual vs. Power Wheelchair Engineered
4. Implications for Standards
We found that RMS acceleration and subjective feedback is correlated to surface roughness. The engineered surfaces gave results that were much more linear than the outside surfaces. There are many reasons why this could have occurred. The engineered surfaces were laid on flat floors and constructed so that there would be very little vibrations caused by long wavelength deviations. While the outside surfaces chosen were as flat as possible, there may have been some long wavelength deviations that could have caused additional vibrations to some chairs. Also, while the subjects were traveling over the outside surfaces, their wheels were not hitting the same size of gaps at the same time as was the case on the engineered surfaces. The wheels also traveled over different lines on the surface and subsequently hit different cracks and bumps each time they traveled over the surface, which may have caused variations in the vibrations. Power chairs have wide enough drive wheels (usually around 3 in) that if they are traveling over a brick surface on a crack running with the direction of travel, the wheel might stay on top of alternating bricks and never drop into cracks. Another difference between the engineered and outdoor surfaces is that the boards for the engineered surfaces had sharp edges that could have caused greater vibrations than the used, worn edges of the outside surfaces.
When comparing manual WCs to power WCs, it was expected that manual WCs would have higher vibrations than power WCs. Manual wheel chairs usually have small, solid front tires to help them turn better, but they would also go further down into cracks and cause higher vibrations than the larger, softer power WC casters. Manual WCs are much lighter and are often made with a stiff welded frame and rarely have suspension which means that all of the force seen by the wheels is directly transferred through the frame to the seat. Some manual WCs do have caster and frame suspensions or are made of a few bolted pieces. Power WCs, on the other hand, have many bolted joints and almost all of them have suspension systems in the frame and on the casters.
The results show that some surfaces can cause health risks and discomfort to WC users. In order for sidewalks and pathways to better serve this population, there needs to be standards in place to regulate the surface roughnesses. A sample of what the measurement standard could look like is shown in Appendix D. The standard draft was sent to the ASTM International E17 Committee on Vehicle – Pavement Systems to review. Once a measurement standard is completed, there needs to be evaluation criteria for the surfaces. There are many ways to look at the data we have collected to determine a threshold. If the roughness threshold is based on the RMS vibrations, it could be the lower limit or the higher limit of the health guidance zone and it could be based on 1 hour or any other amount of time as shown in Table 10. If it is based on the questionnaire data, it could be the roughness equivalent of 75% acceptable, 50% acceptable, or any other percentage. It could be the roughness equivalent of the rating for "good (3.5)", "fair (2.5)", or somewhere else along the rating spectrum. Some possible options for the roughness thresholds are shown in Table 11 and 12. The lowest number of the possible thresholds is 0.18 in/ft which is lower than every surface we tested. The highest value is 2.42 in//ft which is higher than every surface we measured.
Table 10: Roughness Threshold Options (in/ft) Based on Seat RMS Vibrations

[Click image above to view HTML version]
Table 11: Roughness Threshold Options (in/ft) Based on %Acceptable Data

[Click image above to view HTML version]
Table 12: Roughness Threshold Options (in/ft) Based on Rating Data

[Click image above to view HTML version]
The value selected for the threshold in the standard would have to fall somewhere in the middle of these roughnesses. Looking at the questionnaire related indices in Table 11 and 12, the 50 % acceptable and the "fair" ratings are consistently around 1.20 in/ft. Four of the outdoor surfaces and two of the engineered surfaces we tested would be unacceptable if this was the threshold. It might also be an option to create a range similar to the ISO 2631-1 health guidance zone for the roughness indices. One threshold, such as 0.60 in/ft, could be a minimum limit where all surfaces under that roughness index are safe and comfortable. Another threshold, such as 1.20 in/ft, could be a value where all surface with an index above that roughness index will likely cause harmful vibrations and be uncomfortable for the WC user. Surfaces with indices between those two thresholds would be in a caution zone. It is important to remember that while WC users will not be driving on sidewalks for 16 hours a day, they are exposed to vibrations throughout the day that can all add up to harmful levels of WBVs for the day.
The wheelpath algorithm used to determine roughness uses a certain diameter wheel as the model wheel to determine the roughness index. In order to determine what the best wheel size is to use, the roughness index of the 27 surfaces were calculated using wheel sizes increasing by 0.5 inches from 2 to 7 inches. Figure 26 shows how the surface roughness changes as the wheel diameter is adjusted. The engineered surfaces are more affected by the changing wheel size because the roughness of those surfaces are determined solely by the gaps sizes and frequencies as opposed to the community surfaces that have some roughness contributions caused by changes in height from surface to surface (brick to brick or slab to slab) along the pathway.
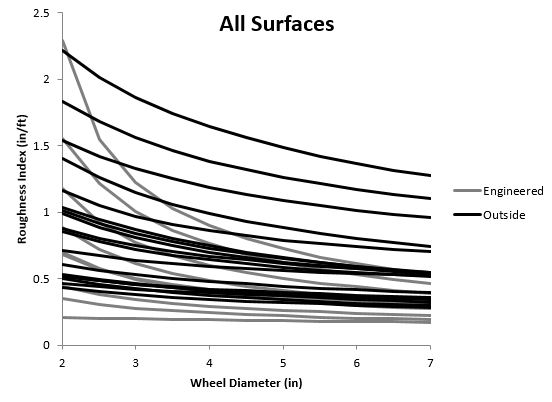
Figure 26: Picture of how roughness index is affected by wheel size
The average RMS values recorded at the seat were then plotted against the roughnesses of each surface and fitted with a linear trend line. The results are shown in Table 13. The wheel size with the highest R-squared value for the linear trend line is a 2.5 inch diameter wheel which means that the roughness calculated with that wheel size most accurately predicted the seat RMS vibration values. After we found this to be the best wheel size, we went back and adjusted all of the data presented in this report using a 2.5 in. diameter wheel size.
Table 13: R2 values for wheel sizes

[Click image above to view HTML version]
Developing this standard will likely not be met with universal praise. There will be historical societies that won’t want to replace bricks or other rough surfaces that have been the surface for hundreds of years (Boston, MA would be an example). Construction companies and anyone else who would have to comply with the standard may not like the extra work or the extra oversight. Cities, townships, and anyone else owning sidewalks may not like the restrictions that the standard will put on the type of surface that they can install. On the other side of the argument, there may be WC and accessibility advocacy groups that feel that the standard does not go far enough and should be more restrictive.
It could also be argued that the responsibility to limit harmful vibrations should be placed on the WC manufacturers. Many WCs, especially power WCs, have suspensions for this reason. However, WCs need to provide postural support and stability which makes it difficult to design them to reduce high amounts of vibrations. The way to reduce these vibrations should be by adapting the WCs and the environment to best fit the needs of those who use WCs. In fact, the standard could help WC manufactures better design WCs to filter out vibrations if they know the magnitude of vibrations that WCs are subjected to.
Limitations
Vibrations that WC users feel and perceive can be affected by a number of factors including the speed they travel, wheel type, wheel size, wheel base, suspension type, cushion type, etc. We try to address these issues by having the subjects use their own WCs so that they are used to its characteristics. The speed of 1 m/s was chosen for our study because it is an average traveling speed for WC users. The vibrations could be limited by having the WC users travel at a slower speed, but it is not desirable to limit WC users from traveling around their community by making it so that they have to travel at slow speeds to be safe and comfortable.
One limitation associated with this study is the use of wood to construct the engineered surfaces. Other than various wood decks, many commonly traveled surfaces are constructed from other materials such as concrete, brick, or tile. Not only is wood infrequent, but it also is easily warped and worn. Variations from the original wood plank may have occurred over time, causing different vibrations and affecting the quantitative data.
Visual bias is another limitation of the study. Although surface randomization was performed, the subjects were still able to see the surface on which they were traveling. Each group of wood planks was noticeably different from others. Subjects may have attempted to answer the questionnaire based on the visual appearance of what they saw they were traveling over rather than the vibrations that they felt. This may have had an effect on the qualitative data.
Future Work
There is ongoing research, development, and validation to design an apparatus capable of measuring surface roughness of sidewalks. The devices that are on the market to measure roadway roughness are not applicable to sidewalk and pedestrian surfaces because they either use accelerometers to measure the surface profile, which requires a higher speed than can be utilized for pedestrian surfaces, or they cannot measure at a resolution great enough to catch surface characteristics that can effect WC users (approximately 1 mm). The Pathway Measuring Tool (PathMeT) we have developed is capable of measuring the profile of the surface to a resolution of smaller than 1 mm. It will collect data while being pushed over the surface at a walking speed (approximately 1 m/s). It will also be able to determine other surface characteristics such as cross-slope, running slope, and instantaneous height changes which have limits already established in the ADAAG. It will also take pictures and record GPS data so that it can be stored in a database and be viewed on a system such as Google maps.
There could also be a study conducted where WC users around the country have accelerometers and GPS on their personal chairs (such as a smartphone) so that the vibrations they experience could be used to predict sidewalk roughness. If many WC users have high vibrations while traveling over the same sidewalk, then the sidewalk could be flagged as needing to be examined further.
All of the measured indices were based on the wheelpath algorithm explained earlier. However, the results of the vibration data showed that large gaps cause larger increases in RMS vibrations than increased frequency. Therefore, the wheelpath algorithm might need to be altered to better evaluate a surface. This could be done by adding algorithms that measures gap length and creates a factor that can be multiplied by the original wheelpath index. There could also be an algorithm created that would evaluate the surfaces based on PSD or WT so that the larger wavelengths of the surface deviations can be considered.
Another valuable tool that could be created would be an equation based on surface characteristics that would be able to predict user responses similar to the PSI equation discussed in the introduction. If an equation could be created based on surface characteristics and could accurately predict subjective user feedback, it would minimize the need for future subject testing and could be applied to a variety of surfaces that have not been tested by subjects.
5. Conclusions
WC users are exposed to WBVs that can be harmful and uncomfortable. Some characteristics of the WC can be adjusted to minimize these WBVs such as adding suspensions systems, using larger more compliant wheels, etc. However, any changes to a WC to reduce vibrations can cause negative outcomes to other performance properties such as its weight and resistance to propelling. This study found that surface characteristics, more specifically surface roughness, can have a large impact on the WBVs that WC users are exposed to.
Engineered surfaces showed that there is a high correlation between surface roughness and the WBVs which WC users are exposed to as well as their perceived comfort level while traveling over these surfaces. Manual WCs users are more susceptible to harmful WBVs, and as surface roughness increases, they are exposed to a larger increase in vibrations than power WC users.
A standard is being developed that would restrict new surfaces from being installed that would likely result in harmful WBVs to WC users who will use that surface to access their community. The goal is for the standard to be developed with and approved by ASTM International and then approved by the United States Access Board. The standard will then be used by city planners, construction workers, surveyors, etc. to evaluate if a current surface meets the standard or should be replaced. Software will also be developed to determine if a new design for a surface will meet the standard once it is installed.
6. Dissemination Activities
Publications and conferences
Pearlman JL, Cooper RA, Duvall JA, Livingston WR. Pedestrian Pathway Characteristics and Their Implications on Wheelchair Users. Journal of Assistive Technology
Pearlman JL. Sidewalk Roughness Standards Development. Presented at Road Profile Users’ Group Annual Meeting. Minneapolis, MN September 25-28, 2012
Duvall JA, Cooper RA, Sinagra EJ, Stuckey DR, Brown, JD, Pearlman JL. Development of Surface Roughness Standards for Pathways used by Wheelchairs. Presented at Transportation Research Board Annual Meeting. Washington D.C. January 13-17, 2013
Duvall JA, Cooper RA, Sinagra EJ, Stuckey DR, Brown, JD, Pearlman JL. Development of Surface Roughness Standards for Pathways used by Wheelchairs. Proceedings of Transportation Research Board Annual Conference. Washington D.C. January 13-17, 2013
Duvall JA, Cooper RA, Sinagra EJ, Stuckey DR, Brown, JD, Pearlman JL. Development of Surface Roughness Standards for Pathways used by Wheelchairs. Presented at Rehabilitation Engineering and Assistive Technology Society of North America Annual Meeting. Bellevue, WA June 20-24, 2013
Duvall, J., Sinagra, E., Stuckey, D., Cooper, R., Pearlman, J. Proposed Surface Roughness Standard for Pathways Used by Wheelchairs poster presented at the Transportation Research Board annual meeting 2014
Sinagra, E., Duvall, J., Cooper, R., Stuckey, D., Kortum, A., Pearlman, J. Development and Characterization of Pathway Measurement Tool Wheelchairs poster presented at the Transportation Research Board annual meeting 2014
Duvall, J., Sinagra, E., Pearlman, J. Development of Sidewalk Roughness Standards and Pathway Measurement Tool poster presented at the Pro Walk/Pro Bike/Pro Place conference Pittsburgh, PA September 8-9, 2014
7. References
Americans With Disabilities Act of 1990, 42 U.S.C.A § 12101 et seq. (1993)
Americans with Disability Act Accessibility Guidelines, 36 CFR Appendix D to Part 1191 (2010)
Boninger, M. L., Cooper, R.A., Fitzgerald, S.G., Lin, J., Cooper, R., Dicianno, B., Liu, B. (2003) Investigating neck pain in wheelchair users. American Journal of Physical Medicine and Rehabilitation, 82(3), 197-202.
Cooper, R.A., Thorman, T., Cooper, R., Dvorznak, M.J., Fitzgerald, S.G., Ammer, W,…Boninger, M.L. (2002). Driving Characteristics of Electric-Powered Wheelchair Users: How Far, Fast, and Often Do People Drive?. Archives of Physical Medicine and Rehabilitation, 83, 250-255
Cooper, R.A., Wolf, E., Fitzgerald, S.G., Dobson, A., Ammer, W., Boninger, M.L., Cooper, R. (2004). Evaluation of selected sidewalk pavement surfaces for vibration experienced by users of manual and power wheelchairs. Journal of Spinal Cord Medicine, 27, 468-475
Garcia-Mendez, Y. (2012) Assessing the risk of vibration exposure during wheelchair propulsion. (Master's Thesis). University of Pittsburgh
Gillespie, T. (1992). Everything You Always Wanted to Know about the IRI, But Were Afraid to Ask!. Proceedings from Road Profile Users Group Meeting September 22-24, 1992. Lincoln, NE
International Organization for Standardization. (1997). Mechanical vibration and shock-Evaluation of human exposure to whole-body vibrations. ISO 2631-1, Geneva, Switzerland
Latif, A.B. (2009) Relationship bewteen international roughness index (IRI) and present serviceability index (PSI). (Unpublished Thesis) Universiti Teknologi Malaysia.
Loizos, A. & C. Plati (2008) Evolutional Process of Pavement Roughness Evaluation Benefitting from Sensor Technology. International Journal on smart sensing and intelligent systems, 1(2), 370-387.
Pope, M. H. & Hansson, T.H. (1992) Vibration of the spine and low back pain. Clinical Orthopaedics and Related Research, 279, 49-59.
Pope, M.H., Wilder, D.G., Magnusson, M.L. (1999) A review of studies on seated whole body vibration and low back pain. Proceedings of The Institution of Mechanical Engineers Part H-journal of Engineering in Medicine, 213(6), 435-446.
Requejo, P.S., Maneekobkunwong, S., McNitt-Gray, J., Adkins, R., Waters, R. (2009) INFLUENCE OF HAND-RIM WHEELCHAIRS WITH REAR SUSPENSION ON SEAT FORCES AND HEAD ACCELERATION DURING CURB DESCENT LANDINGS. Journal or Rehabilitation Medicine, 41, 459-466.
Sayers, M.W. & Karamihas, S.M. (1998) The Little Book of Profiling: Basic Information about Measuring and Interpreting Road Profiles. Michigan: The regent of the University of Michigan
Shafizadeh, K., Mannering, F., Pierce, L. (2002) A Statistical Analysis of factors associated with driver-percieved road roughness on urban highways. (WA-RD 538.1). Springfield, VA, National Technical Information Service
Tolerico, M. (2006). Investigation of the Mobility Characteristics and Activity Levels of Manual Wheelchair Users in Two Real World Environments. (Unpublished Thesis) University of Pittsburgh, Pittsburgh, PA
VanSickle, D. P., Cooper, R.A., Boninger, M.L., DiGiovine, C.P. (2001) Analysis of vibrations induced during wheelchair propulsion. Journal of Rehabilitation Research and Development, 38(4), 409-421.
Wei, L., Fwa, T.F., Zhe, Z. (2004) Pavement Roughness Analysis Using Wavelet Theory. Proceedings from the 6th International Conference on Managing Pavements. Queensland Australia
Wolf, E., Cooper, R.A., Pearlman, J.L., Fitzgerald, S.G., Kelleher, A. (2007) Longitudinal assessment of vibrations during manual and power wheelchair driving over select sidewalk surfaces. Journal of Rehabilitation Research and Development , 44(4), 573-580.
Yamanaka, H. & Namerikawa, N. (2006). Evaluation method of road roughness profile using IRI index for sidewalks used by bicycles, wheelchairs and pedestrians. Infrastructure Planning Review, 23(4), 1065-1071.
Zimmerman, C. L., Cook, T.M., Goel, V.K. (1993) Effects of seated posture on erector spinae EMG activity during whole body vibration. Ergonomics, 36(6), 667-675.
APPENDIX A
QUESTIONNAIRE—ROUGHNESS VIBRATION STUDY
Instructions: For the following questions, please check your answer or fill in the blanks.
GENERAL INFORMATION
Test Date: ____ / ____ / ____
Age: _______
Gender:
[ ]Male
[ ] Female
Weight (lbs) ________
Height ________
Race/Ethnicity:
[ ] Black or African American ? American Indian or Alaskan Native
[ ] Asian ? Native Hawaiian or other Pacific Islander
[ ] White or Caucasian ? Two or more races
[ ] Hispanic or Latino
ACTIVITY
1. Are you able to walk? (check one answer)
[ ] No
[ ] Yes
1a. How far are you able to walk at one time? (Check one answer)
1[ ] I can walk around the house
2[ ] I can walk about one block
3[ ] I can walk about two blocks
4[ ] I can walk more than two blocks
1b. Is your wheelchair only for outdoor use? (Check one answer)
1[ ] No
2[ ] Yes
2. How many hours per day do you spend in a wheelchair? (Check one answer)
[ ] up to 1 hour per day
[ ] 6-12 hours per day
[ ] 1-2 hours per day
[ ] 12-24 hours per day
[ ] 3-5 hours per day
3. Please indicate the average amount of time you spend per day actually moving your wheelchair: (Propelling a manual chair or driving a power chair) (Check one answer)
[ ] 10-30 minutes per day
[ ] 1-2 hours per day
[ ] 30-60 minutes per day
[ ] other (please specify): __________________
4. In an average day, how many minutes or hours do you spend engaged in the following activities? (Responses may overlap: for example, if you spend 8 hours per day working on a computer at a desk, you would enter “8 hours” for “Working at a desk,” “Working at a computer,” and “Working with hands.” If you do not engage in any of these activities, enter “0” for both minutes and hours.)
Working at a desk: ________minutes OR ________hours
Working at a computer: ________minutes OR ________hours
Working with arms overhead: ________minutes OR ________hours
Working with hands: ________minutes OR ________hours
Driving (automobile): ________minutes OR ________hours
Reading: ________minutes OR ________hours
5. Please indicate the average number of transfers you do per day, from one place to another: (Example: Transferring from your wheelchair to the toilet and back again would be counted as 2 transfers)
________ transfers per day
6. On average, how many days a week do you leave your home in your wheelchair?
[ ] 1 day
[ ] 2 days
[ ] 3 days
[ ] 4 days
[ ] 5 days
[ ] 6 days
[ ] 7 days
7. On average, how far do you travel in your wheelchair per day?
[ ] <300 feet (1 block, 90 meters)
[ ] 300 to 3000 feet (1-10 blocks, 90-1000 meters)
[ ] 3000 to 5000 feet (10-17 blocks, 1000-1600 meters)
[ ] 5000 to 10,000 feet (1-2 miles, 1.5 to 3 km)
[ ] 10,000-25,000 feet (2-5 miles, 7.5 km)
[ ] Greater than 25,000 feet (5 miles, 7.5 km)
8. How satisfied are you with the pathways you typically travel on?
[ ] Very Unsatisfied
[ ] Somewhat Unsatisfied
[ ] Neutral
[ ] Somewhat Satisfied
[ ] Very Satisfied
[ ] No Answer
9. What is your biggest complaint with the pathways you typically travel on?
None Roughness Cross slope Steepness Damaged/Warped
10. What surfaces do you typically travel on during a normal day (Indicate Percent of Day)?
Indoor/Smooth _________________
Outdoor Concrete_______________
Outdoor Brick __________________
Outdoor Gravel/Sand __________ __
Other (please list surface type and percentage) _____________;____________
11. How difficult is it to propel or drive over these surfaces?
Indoor/Smooth Very Slightly Not at all No Answer
Outdoor Concrete Very Slightly Not at all No Answer
Outdoor Brick Very Slightly Not at all No Answer
Outdoor Gravel/Sand Very Slightly Not at all No Answer
Other____________ Very Slightly Not at all No Answer
WHEELCHAIR
1. What date did you start using a wheelchair? ______________________
2. Make (brand) of your primary wheelchair
[ ] Action/Invacare
[ ] Everest & Jennings
[ ] Guardian
[ ] Kuschall
[ ] Otto Bock
[ ] Colors
[ ] Permobil
[ ] Pride
[ ] Halls Wheels
[ ] Sunrise/Quickie
[ ] TiLite
[ ] Top End
[ ] Breezy
[ ] Evermed
[ ] Other: ________________
3. Model of your primary wheelchair: ____________________________________________
(if unsure, please look for a label on your wheelchair):
4. Wheelchair frame type: [ ] Folding [ ] Rigid
5. Does your wheelchair have shock absorbers in the frame? [ ] Yes [ ] No
6. Does your wheelchair have shock absorbers in the casters? [ ] Yes [ ] No
MEDICAL HISTORY
1. What was the condition that caused you to use a wheelchair? (Check one answer)
Date of injury or diagnosis: __________________
[ ] spinal cord injury (SCI)/paraplegia [ ] SCI/quadriplegia
Level of injury (e.g. T2, C4-6): _____________________
Is your injury:
[ ] Complete
[ ] Incomplete
[ ] upper extremity amputation
[ ] lower extremity amputation
[ ] spina bifida
[ ] brain injury
[ ] muscular dystrophy
[ ] stroke
[ ] arthritis
[ ] cerebral palsy
[ ] post-polio syndrome
[ ] multiple sclerosis
[ ] cardiopulmonary disease
[ ] other (please list): __________________________________________
2. Please indicate whether or not you have any of the following conditions: (Check all that apply)
[ ] arthritis (rheumatoid)
[ ] diabetes
[ ] liver disease
[ ] asthma
[ ] heart disease
[ ] depression
[ ] cancer
[ ] kidney problems
[ ] high blood pressure
[ ] circulation problems
[ ] thyroid
[ ] none of the above
[ ] other conditions (please list): ________________________________________________________
_____________________________________________________________________________________
3. Have you ever been diagnosed with any of the following conditions? (Check all that apply)
[ ] curvature of the spine (e.g., scoliosis)
[ ] myofascial pain syndrome
[ ] vertebral fracture
[ ] fibromyalgia
[ ] pinched nerve in neck
[ ] none of the above
4. For neck or back pain, are you currently taking any of the following types of medications? (If you check “yes,” please fill out the medication information in the space provided)
4a. Anti-inflammatory (e.g., Motrin, Advil, aspirin, Celebrex):
[ ] No
[ ] Yes
Medication Dose Frequency
_____________________ ____________ ____________________
_____________________ ____________ ___________________
_____________________ ____________ ___________________
4b. Analgesic/Pain medication (e.g., Tylenol, Darvocet):
[ ] No
[ ] Yes
Medication Dose Frequency
_____________________ ____________ ____________________
_____________________ ____________ ___________________
_____________________ ____________ ___________________
5. Have you had any surgeries on your neck or back? (If you check “yes,” please list the surgeries and dates in the space provided)
[ ] No
[ ] Yes
Surgery or Site Date (mo/yr)
_____________________________________ ____/____
_____________________________________ ____/____
_____________________________________ ____/____
_____________________________________ ____/____
_____________________________________ ____/____
_____________________________________ ____/____
NECK/UPPER BACK PAIN
1. Have you had any neck/upper back pain… (Check one answer for each of the following questions)
1a. …since 1 year after the onset of the condition that caused you to use a wheelchair?
[ ] No
[ ] Yes
1b. …within the past month?
[ ] No
[ ] Yes
1c. …within the past 24 hours?
[ ] No
[ ] Yes
If your answer is “NO” to ALL OF THE ABOVE QUESTIONS (1a-1c), you are finished with the questionnaire. Thank you very much for your assistance.
If you answered “YES” to any of the above questions, please complete the following sections describing your neck and upper back pain:
2. Did you to see a physician about the neck/upper back pain? (Check one answer)
[ ] No
[ ] Yes
2a. How many total doctor visits have you made concerning your pain?
________total doctor visits
3. Did the neck/upper back pain cause you to limit your daily activities? (Check one answer)
[ ] No
[ ] Yes
3a. For how long? ________________________________________________
4. Please use the three scales below to rate your neck/upper back pain over the past 24 hours. Draw a line at the point along the scale that best describes your pain. Use the upper line to describe your pain level right now. Use the other scales to rate your pain at its worst and best over the past 24 hours.
Example:
No pain |_____________________________________________________| Worst pain imaginable
4a. Right now
No pain |_____________________________________________________| Worst pain imaginable
4b. Worst in past 24 hours
No pain |_____________________________________________________| Worst pain imaginable
4c. Best in past 24 hours
No pain |_____________________________________________________| Worst pain imaginable
5. Read the following adjectives, and if that word is one you would use to describe the neck/upper back pain you have had during the past month, rate the intensity of that particular quality of your pain. If you have not experienced pain in the past month, enter “0” for that adjective.
(Please rate each of the following adjectives)
0 - None 1- Mild 2 - Moderate 3 – Severe
___ throbbing ___ heavy ___ stabbing
___ shooting ___ sore ___ tender
___ sharp ___ splitting ___ cramping
___ tiring/exhausting ___ gnawing ___ sickening
___ hot/burning ___ fearful ___ aching
___ punishing/cruel ___ tingling/pins and needles
6. Please indicate which of the following best describe the nature of the neck/upper back pain you have experienced during the past month:
6a. How long, on average, does an episode of pain last? (Check one answer)
[ ] Less than 10 minutes
[ ] Greater than 60 minutes
[ ] 10 to 60 minutes
[ ] The pain is constant
6b. How does the pain behave throughout the day? (Check one answer)
[ ] Constant throughout the day
[ ] Intermittent (on and off) throughout the day
6c. Is there a time during the day when the pain is worse? (Check one answer)
[ ] No
[ ] Yes
6c.1 When is the pain at its worst during the day? (Check one answer)
[ ] Worst in the morning
[ ] Worst following physical exertion
[ ] Worst in the evening
7. What activities or actions bring on the neck/upper back pain? __________________________
_____________________________________________________________________________
8. Once you have the pain, what activities or actions make the pain worse? _________________
_____________________________________________________________________________
9. What relieves the neck/upper back pain? _____________________________________
_______________________________________________________________________
10. Does your neck/upper back pain radiate (spread) to other parts of your body?
(Check one answer)
[ ] No
[ ] Yes
10a. Where?
11. Does your neck/upper back hurt while you are propelling your wheelchair?
(Check one answer)
[ ] No
[ ] Yes
12. Do you experience numbness of the arms with your neck/upper back pain?
(Check one answer)
[ ] No
[ ] Yes
13. Do you experience weakness of the arms with your neck/upper back pain? (Check one answer)
[ ] No
[ ] Yes
14. Did you have neck/upper back pain before you started using a wheelchair? (Check one answer)
[ ] No
[ ] Yes
14a. Do you think the pain is worse now that you are in a wheelchair?
(Check one answer)
[ ] No
[ ] Yes
15. The following questions are designed to give information as to how your neck/upper back pain has affected your ability to manage in everyday life. Please READ ALL ANSWERS in each section before marking the ONE answer that best applies to you.
Section 1—Pain Intensity
[ ] I have no pain at the moment
[ ] The pain is very mild at the moment
[ ] The pain is moderate at the moment
[ ] The pain is fairly severe at the moment
[ ] The pain is the worst imaginable at the moment
Section 2—Personal Care
[ ] I can look after myself normally without causing extra pain
[ ] I can look after myself normally but it causes extra pain
[ ] It is painful to look after myself and I am slow and careful
[ ] I need some help but manage most of my personal care
[ ] I need help every day in most aspects of health care
[ ] I do not get dressed, I wash with difficulty, and stay in bed
Section 3—Lifting
[ ] I can lift heavy weights without extra pain
[ ] I can lift heavy weights but it causes extra pain
[ ] Pain prevents me lifting heavy weights off the floor, but I can manage if they are conveniently positioned, e.g., on a table
[ ] Pain prevents me lifting heavy weights but I can manage light to medium weights if they are conveniently positioned
[ ] I can only lift very light weights
[ ] I cannot lift or carry anything at all
[ ] Pain does not limit my ability to lift or carry; however, my disability does
Section 4—Reading
[ ] I can read as much as I want to with no pain in my neck
[ ] I can read as much as I want to with slight pain in my neck
[ ] I can read as much as I want with moderate pain in my neck
[ ] I cannot read as much as I want because of moderate pain in my neck
[ ] I can hardly read at all because of severe pain in my neck
[ ] I cannot read at all
Section 5—Headaches
[ ] I have no headaches at all
[ ] I have slight headaches which come infrequently
[ ] I have moderate headaches which come infrequently
[ ] I have moderate headaches which come frequently
[ ] I have severe headaches which come frequently
[ ] I have headaches all the time
Section 6—Concentration
[ ] I can concentrate fully when I want to with no difficulty
[ ] I can concentrate fully when I want to with slight difficulty
[ ] I have a fair degree of difficulty in concentrating when I want to
[ ] I have a lot of difficulty in concentrating when I want to
[ ] I have a great deal of difficulty in concentrating when I want to
[ ] I cannot concentrate at all
Section 7—Work (not only for pay; includes volunteer work, household work, etc.)
[ ] I can do as much work as I want to
[ ] I can only do my usual work, but no more
[ ] I can do most of my usual work, but no more
[ ] I cannot do my usual work
[ ] I can hardly do any work at all
[ ] I cannot do any work at all
Section 8—Driving
[ ] I can drive my car without any neck pain
[ ] I can drive my car as long as I want with slight pain in my neck
[ ] I can drive my car as long as I want with moderate pain in my neck
[ ] I cannot drive my car as long as I want because of moderate pain in my neck
[ ] I can hardly drive at all because of severe pain in my neck
[ ] I cannot drive my car at all
[ ] Pain does not limit my ability to drive; however, my disability does
Section 9—Sleeping
[ ] I have no trouble sleeping
[ ] My sleep is slightly disturbed (less than 1 hour sleepless)
[ ] My sleep is mildly disturbed (1-2 hours sleepless)
[ ] My sleep is moderately disturbed (2-3 Hours sleepless)
[ ] My sleep is greatly disturbed (3-5 hours sleepless)
[ ] My sleep is completely disturbed (5-7 hours sleepless)
Section 10—Recreation
[ ] I am able to engage in all my recreation activities with no neck pain at all
[ ] I am able to engage in all my recreation activities, with some pain in my neck
[ ] I am able to engage in most, but not all of my usual recreation activities because of pain in my neck
[ ] I am able to engage in a few of my usual recreation activities because of pain in my neck
[ ] I can hardly do any recreation activities because of pain in my neck
[ ] I cannot do any recreation activities at all
Thank you very much for your assistance in completing this questionnaire.
.
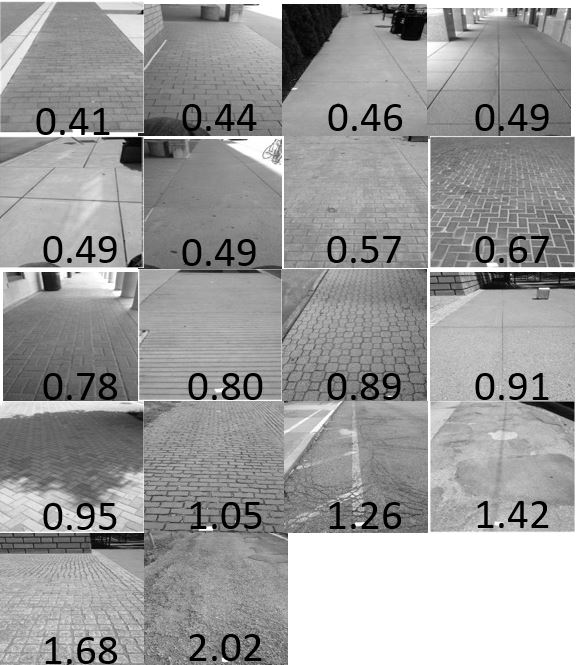
APPENDIX C
SUBJECTIVE RATING QUESTIONNAIRE
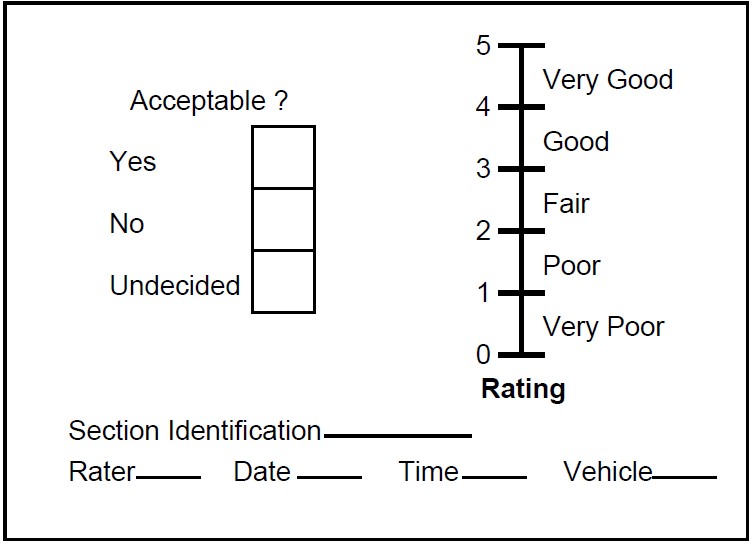
2. What was your pain/discomfort value associated with this surface (circle)?
0 1 2 3 4 5 6 7 8 9 10
None Extreme
3. What surface does this trial most feel like (put a mark in the most appropriate box)?
| New | Worn | Broken/warped | |
| Concrete | |||
| Brick | |||
| Cobblestone | |||
| Wood Deck | |||
| Other:_________ |
4. How would this surface hinder your decision to travel 5 blocks (5 football fields, 0.45km, 0.25mi) to get to a leisure activity?
Greatly Slightly Not at all
APPENDIX D
PROPOSED ASTM INTERNATIONAL STANDARD
Computing Pathway Roughness Index from Longitudinal Profile Measurements1
1This standard practice is under the jurisdiction of ASTM Committee E17 on Vehicle-Pavement Systems and is the direct responsibility of Subcommittee E17.33 Methodology for Analyzing Pavement Roughness
1. Scope
1.1 This practice covers the mathematical processing of longitudinal profile measurements to produce a pedestrian pathway roughness statistic called the Pathway Roughness Index (PRI).
1.2 This provides a standard practice for computing and reporting an estimate of pathway roughness for sidewalks and other pedestrian surfaces.
1.3 This practice is based on an algorithm developed at the University of Pittsburgh Human Engineering Research Laboratories sponsored by United States Access Board grants H133E070024 and H133N110011 and reported in a Transportation Research Board (TRB) paper [5].
1.4 The values stated in SI units are to be regarded as the standard. The inch-pound units given in parentheses are for information only.
1.5 This standard does not purport to address all of the safety concerns, if any, associated with its use. It is the responsibility of the user of this standard to establish appropriate safety and health practices and determine the applicability of regulatory limitations prior to use.
2. Referenced Documents
2.1 ASTM standards
E867 Standard Terminology Relating to Vehicle-Pavement Systems
E1364 Standard Test Method for Measuring Road Roughness by Static Level Method
E1926 Standard Practice for Computing International Roughness Index of Roads from Longitudinal Profile Measurements1
E1927 Standard Guide for Conducting Subjective Pavement Ride Quality Ratings
E2133 Standard Test Method for Using a Rolling Inclinometer to Measure Longitudinal and Transverse Profiles of a Traveled Surface
1This standard practice is under the jurisdiction of ASTM Committee E17 on Vehicle-Pavement Systems and is the direct responsibility of Subcommittee E17.33 Methodology for Analyzing Pavement Roughness
3. Terminology
3.1 Definitions:
3.1.1 Terminology used in this practice conforms to the definitions included in Terminology E867.
3.1.1.1 longitudinal profile measurement, n—a series of elevation values taken at a constant interval along a wheel track.
3.1.1.1.1 Discussion—Elevation measurements may be taken statically, as with rod and level per Test Method E1364 or dynamically using a rolling inclinometer per Test Method E2133.
3.1.1.2 traveled surface roughness—the deviations of a surface from a true planar surface with characteristics dimensions that affect vehicle dynamics, ride quality, dynamic loads, and drainage, for example, longitudinal profile, transverse profile, and cross slope.
3.1.1.3 wave number, n—the inverse of wavelength.
3.1.1.3.1 Discussion—Wave number, sometimes called spatial frequency, typically has units of cycle/m or cycle/ft.
3.1.2 Definitions of Terms Specific to This Standard:
3.1.2.1 Pathway Roughness Index (PRI), n—an index computed from a longitudinal profile measurement using a standard 70 mm (2.5 in.) diameter wheel with no deformation and no affects from speed. The index will be a representation of the total vertical deflection of that wheel as it would travel over the surface.
3.1.2.1.1 Discussion—PRI is reported in either millimeters per meter (mm/m) or inches per foot (in./ft).
3.1.2.2 Mean Pathway Roughness Index (MPRI), n—the average of the PRI values for multiple trials
3.1.2.2.1 Discussion—Units are in millimeters per meter or inches per foot.
3.1.2.3 true Pathway Roughness Index, n—the value of PRI that would be computed for a longitudinal profile measurement with the constant interval approaching zero.
3.1.2.4 wheel path, n—a line or path followed by a non-deformable tire of a wheeled vehicle on a traveled surface as it approaches zero speed.
4. Summary of Practice
4.1 This practice was developed specifically for estimating pathway roughness from longitudinal profile measurements.
4.2 Longitudinal profile measurements for one wheel track are transformed mathematically by a computer program and accumulated to obtain the PRI. The profile must be represented as a series of elevation values taken along with a series of horizontal distance values along the wheel track.
4.3 The PRI scale starts at zero for a surface with no roughness and covers positive numbers that increase in proportion to roughness. Figure 1 provides PRI value descriptors from research conducted at the Human Engineering Research Laboratories for simulated and community surfaces made of wood, segmental paving units, cast-in-place concrete, and asphalt.
5. Significance and Use
5.1 This practice provides a means for obtaining a quantitative estimate of a surface property defined as roughness using longitudinal profile measuring equipment.
5.1.1 The PRI is portable in that it can be obtained from longitudinal profiles obtained with a variety of instruments.
5.1.2 The PRI is stable with time because true PRI is based on the concept of a true longitudinal profile, rather than the physical properties of a particular type of instrument.
5.2 Roughness information will be a useful input to the pathway and sidewalk management systems maintained by municipal agencies.
5.2.2 When profiles are measured simultaneously for multiple traveled wheel tracks, then the MRI is considered to be a better measure of pathway surface roughness than the PRI for either wheel individually.
5.3 Pathway roughness data will be useful when determining the vibration exposure that a wheelchair user will experience.
5.3.1 Vibration exposure has been linked to pain and injuries in wheelchair users and the PRI of traveled surfaces will provide the ability to quantify the vibration exposure a wheelchair user will experience when traveling that surface.
5.3.2 Knowledge of the vibration exposure a wheelchair user will experience on traveled surfaces will allow them to take steps to minimize their exposure, reducing the likelihood of pain and injury.
NOTE 1—The MRI scale is identical to the PRI scale.
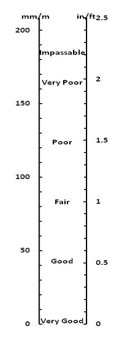
Fig. 1: Pathway Roughness Index and Ratings
6. Longitudinal Profile Measurement
6.1 The longitudinal profile measurements can be obtained from equipment that operate in a range of speeds from static to meters per second.
6.2 The elevation profile measuring equipment used to collect the longitudinal profile data used in this practice must have sufficient accuracy to measure the longitudinal profile attributes that are essential to the computation of the PRI.
7. Computation of Pathway Roughness Index
7.1 This practice computes a PRI from an algorithm developed at the Human Engineering Research Laboratories and described in the TRB paper [5].
7.2 The distance interval over which the PRI is computed is discretionary, but shall be reported along with the PRI results.
8. Report
8.1 Include the following information in the report for this practice:
8.1.1 Profile Measuring Device—The Class of the profile measuring device used to make the profile measurement per Test Method E2133 and Test Method E1364.
8.1.2 Longitudinal Profile Measurements—Data from the profile measuring process shall include the date and time of day of the measurement, the location of the measurement, length of measurement, and the descriptions of the surface being measured.
8.1.3 PRI Resolution—If units reported are mm/m, then report the PRI within two decimals. If the reported units are in./ft., then report the PRI within three decimals.
8.1.4 Profile Segment—If the entire profile of a measured surface was not used in the calculation of the PRI value, the report shall include which segment of the profile was used.
9. Precision and Bias
9.1 The precision and bias of the computed PRI is limited by the procedures used in making the longitudinal profile measurement.
9.2 For the effects of the precision and bias of the measured profile on the computed PRI, see precision and bias in Appendix X1.
10. Keywords
10.1 roughness; sidewalk; pathway roughness index; pathway; longitudinal profile; pedestrian.
APPENDIXES
(Nonmandatory information)
X.1 PRECISION AND BIAS
X1.1 Precision:
X1.1.1 The precision of the computed PRI is limited by the procedures used in making the longitudinal profile measurement
X1.1.2 PRI precision depends on the interval between adjacent profile elevation measures. Reducing the interval typically improves the precision. An interval of 1.0 mm (0.04 in.) or smaller is recommended. For some surface types, a shorter interval will improve precision. More information about the sensitivity of PRI to the profile data interval is being developed.
X1.1.4 PRI precision is limited by the degree to which a traveled path on the pathway can be profiled. Errors in locating the traveled path longitudinally and laterally can influence the PRI values, because the PRI will be computed for the profile of the traveled path as measured, rather than the travel path as intended. These errors are reduced by using longer profiles.
X1.1.5 If measurements are taken so that the least significant digit is 0.01 mm or smaller, Computational errors due to rounding can be safely ignored.
X1.2 Bias:
X1.2.1 The bias of the computed PRI is typically limited by the procedures used in making the longitudinal profile measurement.
X1.2.2 PRI bias depends on the interval between adjacent profile elevation measures. An interval of 1.0 mm (0.04 in.) or smaller is recommended. Shorter intervals improve precision but have little effect on bias. More information about the sensitivity of PRI to the profile data interval is being determined.
X1.2.3 Many forms of measurement error cause an upward bias in PRI due to variations in profile elevation from measurement error not correlated with the profile changes. Some common sources of positive PRI bias are: height-sensor round-off, mechanical vibrations in the instrument that are not corrected and electronic noise. Bias is reduced by using profiler instruments that minimize these errors.
REFERENCES
1. Boninger, M.L., et al., Investigating neck pain in wheelchair users. Am J Phys Med Rehabil, 2003. 82(3): p. 197-202.
2. DiGiovine, C.P., et al., Whole-body vibration during manual wheelchair propulsion with selected seat cushions and back supports. IEEE Trans Neural Syst Rehabil Eng, 2003. 11(3): p. 311-22.
3. Control, C.f.D. Falls among older adults: an Overview. 2013; Available from: http://www.cdc.gov/homeandrecreationalsafety/Falls/adultfalls.html
4. Duvall, J., et al., Proposed Surface Roughness Standard for Pathways used by Wheelchairs. Transportation Research Board 93nd Annual Meeting, 2014(14-4494).
5. Duvall, J., Cooper, R., Sinagra, E., Stuckey, D., Brown, J., & Pearlman, J. (2013). Development of Surface Roughness Standards for Pathways Used by Wheelchairs. Transportation Research Record, 2387, 149-156
User Comments/Questions
Add Comment/Question