Development of Surface Roughness Standards for Pathways Used by Wheelchair Users: Final Report
Road Roughness Measurements
The literature review found methods of measuring and recording surface profiles including the rod and level, dipstick, rolling straight-edge, profilograph (Figure 6), rolling profilers, Road-Response Type Measuring System (RRTMS) (Figure 7) and inertial profilers (Figure 8). One of the original methods was the profilograph, which was adopted in the early 1900’s, and can directly measure surface roughness by using an array of wheels on each side to establish a reference plane for measuring deviations. (Figure 6) The roughness is measured as the absolute sum of deviations of the center wheel. (Gillespie, 1992; Sayers, 1998)
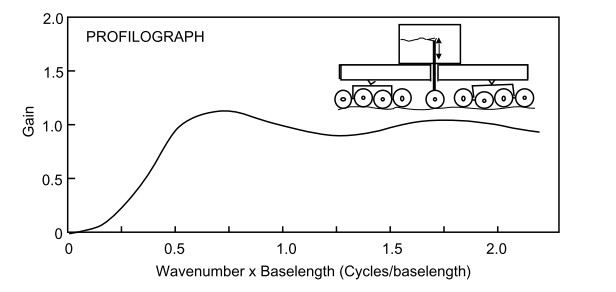
Figure 6: Schematic of Profilograph (Sayers and Karamihas 1998)
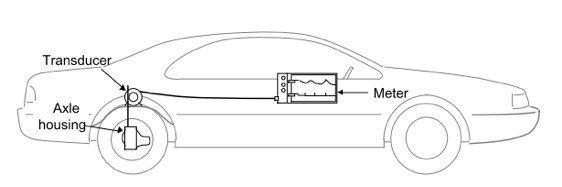
Figure 7: Schematic of RTRRMS (Sayers and Karamihas 1998)
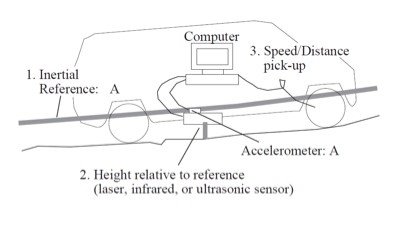
Figure 8: Schematic of Inertial Profiler (Sayers and Karamihas 1998)
During the 1960s, an automobile-mountable measurement device began a new era of surface roughness measurements, with some advantages and disadvantages. The major advantages of these systems were their low cost and their ability to mount onto any vehicle. These RTRRMS systems recorded cumulative axle displacement over a given distance and thus reported surface roughness as inches/mile. Also known as "road meters", two examples of these systems were the Mays Ride Meter and the PCA Meter. (Gillespie, 1992; Sayers, 1998)
The disadvantages to using the RTRRMS were the inconsistencies introduced by variations between the different commercialized RTRRMS systems and also that were mounted onto different automobiles that may have had different suspension systems. Consequently, measurements from identical surfaces could be different depending on which device and automobile were used. This effect was compounded by the influence of minor differences even within identical vehicles, such as fuel level, number of passengers, or tire pressure. With this variability, developing a consistent and reliable database of road roughness measures and related thresholds was impossible. The need for standardized and consistent measures was necessary throughout the world. This led to the development of an effort organized and conducted by the World Bank in Brazil in 1982 known as the International Road Roughness Experiment. One goal of the experiment was to establish a correlation and calibration standard for roughness measurements. In processing the data, it became clear that nearly all roughness measuring instruments in use throughout the world were capable of producing measures on the same scale, if that scale was suitably selected. A number of methods were tested, and the in/mi calibration reference from NCHRP Report 228 was found to be the most suitable for defining a universal scale. (Gillespie, 1992; Sayers, 1998)
Another method of measuring surface profiles is with an inertial profiler. (Figure 8) An inertial profiler uses an accelerometer and a non-contacting sensor, such as a laser transducer, to measure height. Data processing algorithms converts vertical acceleration measured by the accelerometer to an inertial reference that defines the instant height of the accelerometer in the host vehicle. The height of the reference from the ground is measured by the sensor and subtracted from the reference. The distance traveled is usually measured by wheel rotations or a speedometer. These profilers are convenient because they can be attached to any vehicle. However, because they use acceleration measurements, they are inaccurate at low speeds. Most roadway inertial profilers cannot measure accurately at speeds less than 15 km/hr. (Sayers, 1998)
The Present Serviceability Index (PSI) is another method of measuring surface roughness and performance of pavement. It is the first and most commonly used method for relative objective measures of surface condition with the public’s perception of serviceability. However, the primary use of PSI is to evaluate the ability of the pavement to serve its users by providing safe and smooth driving surfaces. Between 1958 and 1960, the American Association of State Highway Officials conducted a study of pavement performance on surfaces in Illinois, Minnesota, and Indiana. A panel of raters evaluated roadway surfaces by riding in a car over the pavement and filling out a PSR (Present Serviceability Rating) form. (Figure 9) While the PSR measurements were being conducted by the panelists, other objective measurements (Total crack length, slope variance, rutting depth, etc.) were being taken on the same roads. The PSI equation (Equation 3) was derived to be able to use the objective measurements of the road to predict the panel’s rating. These equations allowed objective measurements taken from a stretch of highway to predict the rider perception of that roadway and thus be a way to determine whether the pavement is acceptable or needs to be replaced. The PSI equations produce a scale of zero to five; five indicates an excellent ride condition while zero refers to a very poor ride quality. Manual observation is still considered possibly the strongest and most accurate evaluation of a road surface because of their attention to detail; however, it requires a substantial amount of human-hours and associated cost. (Sayers, 1998; Latif, 2009)
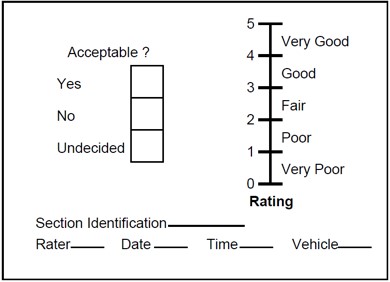
Figure 9: PSR Evaluation Form (Sayers and Karamihas 1998)
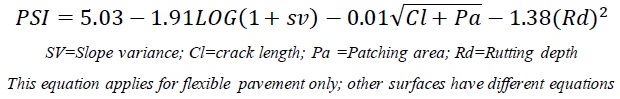
Equation 3: Present Serviceability Index
User Comments/Questions
Add Comment/Question