Development of Surface Roughness Standards for Pathways Used by Wheelchair Users: Final Report
Road Roughness Analysis
The literature review also found several approaches that have been used to process the surface roughness measurements into meaningful indices. These indices include moving average, Ride Number (RN), International Roughness Index (IRI), and Power Spectral Density (PSD). However, the gold-standard for designing and evaluating roadway roughness is the (IRI) which was developed by the International Road Roughness Experiment (IRRE) and establishes equivalence between several methods of roughness measurements. The IRI also has an ASTM standard measurement protocol for consistent measurements. (ASTM E1926) The IRI is the cumulative sum of displacement of the upper mass (Ms) of a standardized ‘quarter-car’ model when it is simulated to travel over a road profile (Z(x)) which was either measured, or generated for the purposes of designing a new roadway. The characteristics of the ‘quarter-car model are shown in Figure 10 (Sayers, 1998; Loizos, 2008)
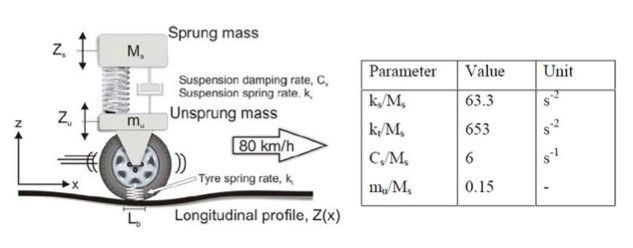
Figure 10: Quarter-car picture and variables (Loizos and Plati 2008)
The strength of the IRI is its stability and portability. Although the in/mi measure from RTRRMS has been popular since the 1940’s, as discussed above, values varied from one vehicle over time or from different vehicles on the same road. Since the IRI model is defined by its mathematical quarter-car model, it is not affected by the measurement procedure or the characteristics of the vehicle that was utilized in collecting the profile measures. Another important factor concerning the IRI is that it was designed to focus on road serviceability. Serviceability is a criterion measure for highway surfaces based on surface roughness, which is then used as a determinant need for rehabilitation of highway surfaces. (Figure 11) (Shafizadeh, 2002; Loizos, 2008)
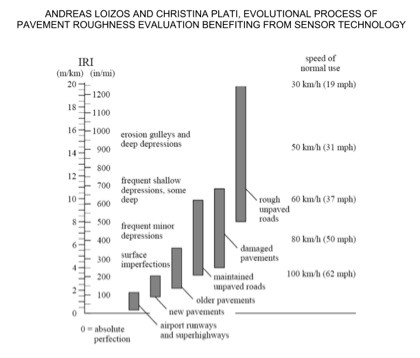
Figure 11: IRI Scale (Sayers and Karamihas 1998)
A study done in Japan addressed the usability of IRI on sidewalks used by WC’s. (Yamanaka, 2006) The study had ten subjects ride in a manual WC over nineteen different surfaces. The subjects were then asked to rate the smoothness of the ride and if they felt shaking. Vibration measurements were also recorded during the trials using speedometers attached to a caster wheel of the chair. Profile measurements were taken using a profilograph that could measure displacement on a 10mm interval. The results showed that there was a strong relationship between user assessment and vibration data. However, the relationship between the IRI and user assessment was not significant. The researchers concluded that this was probably due to the fact that the front tires of the WC would produce vibrations while running over small cracks and bumps that the profilograph, with a 10mm interval, could miss. Therefore the person would feel the bump, but the profilograph would not record it.
Although the IRI is accepted as a measure of serviceability in numerous countries, research has indicated that IRI may be limited in predicting serviceability because it is a broad measure of roughness and filters out potentially informative data from small areas of the roadway. Another analysis technique widely used to evaluate roughness is a Power Spectral Density (PSD) analysis of the road profiles.
The PSD provides a concise description of road roughness measured in frequencies and accompanying amplitudes. This is accomplished by describing the distribution of the pavement profile variance as a function of wavelength. The height (y) of the surface profile represents pavement roughness and is a function of spatial distance (x) along the pavement. To generate a PSD, a Fourier transform of the data is performed and scaled to show how the variance of the profile is spread over different frequencies. PSD analysis is valuable because it helps identify the source of the roughness. Short wavelengths (less than 3 m) are a result of irregularities of the top pavement layers while long wavelengths (10 m or longer) are caused by irregularities found in lower pavement layers. (Loizos, 2008)
PSD can also be evaluated in terms of roughness by plotting the PSD of elevation, PSD of slope, or vertical acceleration versus wavelength. The most commonly used are PSD of slope plots because they allow a direct view of the variance within a slope throughout a given distance of the pavement. Slope is also a more valuable parameter of pavement surface properties when wavelength is known. These plots can be used for the calculation of an index (Root Mean Square) of elevation or slope by calculating the area under the curve to evaluate pavement surface conditions. However, because they are dominated by longer wavelengths, these RMS values are not a reliable index measure of pavement surface smoothness. Additionally, these RMS indices do not consider parameters such as vehicle speed and characteristics in order to be used to evaluate ride quality. (Loizos, 2008) IRI and PSD are of limited value in predicting serviceability on short roadways, as they must have a reasonably long sample size to obtain accurate estimates; they are also not effective at pinpointing local defects.
To address these shortcomings, engineers have also analyzed profile data using Wavelet Theory (WT). This theory decomposes a signal into different frequency components and then presents each component with a resolution matched to its scale. It can detect sharp changes in magnitude of the profile as well as addressing the issue of location where irregularities and deformities occur. Therefore, the WT is able to identify the locations of surface revealing, depressions, settlement, potholes, surface heaving and humps, something that only manual labor intensive subjective procedures were previously able to measure accurately. The WT detects these problems through local analysis which reveals the aspects that the other signal analysis techniques miss (discontinuities in higher derivatives, breakdown points and trends). WT also addresses the issue of lost time information, which occurs in PSD analysis, by using short width and long width windows at high and low frequencies respectively. This gives WT an infinite set of possible basis functions and greatly reduced computation time. (Wei, Fwa et al.)
User Comments/Questions
Add Comment/Question