Development of Surface Roughness Standards for Pathways Used by Wheelchair Users: Final Report
Subject Testing
Study Population
As of May, 2014, 76 subjects participated in our study; however, not all of the subjects traveled over every surface. Surfaces 7 and 9 were added after 17 subjects had already participated in the study. Some subjects withdrew from the study before completing every surface due to time constraints
In order to test many subjects at once, we tested at several sites. Subjects 1-17 were tested at the Wild Wood Hotel in Snowmass, CO during the National Disabled Veterans Winter Sports Clinic. Subjects 28-45 were tested at the Richmond Convention Center in Richmond, VA during the National Veterans Wheelchair Games. All other subjects were tested at the Human Engineering Research Laboratories and University of Pittsburgh in Pittsburgh, PA.
Demographic Questionnaire Data
Of the 76 subjects tested, 60 were males and 16 were females. The average age for participants was 49.0 ± 13.8. There were 37 manual WC users and 39 power wheel chair users. Most reported spending between 6-24 hrs/day in their chair. 43.4% of subjects were either somewhat unsatisfied or very unsatisfied with the pathways they typically travel, and damaged or warped pathways were their biggest complaint. Table 4 contains the questionnaire results stated above.
Table 4: Participant Demographics
|
Number of Subjects |
76 |
|
Gender |
60 Male; 16 Female |
|
Average Age |
49.0 (±13.8) |
|
Chair Type: |
37 Manual; 39 Power |
|
Hours/Day in Wheelchair |
|
|
<1 hr |
0 |
|
1-2 hrs |
1 |
|
3-5 hrs |
8 |
|
6-12 hrs |
33 |
|
12-24 hrs |
33 |
|
Satisfaction with Typical Pathways |
|
|
Very Unsatisfied |
7 |
|
Kind of Unsatisfied |
26 |
|
Neutral |
14 |
|
Kind of Satisfied |
21 |
|
Very Satisfied |
8 |
|
Biggest Complaint About Pathways |
|
|
Roughness |
27 |
|
Cross Slope |
12 |
|
Steepness |
20 |
|
Damaged/Warped |
40 |
|
Average Days/week leaving home |
5.6 |
|
Average distance traveled per day |
|
|
<300 feet (1 block, 90 meters) |
8 |
|
300 to 3000 feet (1-10 blocks) |
23 |
|
3000 to 5000 feet (10-17 blocks) |
14 |
|
5000 to 10,000 feet (1-2 miles) |
12 |
|
10,000 to 20,000 feet (2-5 miles) |
13 |
|
>25,000 feet (5 miles) |
9 |
Roughness Calculation
Using the IRI as a model, the roughness index was found by summing the vertical deviations of the surface profile for a given horizontal distance. It was noted however that the wheel and crack size had significant influences on how a chair would react to the surface. If the crack depth was deep enough, the wheel would be suspended by the two sides of the surface and never hit the bottom as shown in Figure 122 {sic}. Therefore, if the depth of the cracks were doubled, the chair would have the exact same reaction to the surface. The diameter and flexibility of the wheel also will determine how far down into the gap the wheel will travel. For example, a 26in diameter hard rubber tire that may be on the rear axle of the WC will not drop into a crack as far as a 2.5in diameter wheel that may be on the front of a manual WC. Because of the multitude of tires available for WCs, it was decided to choose a "standard wheel" for the analysis. The one selected for analysis was considered the worst case tire; a 2.5 in diameter hard rubber wheel (which is often used as a front caster for manual WCs).
The laser data were filtered using a 3-point moving average filter to minimize the vertical deviations caused by the noise of the laser. A "wheelpath" algorithm was then run to determine how the "standard wheel" would travel over each surface profile. The Pathway Roughness Index was calculated by summing the vertical deviations of the wheelpath data. (Figure 133) {sic}
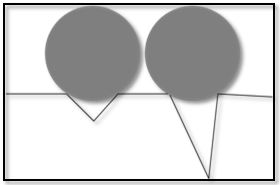
Figure 12: Schematic of Crack Depth
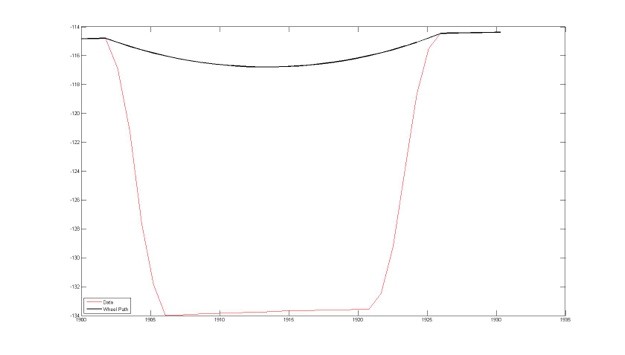
Figure 13: Picture of Wheelpath algorithm bridging a gap
The accelerations collected at the seat frame, footplates, and backrest were converted to RMS accelerations and VDV values.
Table 5 presents the average RMS accelerations and Table 6 presents the VDV values for each surface. As described earlier, ISO 2631-1 recommends using VDV instead of RMS when there are infrequent high magnitude shocks and the crest factor is greater than 9. Another way they suggest to determine which value to use is to use VDV if the following proportion is exceeded.
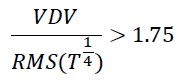
In our data analysis, this proportion was only reached at the seat accelerometer for two outside surfaces, which were both made of large concrete slabs. Because the ratio was less than 1.75 for all other surfaces, the rest of the data will only be presented as RMS accelerations.
Table 5: Average RMS Values

[Click image above to view HTML version]
Table 6: Average VDV Values

[Click image above to view HTML version]
Figure 14 is the graphical representation of the total RMS data for all surfaces based on roughness. The slopes of the linear trend lines show that as surface roughness increased, average RMS accelerations consequently increased. The slopes for the seat and footrest are similar while the slope for backrest is only about half that of the footrest. The R2 values show that the data fits the linear trend line fairly well.
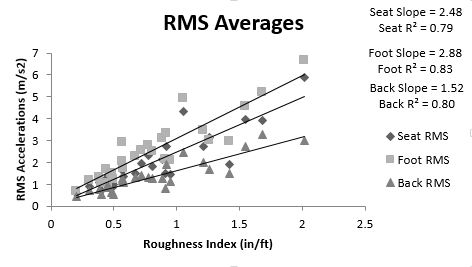
Figure 14: Total RMS Averages across all surfaces
Engineered vs. Outside
Figures 15-17 show the vibrations at the seat, footrest and backrest respectively with the engineered and outside surfaces separated. The seat values are of particular importance because vertical vibrations transferred through the seat of a seated individual are the most hazardous. The high R2 values for the engineered surfaces show that vibrations for a particular surface can be predicted by knowing the surfaces roughness. The lower R2 values for the outside surfaces show that there is a larger variation of data.
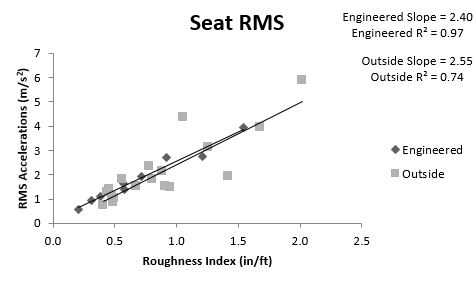
Figure 15: RMS for Seat
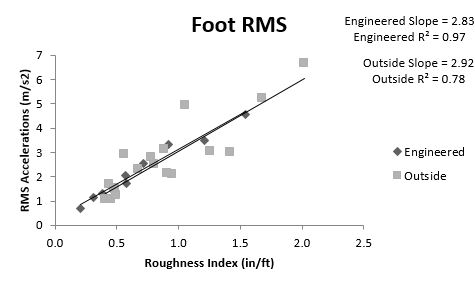
Figure 16: RMS for Footrest
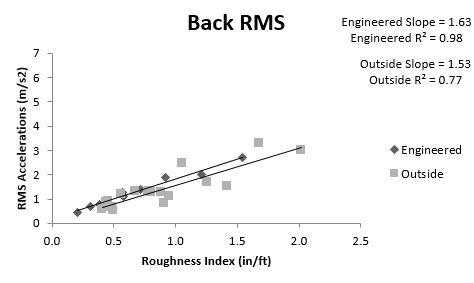
Figure 17: RMS for Backrest
Manual vs. Power (RMS Values)
Figure 18 shows the seat RMS values with manual and power WCs separated for all of the surfaces. The different slopes of the linear trend lines show that manual WCs will have a greater increase in vibrations for a particular increase in surface roughness than power WCs. The R2 values suggest that the data for both types of WCs the data is fairly linear.
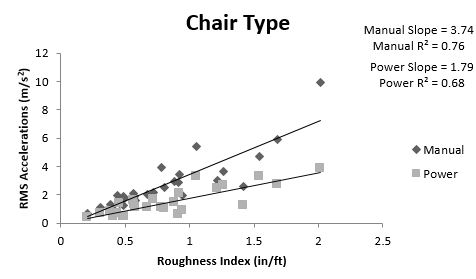
Figure 18: Seat RMS of Manual vs. Power wheelchair
The last section demonstrated that the vibration data for the engineered surfaces are much more consistent than the outside surfaces. Figure 19 displays the same axes as Figure 18 but with the engineered data only. The R2 values become much higher. The manual WC trend line still has a larger slope and overall the RMS values for manual WCs are higher than power WCs. The vibration data for the roughest three surfaces show that there might be some other surface characteristic besides roughness that is contributing to the data. The vibration data from surface 8 is lower than surface 7 (especially for manual WCs) even though surface 8 is rougher according to the roughness index. The characteristics of the surfaces show that surface 8 has smaller gaps than surface 7 (1.25 inches compared to 1.55 inches), but they occur at a higher frequency (every 4 inches compared to every 8 inches). This could indicate that the size of gaps in surfaces may be more important than the frequency of the gaps. Wolf et al found a similar result in their study when they found that a brick surface with small but highly frequent bevels resulted in lower vibrations than a concrete surface that had larger gaps at large intervals (4’) between the slabs. (Wolf, 2007)
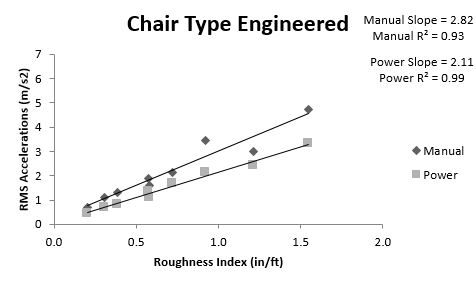
Figure 19: Seat RMS of Manual vs. Power Wheelchair Engineered
As shown in Table 5, the standard deviations of the RMS values for the engineered surfaces are roughly half the average indicating that there is large variability of data. For this reason, the majority of the data presented in this paper are presented as means without error or confidence levels. However, Figure 20 does show the average seat RMS data for all of the surfaces with 95 percent confidence bars.
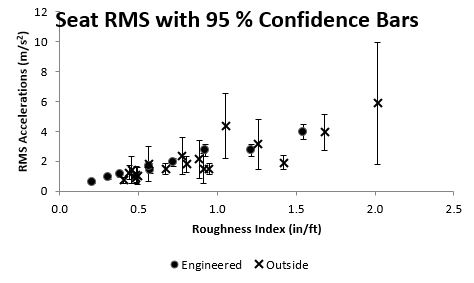
Figure 20: Seat RMS values with 95 percent confidence bars
Questionnaire Data
Table 7 displays the results from the surface questionnaire for all surfaces. Percent Acceptable is the percent of the subjects that answered that the surface was acceptable on the questionnaire. Rating mean is the average of the ratings that the subjects chose for each surface after they traveled over them. Figure 21 shows a graphical representation of the data presented in Table 7.
Table 7: Questionnaire Results
|
Roughness |
% Acceptable |
Rating Mean |
N |
Rating Std. Deviation |
|
0.205 |
100.00% |
4.48 |
75 |
0.75 |
|
0.309 |
95.90% |
3.92 |
74 |
0.91 |
|
0.383 |
98.60% |
3.79 |
75 |
0.98 |
|
0.405 |
100.00% |
3.9 |
15 |
0.78 |
|
0.441 |
100.00% |
4.32 |
11 |
0.68 |
|
0.457 |
100.00% |
4.33 |
9 |
0.56 |
|
0.485 |
100.00% |
4.09 |
11 |
0.63 |
|
0.486 |
100.00% |
4.17 |
15 |
0.72 |
|
0.494 |
100.00% |
4.64 |
11 |
0.45 |
|
0.565 |
87.50% |
4.06 |
8 |
0.56 |
|
0.572 |
86.50% |
3.24 |
75 |
1.04 |
|
0.578 |
90.40% |
3.44 |
73 |
1.1 |
|
0.673 |
60.00% |
2.23 |
15 |
1.24 |
|
0.718 |
84.50% |
3.13 |
72 |
1.16 |
|
0.778 |
100.00% |
3.09 |
11 |
0.77 |
|
0.804 |
100.00% |
3.13 |
15 |
0.97 |
|
0.885 |
85.70% |
2.86 |
8 |
0.75 |
|
0.914 |
90.90% |
4.05 |
11 |
0.76 |
|
0.921 |
71.90% |
2.64 |
58 |
1.12 |
|
0.947 |
100.00% |
3.53 |
15 |
0.97 |
|
1.053 |
25.00% |
2.13 |
8 |
0.83 |
|
1.213 |
63.00% |
2.58 |
73 |
1.35 |
|
1.26 |
77.80% |
2.94 |
9 |
1.07 |
|
1.421 |
20.00% |
1.43 |
15 |
0.82 |
|
1.545 |
41.40% |
1.82 |
58 |
1.12 |
|
1.68 |
27.30% |
1.32 |
11 |
0.98 |
|
2.017 |
12.50% |
1.19 |
8 |
1.1 |
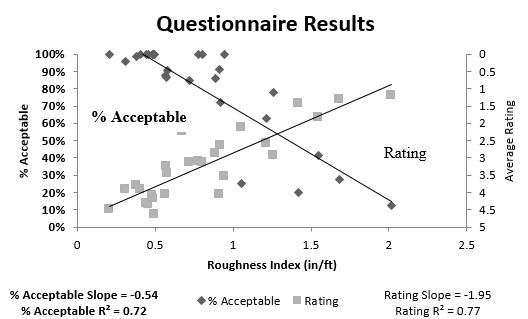
Figure 21: Questionnaire for All Surfaces
Engineered vs. Outside (Questionnaire Results)
Tables 8 and 9 and Figures 22 and 23 show the questionnaire results broken down by engineered and outdoor surfaces. The slopes of the linear trend lines for the engineered and outside surfaces are similar for both the Percent Acceptable and Rating data. However, just like with the RMS acceleration data, there is much more variability in the outside data than the engineered data as shown by the R2 values in both graphs.
Table 8: Engineered Questionnaire Results
|
Roughness |
% Acceptable |
Mean |
N |
Std. Deviation |
|
0.205 |
100.00% |
4.48 |
75 |
0.75 |
|
0.309 |
95.90% |
3.92 |
74 |
0.91 |
|
0.383 |
98.60% |
3.79 |
75 |
0.98 |
|
0.572 |
86.50% |
3.24 |
75 |
1.04 |
|
0.578 |
90.40% |
3.44 |
73 |
1.1 |
|
0.718 |
84.50% |
3.13 |
72 |
1.16 |
|
0.921 |
71.90% |
2.64 |
58 |
1.12 |
|
1.213 |
63.00% |
2.58 |
73 |
1.35 |
|
1.545 |
41.40% |
1.82 |
58 |
1.12 |
Table 9: Outdoor Questionnaire Results
|
Roughness |
% Acceptable |
Mean |
N |
Std. Deviation |
|
0.405 |
100.00% |
3.9 |
15 |
0.78 |
|
0.441 |
100.00% |
4.32 |
11 |
0.68 |
|
0.457 |
100.00% |
4.33 |
9 |
0.56 |
|
0.485 |
100.00% |
4.09 |
11 |
0.63 |
|
0.486 |
100.00% |
4.17 |
15 |
0.72 |
|
0.494 |
100.00% |
4.64 |
11 |
0.45 |
|
0.565 |
87.50% |
4.06 |
8 |
0.56 |
|
0.673 |
60.00% |
2.23 |
15 |
1.24 |
|
0.778 |
100.00% |
3.09 |
11 |
0.77 |
|
0.804 |
100.00% |
3.13 |
15 |
0.97 |
|
0.885 |
85.70% |
2.86 |
8 |
0.75 |
|
0.914 |
90.90% |
4.05 |
11 |
0.76 |
|
0.947 |
100.00% |
3.53 |
15 |
0.97 |
|
1.053 |
25.00% |
2.13 |
8 |
0.83 |
|
1.26 |
77.80% |
2.94 |
9 |
1.07 |
|
1.421 |
20.00% |
1.43 |
15 |
0.82 |
|
1.68 |
27.30% |
1.32 |
11 |
0.98 |
|
2.017 |
12.50% |
1.19 |
8 |
1.1 |
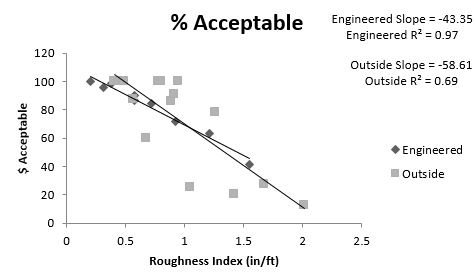
Figure 22: Percent Acceptable Engineered vs. Outside
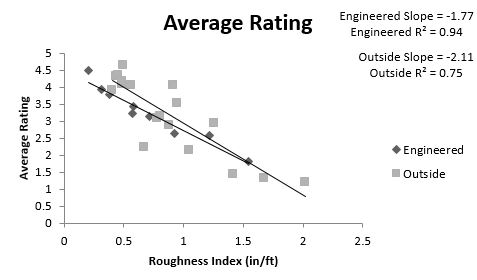
Figure 23: Average Rating Engineered vs. Outside
Manual vs. Power (Questionnaire Data)
Figures 24 and 25 show the results of the questionnaire data separated by manual and power WCs. It should be noted that even though manual WC users had higher vibrations for all engineered surfaces, on average they rated all surfaces better than power chair users.
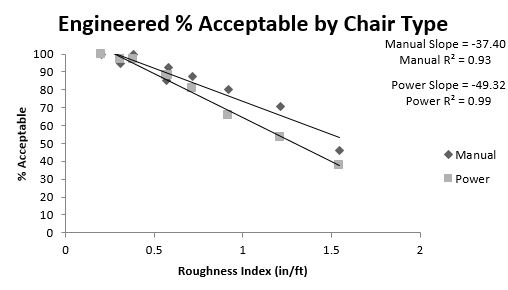
Figure 24: Percent Acceptable Manual vs. Power Wheelchair Engineered
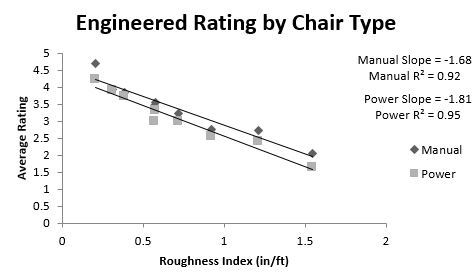
Figure 25: Rating Manual vs. Power Wheelchair Engineered
User Comments/Questions
Add Comment/Question