Development of Surface Roughness Standards for Pathways Used by Wheelchair Users: Final Report
4. Implications for Standards
We found that RMS acceleration and subjective feedback is correlated to surface roughness. The engineered surfaces gave results that were much more linear than the outside surfaces. There are many reasons why this could have occurred. The engineered surfaces were laid on flat floors and constructed so that there would be very little vibrations caused by long wavelength deviations. While the outside surfaces chosen were as flat as possible, there may have been some long wavelength deviations that could have caused additional vibrations to some chairs. Also, while the subjects were traveling over the outside surfaces, their wheels were not hitting the same size of gaps at the same time as was the case on the engineered surfaces. The wheels also traveled over different lines on the surface and subsequently hit different cracks and bumps each time they traveled over the surface, which may have caused variations in the vibrations. Power chairs have wide enough drive wheels (usually around 3 in) that if they are traveling over a brick surface on a crack running with the direction of travel, the wheel might stay on top of alternating bricks and never drop into cracks. Another difference between the engineered and outdoor surfaces is that the boards for the engineered surfaces had sharp edges that could have caused greater vibrations than the used, worn edges of the outside surfaces.
When comparing manual WCs to power WCs, it was expected that manual WCs would have higher vibrations than power WCs. Manual wheel chairs usually have small, solid front tires to help them turn better, but they would also go further down into cracks and cause higher vibrations than the larger, softer power WC casters. Manual WCs are much lighter and are often made with a stiff welded frame and rarely have suspension which means that all of the force seen by the wheels is directly transferred through the frame to the seat. Some manual WCs do have caster and frame suspensions or are made of a few bolted pieces. Power WCs, on the other hand, have many bolted joints and almost all of them have suspension systems in the frame and on the casters.
The results show that some surfaces can cause health risks and discomfort to WC users. In order for sidewalks and pathways to better serve this population, there needs to be standards in place to regulate the surface roughnesses. A sample of what the measurement standard could look like is shown in Appendix D. The standard draft was sent to the ASTM International E17 Committee on Vehicle – Pavement Systems to review. Once a measurement standard is completed, there needs to be evaluation criteria for the surfaces. There are many ways to look at the data we have collected to determine a threshold. If the roughness threshold is based on the RMS vibrations, it could be the lower limit or the higher limit of the health guidance zone and it could be based on 1 hour or any other amount of time as shown in Table 10. If it is based on the questionnaire data, it could be the roughness equivalent of 75% acceptable, 50% acceptable, or any other percentage. It could be the roughness equivalent of the rating for "good (3.5)", "fair (2.5)", or somewhere else along the rating spectrum. Some possible options for the roughness thresholds are shown in Table 11 and 12. The lowest number of the possible thresholds is 0.18 in/ft which is lower than every surface we tested. The highest value is 2.42 in//ft which is higher than every surface we measured.
Table 10: Roughness Threshold Options (in/ft) Based on Seat RMS Vibrations

[Click image above to view HTML version]
Table 11: Roughness Threshold Options (in/ft) Based on %Acceptable Data

[Click image above to view HTML version]
Table 12: Roughness Threshold Options (in/ft) Based on Rating Data

[Click image above to view HTML version]
The value selected for the threshold in the standard would have to fall somewhere in the middle of these roughnesses. Looking at the questionnaire related indices in Table 11 and 12, the 50 % acceptable and the "fair" ratings are consistently around 1.20 in/ft. Four of the outdoor surfaces and two of the engineered surfaces we tested would be unacceptable if this was the threshold. It might also be an option to create a range similar to the ISO 2631-1 health guidance zone for the roughness indices. One threshold, such as 0.60 in/ft, could be a minimum limit where all surfaces under that roughness index are safe and comfortable. Another threshold, such as 1.20 in/ft, could be a value where all surface with an index above that roughness index will likely cause harmful vibrations and be uncomfortable for the WC user. Surfaces with indices between those two thresholds would be in a caution zone. It is important to remember that while WC users will not be driving on sidewalks for 16 hours a day, they are exposed to vibrations throughout the day that can all add up to harmful levels of WBVs for the day.
The wheelpath algorithm used to determine roughness uses a certain diameter wheel as the model wheel to determine the roughness index. In order to determine what the best wheel size is to use, the roughness index of the 27 surfaces were calculated using wheel sizes increasing by 0.5 inches from 2 to 7 inches. Figure 26 shows how the surface roughness changes as the wheel diameter is adjusted. The engineered surfaces are more affected by the changing wheel size because the roughness of those surfaces are determined solely by the gaps sizes and frequencies as opposed to the community surfaces that have some roughness contributions caused by changes in height from surface to surface (brick to brick or slab to slab) along the pathway.
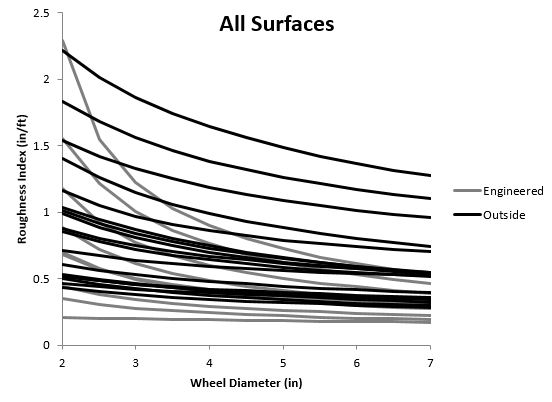
Figure 26: Picture of how roughness index is affected by wheel size
The average RMS values recorded at the seat were then plotted against the roughnesses of each surface and fitted with a linear trend line. The results are shown in Table 13. The wheel size with the highest R-squared value for the linear trend line is a 2.5 inch diameter wheel which means that the roughness calculated with that wheel size most accurately predicted the seat RMS vibration values. After we found this to be the best wheel size, we went back and adjusted all of the data presented in this report using a 2.5 in. diameter wheel size.
Table 13: R2 values for wheel sizes

[Click image above to view HTML version]
Developing this standard will likely not be met with universal praise. There will be historical societies that won’t want to replace bricks or other rough surfaces that have been the surface for hundreds of years (Boston, MA would be an example). Construction companies and anyone else who would have to comply with the standard may not like the extra work or the extra oversight. Cities, townships, and anyone else owning sidewalks may not like the restrictions that the standard will put on the type of surface that they can install. On the other side of the argument, there may be WC and accessibility advocacy groups that feel that the standard does not go far enough and should be more restrictive.
It could also be argued that the responsibility to limit harmful vibrations should be placed on the WC manufacturers. Many WCs, especially power WCs, have suspensions for this reason. However, WCs need to provide postural support and stability which makes it difficult to design them to reduce high amounts of vibrations. The way to reduce these vibrations should be by adapting the WCs and the environment to best fit the needs of those who use WCs. In fact, the standard could help WC manufactures better design WCs to filter out vibrations if they know the magnitude of vibrations that WCs are subjected to.
Limitations
Vibrations that WC users feel and perceive can be affected by a number of factors including the speed they travel, wheel type, wheel size, wheel base, suspension type, cushion type, etc. We try to address these issues by having the subjects use their own WCs so that they are used to its characteristics. The speed of 1 m/s was chosen for our study because it is an average traveling speed for WC users. The vibrations could be limited by having the WC users travel at a slower speed, but it is not desirable to limit WC users from traveling around their community by making it so that they have to travel at slow speeds to be safe and comfortable.
One limitation associated with this study is the use of wood to construct the engineered surfaces. Other than various wood decks, many commonly traveled surfaces are constructed from other materials such as concrete, brick, or tile. Not only is wood infrequent, but it also is easily warped and worn. Variations from the original wood plank may have occurred over time, causing different vibrations and affecting the quantitative data.
Visual bias is another limitation of the study. Although surface randomization was performed, the subjects were still able to see the surface on which they were traveling. Each group of wood planks was noticeably different from others. Subjects may have attempted to answer the questionnaire based on the visual appearance of what they saw they were traveling over rather than the vibrations that they felt. This may have had an effect on the qualitative data.
Future Work
There is ongoing research, development, and validation to design an apparatus capable of measuring surface roughness of sidewalks. The devices that are on the market to measure roadway roughness are not applicable to sidewalk and pedestrian surfaces because they either use accelerometers to measure the surface profile, which requires a higher speed than can be utilized for pedestrian surfaces, or they cannot measure at a resolution great enough to catch surface characteristics that can effect WC users (approximately 1 mm). The Pathway Measuring Tool (PathMeT) we have developed is capable of measuring the profile of the surface to a resolution of smaller than 1 mm. It will collect data while being pushed over the surface at a walking speed (approximately 1 m/s). It will also be able to determine other surface characteristics such as cross-slope, running slope, and instantaneous height changes which have limits already established in the ADAAG. It will also take pictures and record GPS data so that it can be stored in a database and be viewed on a system such as Google maps.
There could also be a study conducted where WC users around the country have accelerometers and GPS on their personal chairs (such as a smartphone) so that the vibrations they experience could be used to predict sidewalk roughness. If many WC users have high vibrations while traveling over the same sidewalk, then the sidewalk could be flagged as needing to be examined further.
All of the measured indices were based on the wheelpath algorithm explained earlier. However, the results of the vibration data showed that large gaps cause larger increases in RMS vibrations than increased frequency. Therefore, the wheelpath algorithm might need to be altered to better evaluate a surface. This could be done by adding algorithms that measures gap length and creates a factor that can be multiplied by the original wheelpath index. There could also be an algorithm created that would evaluate the surfaces based on PSD or WT so that the larger wavelengths of the surface deviations can be considered.
Another valuable tool that could be created would be an equation based on surface characteristics that would be able to predict user responses similar to the PSI equation discussed in the introduction. If an equation could be created based on surface characteristics and could accurately predict subjective user feedback, it would minimize the need for future subject testing and could be applied to a variety of surfaces that have not been tested by subjects.
User Comments/Questions
Add Comment/Question