Development of Surface Roughness Standards for Pathways Used by Wheelchair Users: Final Report
Manual vs. Power (RMS Values)
Figure 18 shows the seat RMS values with manual and power WCs separated for all of the surfaces. The different slopes of the linear trend lines show that manual WCs will have a greater increase in vibrations for a particular increase in surface roughness than power WCs. The R2 values suggest that the data for both types of WCs the data is fairly linear.
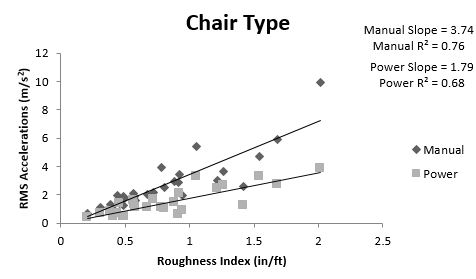
Figure 18: Seat RMS of Manual vs. Power wheelchair
The last section demonstrated that the vibration data for the engineered surfaces are much more consistent than the outside surfaces. Figure 19 displays the same axes as Figure 18 but with the engineered data only. The R2 values become much higher. The manual WC trend line still has a larger slope and overall the RMS values for manual WCs are higher than power WCs. The vibration data for the roughest three surfaces show that there might be some other surface characteristic besides roughness that is contributing to the data. The vibration data from surface 8 is lower than surface 7 (especially for manual WCs) even though surface 8 is rougher according to the roughness index. The characteristics of the surfaces show that surface 8 has smaller gaps than surface 7 (1.25 inches compared to 1.55 inches), but they occur at a higher frequency (every 4 inches compared to every 8 inches). This could indicate that the size of gaps in surfaces may be more important than the frequency of the gaps. Wolf et al found a similar result in their study when they found that a brick surface with small but highly frequent bevels resulted in lower vibrations than a concrete surface that had larger gaps at large intervals (4’) between the slabs. (Wolf, 2007)
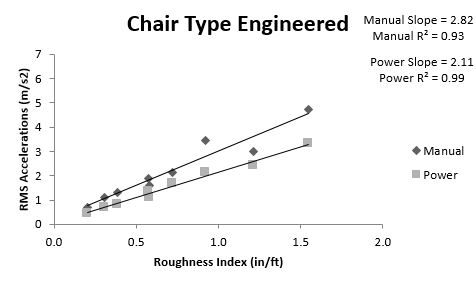
Figure 19: Seat RMS of Manual vs. Power Wheelchair Engineered
As shown in Table 5, the standard deviations of the RMS values for the engineered surfaces are roughly half the average indicating that there is large variability of data. For this reason, the majority of the data presented in this paper are presented as means without error or confidence levels. However, Figure 20 does show the average seat RMS data for all of the surfaces with 95 percent confidence bars.
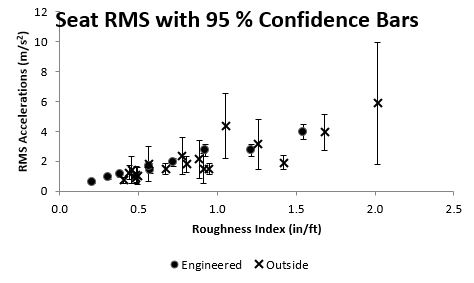
Figure 20: Seat RMS values with 95 percent confidence bars
User Comments/Questions
Add Comment/Question