Hello. Please sign in!

Development of Surface Roughness Standards for Pathways Used by Wheelchair Users: Final Report

Manual vs. Power (Questionnaire Data)

Figures 24 and 25 show the results of the questionnaire data separated by manual and power WCs. It should be noted that even though manual WC users had higher vibrations for all engineered surfaces, on average they rated all surfaces better than power chair users.

This figure shows the linear regression of percent of subjects that said the surface was acceptable split between chair type for engineered surfaces. Surface roughness is on the x-axis and percent acceptable is on the y-axis. Both trendlines go from the top left to the bottom right. The Manual chairs have an r-squared value of .93 while the power chairs have an r-squared value of .99. The slopes of the manual chairs and power chair lines are -37.40 and -49.32 respectively.

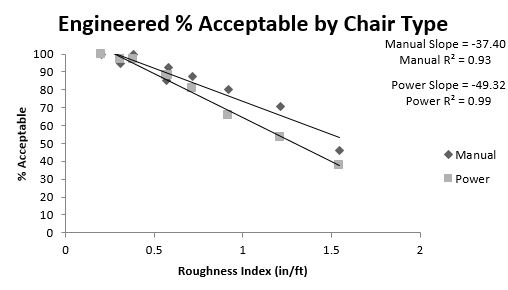
Figure 24: Percent Acceptable Manual vs. Power Wheelchair Engineered

This figure shows the linear regression of average rating of the engineered surfaces split between chair types. Surface roughness is on the x-axis and average rating is on the y-axis. Both trendlines go from the top left to the bottom right. The manual chairs have an r-squared value of .92 while the power chairs have an r-squared value of .95. The slopes of the manual and power chair lines are -1.68 and -1.81 respectively.

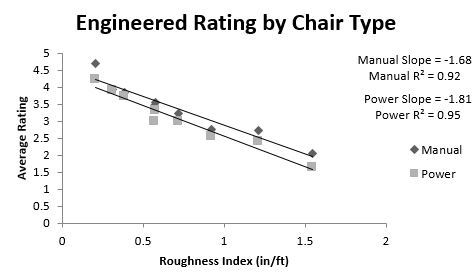
Figure 25: Rating Manual vs. Power Wheelchair Engineered

[MORE INFO...]

*You must sign in to view [MORE INFO...]