Development of Surface Roughness Standards for Pathways Used by Wheelchair Users: Final Report
Engineered vs. Outside (Questionnaire Results)
Tables 8 and 9 and Figures 22 and 23 show the questionnaire results broken down by engineered and outdoor surfaces. The slopes of the linear trend lines for the engineered and outside surfaces are similar for both the Percent Acceptable and Rating data. However, just like with the RMS acceleration data, there is much more variability in the outside data than the engineered data as shown by the R2 values in both graphs.
Table 8: Engineered Questionnaire Results
|
Roughness |
% Acceptable |
Mean |
N |
Std. Deviation |
|
0.205 |
100.00% |
4.48 |
75 |
0.75 |
|
0.309 |
95.90% |
3.92 |
74 |
0.91 |
|
0.383 |
98.60% |
3.79 |
75 |
0.98 |
|
0.572 |
86.50% |
3.24 |
75 |
1.04 |
|
0.578 |
90.40% |
3.44 |
73 |
1.1 |
|
0.718 |
84.50% |
3.13 |
72 |
1.16 |
|
0.921 |
71.90% |
2.64 |
58 |
1.12 |
|
1.213 |
63.00% |
2.58 |
73 |
1.35 |
|
1.545 |
41.40% |
1.82 |
58 |
1.12 |
Table 9: Outdoor Questionnaire Results
|
Roughness |
% Acceptable |
Mean |
N |
Std. Deviation |
|
0.405 |
100.00% |
3.9 |
15 |
0.78 |
|
0.441 |
100.00% |
4.32 |
11 |
0.68 |
|
0.457 |
100.00% |
4.33 |
9 |
0.56 |
|
0.485 |
100.00% |
4.09 |
11 |
0.63 |
|
0.486 |
100.00% |
4.17 |
15 |
0.72 |
|
0.494 |
100.00% |
4.64 |
11 |
0.45 |
|
0.565 |
87.50% |
4.06 |
8 |
0.56 |
|
0.673 |
60.00% |
2.23 |
15 |
1.24 |
|
0.778 |
100.00% |
3.09 |
11 |
0.77 |
|
0.804 |
100.00% |
3.13 |
15 |
0.97 |
|
0.885 |
85.70% |
2.86 |
8 |
0.75 |
|
0.914 |
90.90% |
4.05 |
11 |
0.76 |
|
0.947 |
100.00% |
3.53 |
15 |
0.97 |
|
1.053 |
25.00% |
2.13 |
8 |
0.83 |
|
1.26 |
77.80% |
2.94 |
9 |
1.07 |
|
1.421 |
20.00% |
1.43 |
15 |
0.82 |
|
1.68 |
27.30% |
1.32 |
11 |
0.98 |
|
2.017 |
12.50% |
1.19 |
8 |
1.1 |
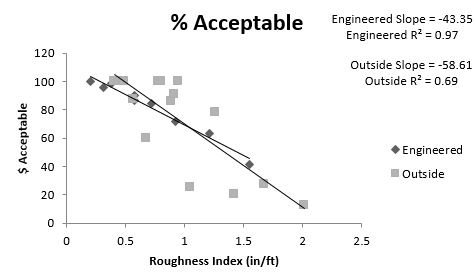
Figure 22: Percent Acceptable Engineered vs. Outside
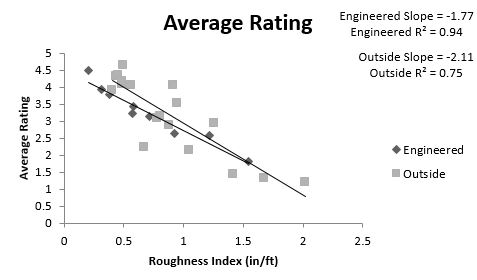
Figure 23: Average Rating Engineered vs. Outside
User Comments/Questions
Add Comment/Question