Development of Surface Roughness Standards for Pathways Used by Wheelchair Users: Final Report
Roughness Calculation
Using the IRI as a model, the roughness index was found by summing the vertical deviations of the surface profile for a given horizontal distance. It was noted however that the wheel and crack size had significant influences on how a chair would react to the surface. If the crack depth was deep enough, the wheel would be suspended by the two sides of the surface and never hit the bottom as shown in Figure 122 {sic}. Therefore, if the depth of the cracks were doubled, the chair would have the exact same reaction to the surface. The diameter and flexibility of the wheel also will determine how far down into the gap the wheel will travel. For example, a 26in diameter hard rubber tire that may be on the rear axle of the WC will not drop into a crack as far as a 2.5in diameter wheel that may be on the front of a manual WC. Because of the multitude of tires available for WCs, it was decided to choose a "standard wheel" for the analysis. The one selected for analysis was considered the worst case tire; a 2.5 in diameter hard rubber wheel (which is often used as a front caster for manual WCs).
The laser data were filtered using a 3-point moving average filter to minimize the vertical deviations caused by the noise of the laser. A "wheelpath" algorithm was then run to determine how the "standard wheel" would travel over each surface profile. The Pathway Roughness Index was calculated by summing the vertical deviations of the wheelpath data. (Figure 133) {sic}
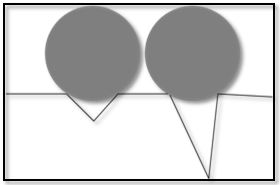
Figure 12: Schematic of Crack Depth
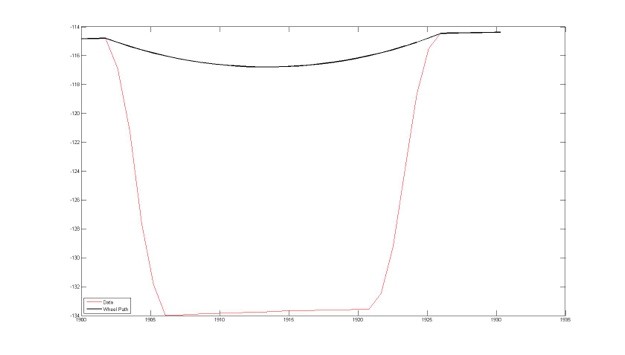
Figure 13: Picture of Wheelpath algorithm bridging a gap
The accelerations collected at the seat frame, footplates, and backrest were converted to RMS accelerations and VDV values.
Table 5 presents the average RMS accelerations and Table 6 presents the VDV values for each surface. As described earlier, ISO 2631-1 recommends using VDV instead of RMS when there are infrequent high magnitude shocks and the crest factor is greater than 9. Another way they suggest to determine which value to use is to use VDV if the following proportion is exceeded.
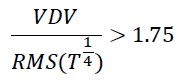
In our data analysis, this proportion was only reached at the seat accelerometer for two outside surfaces, which were both made of large concrete slabs. Because the ratio was less than 1.75 for all other surfaces, the rest of the data will only be presented as RMS accelerations.
Table 5: Average RMS Values

[Click image above to view HTML version]
Table 6: Average VDV Values

[Click image above to view HTML version]
Figure 14 is the graphical representation of the total RMS data for all surfaces based on roughness. The slopes of the linear trend lines show that as surface roughness increased, average RMS accelerations consequently increased. The slopes for the seat and footrest are similar while the slope for backrest is only about half that of the footrest. The R2 values show that the data fits the linear trend line fairly well.
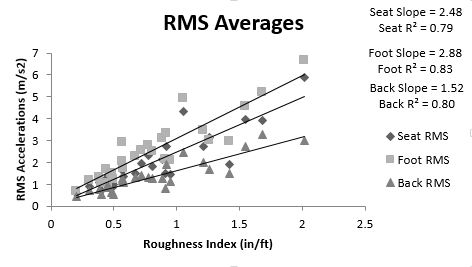
Figure 14: Total RMS Averages across all surfaces
User Comments/Questions
Add Comment/Question