Development of Surface Roughness Standards for Pathways Used by Wheelchair Users: Final Report
2. Methodology
Literature Review
The literature review focused on two topics. The first review of the literature focused on the effects of surface roughness on the health and safety of WC riders. The second topic was to explore ways to measure, design, and monitor the quality of pathway surfaces for WC users. Therefore two separate searches were conducted. A literature review was completed using searches on PubMed and Google Scholar in October of 2010, and more recently in November of 2011 to identify any new articles. For the search on WC vibrations, both databases were searched for titles that had the word wheelchair and any of the following: vibration, shock, surface, roughness, firmness, sidewalk, or pathway. The second search was conducted by searching titles for the word roughness and any of the following: road, roadway, measurement, profile, or profiling. This search was only conducted on Google Scholar and was limited to the fields of engineering, computer science, and mathematics. We performed a systematic review of the relevant literature. Relevance was determined first by reviewing abstracts, and then reviewing entire articles. First, abstracts of all of the papers identified through the keyword searches were compiled into a single document, and each was reviewed. If the abstract suggested the manuscript was relevant to the topic, the entire manuscript was then reviewed. Only manuscripts that were deemed irrelevant were then discarded, and the remaining manuscripts were included in this review.
Subject testing
A study was designed to investigate a correlation between surface roughness and WBV exposure to WC users in an attempt to determine which surfaces should be considered acceptable. The study also investigated a correlation between surface roughness and subjective feedback from WC users. Both manual and power WC users were included in the study so that the results would not benefit or harm either group.
Prior to starting the study; subjects consented to participate in the IRB-approved study. The inclusion criteria were that the subject must use a manual or power WC as their primary means of mobility (greater than 50% of the day), propel their WC independently without their feet touching the ground, speak English, report that they are free from active pressure sores, and that they do not use a pacemaker. After being consented, subjects completed a baseline questionnaire that included demographics, WC type, and types of sidewalks on which they typically travel, among other variables (Questions are shown in Appendix A). Tri-axial accelerometers were attached at the backrest, seat frame and footplates to record vibrations (Figure 2). After completing the questionnaire subjects were asked to drive their WC over a series of various outdoor surfaces as well as a 16 ft indoor test platform, which had a series of wood slats that could be changed to vary the roughness from almost perfectly smooth to very rough. The order of engineered surfaces was varied in a random order for each subject to reduce any sequence bias that may occur. A trial was considered acceptable if the time for the trial was between 4.390 and 5.366 seconds which is a rate of 1m/s (+/- 10%), an average velocity for WC users and a velocity that has been used for past studies. (Cooper, 2004) After a subject traveled over a surface three acceptable times, with a maximum of five attempts, they were asked to provide a subjective rating of the surface.
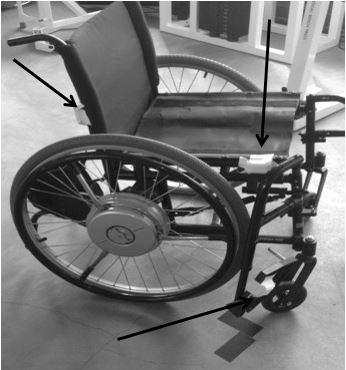
Figure 2: Picture of Wheelchair with Accelerometers
Engineered Surfaces
The engineered surfaces consisted of a 16ft x 4ft runway with a 4ft x 4ft flat platform on each end. (Figure 3) The 16ft test area was constructed with two rows of 48 pieces of 3/4in poplar hardwood separated at 4in intervals. The board configurations resulted in gaps of 0in, 0.8in, 1.25in, 1.55in and 2.00in. These gaps were chosen so that there was a large range of surfaces that would result in vibrations and questionnaire results that would span the range necessary for the study. The surface configurations are described in Table 3. The roughness index is a measurement how much vertical deviation a standard wheel will experience as it travels over these surfaces and will be explained in more detail later on.
Table 3: Engineered Surface Identification
|
Surface ID: |
Roughness Index (in/ft): |
Crack Frequency (in): |
Crack Width (in): |
|
1 |
0.2052 |
No cracks |
0 |
|
2 |
0.3087 |
12 |
0.80 |
|
3 |
0.3827 |
8 |
0.80 |
|
4 |
0.5717 |
12 |
1.25 |
|
5 |
0.5783 |
4 |
0.80 |
|
6 |
0.7184 |
8 |
1.25 |
|
7 |
0.9211 |
8 |
1.55 |
|
8 |
1.2132 |
4 |
1.25 |
|
9 |
1.5449 |
8 |
2.00 |
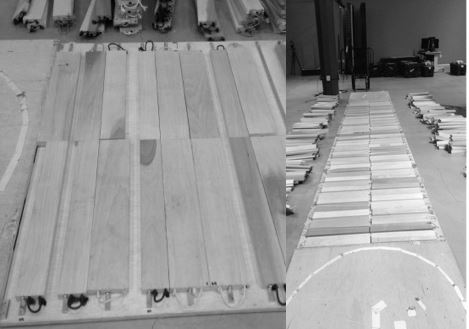
Figure 3: Pictures of wooden surfaces
Outside Surfaces
Subsets of the subjects also traveled over outdoor surfaces around the area at which they were tested with the accelerometers attached to their chairs and rated those surfaces. A total of twelve outside surfaces were tested which included a variety of brick, concrete, and asphalt surfaces. Pictures of these surfaces are available in Appendix B.
Questionnaire
A full version of the questionnaire given to the subjects after traveling over each surface can be found in Appendix C. The questionnaire was developed by the study investigators. The first question, shown in Figure 4, was based on ASTM 1927-28: Standard Guide for Conducting Subjective Pavement Ride Quality Ratings. This standard, which will be described later, is used to conduct subjective ratings of roadways so it was used in the same manner to conduct subjective ratings of our engineered and outdoor surfaces.
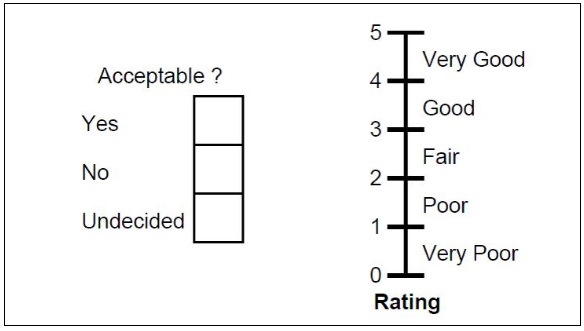
Figure 4: Present Serviceability Rating Form
Data acquisition
The accelerometers used for subjects 1-28 were ADXL 335Z wired tri-axle accelerometers and data was collected using National Instruments Signal Express software. The data were collected from all three orthogonal directions at 100 Hz. The rest of the subjects had shimmer 2R wireless accelerometers attached to their chairs. This data were collected via Bluetooth and a Matlab program. (The MathWorks Inc, Natick, Massachusetts) These data were collected at a preset frequency of 102.4 Hz. These accelerations were then analyzed using the RMS method described in ISO 2631-1. The ISO standard states to collect measurements in the direction with the highest vibrations. The vertical z-axis was chosen because it is parallel to the spine and lower legs of the subject, both of which are high-risk areas for negative health outcomes. Frequency ratings were also applied to the data based on the ISO standard. The RMS is calculated using the following equation:
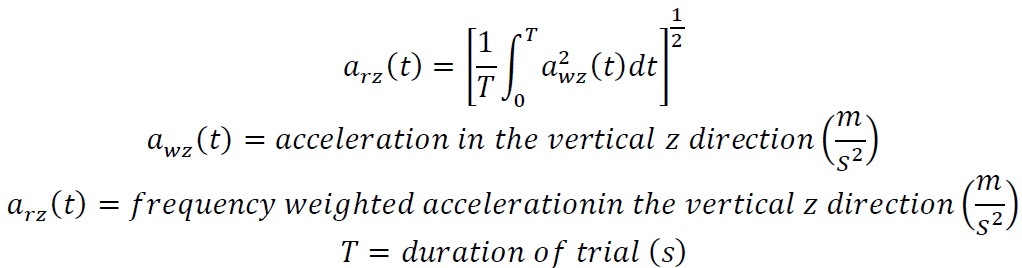
Equation 1: Root Mean Square
If the vibration data has infrequent high magnitude shocks, ISO 2631-1 recommends that the Vibration Dose Value is a better way to quantify the vibrations. VDV should be used if the crest factor is greater than 9, where the crest factor is defined as the modulus of the ratio of the maximum instantaneous peak value of the frequency-weighted acceleration signal to its RMS value. VDV is calculated using the following equation:
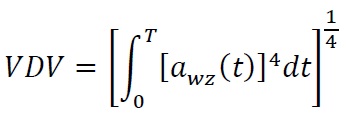
Equation 2: Vibration Dose Value
Roughness Measurement
The surface profiles were measured with a custom-built pathway measurement tool (PathMeT), which was created from a power WC frame that was instrumented with a wheel encoder and an Acuity AR700 distance measurement laser. Because brick pavers are typically laid with 3-5 mm between them and a limitation to a study conducted by Yamanaka was that the profilograph they used did not have a high enough resolution, we wanted our measurements to be recorded with a spacing or about 1 mm. (Yamanaka, 2006) The recording frequency of the laser and encoder were not set, but were recorded at approximately 1200 Hz, which resulted in an accuracy of less than 1mm when it was traveling at 1m/s. PathMeT was driven over the surfaces on two flat boards to eliminate the error caused by the tires falling into the cracks. (Figure 5)
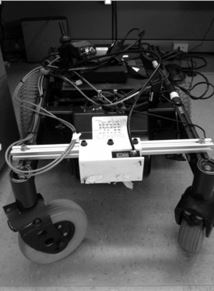
Figure 5: Picture of Original PathMeT
User Comments/Questions
Add Comment/Question