Independent Wheelchair Transfers in the Built Environment: How Transfer Setup Impacts Performance Phase 2: Final Report
Results
Participants
A total of 73 participants were enrolled consisting of 56 men and 17 women, with an average age of 45 ± 15 years, body weight of 176 ± 53 lbs and a height of 67±6 in. Women constituted 23% of the study population. Further demographic details of the study can be seen in Table 3, including hours using a wheelchair per day, years using a wheelchair, number of level and non-level transfers and average wheelchair seat height.
Table 3. Detailed Demographics of the study participants
|
|
Average (Std) |
Median |
Min |
Max |
|
Age (years) |
45.4 (15.0) |
50 |
18 |
78 |
|
Height (in) |
67.3 (5.6) |
68 |
46 |
80 |
|
Weight (lbs) |
175.7 (53.2) |
172 |
49 |
300 |
|
Hours using wheelchair (per day) |
11.9 (4.5) |
13 |
2 |
18 |
|
Years using wheelchair |
12.4 (9.1) |
9.9 |
1 |
38 |
|
Number of level transfers per day |
11.4 (14) |
7.8 |
0 |
100 |
|
Number of non-level transfer per day |
8.2 (14.2) |
4 |
0 |
100 |
|
Seat Height (in) |
22.1 (1.4) |
22.0 |
19.0 |
27.5 |
Detailed Age Demographics
Th [sic] histogram of ages shows a slight skew to the right (Figure 4), indicating that more individuals in the 45-64 age range were tested compared to adults who were in the 25-45 age range. Table 4 shows the number of participants in each age category and the percentage of the total study sample that each age group makes up.
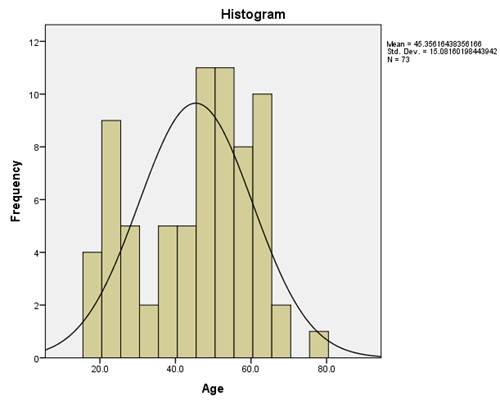
Figure 4. Histogram of age distribution for the study participants
Table 4. Percentage of Participants in each age range category
Age Bin |
Percent |
|
18-24 |
14 |
|
25-34 |
14 |
|
35-44 |
12 |
|
45-54 |
30 |
|
55-64 |
25 |
|
65-74 |
4 |
|
75-84 |
1 |
Self-Reported Disability Types Demographics
A wide variety of disabilities were reported in the study. A detailed list of the self-reported disabilities can be seen in Table 5 as well as the number of participants with each type of disability and what percentage of the sample they make up.
Table 5. Participants type of self-reported disability for the study population
| Disability |
Number of Participants |
|
Spinal cord injury |
35 (48%) |
|
Multiple sclerosis |
5 (7%) |
|
Cerebral Palsy |
2 (3%) |
|
Lower extremity amputation |
3 (4%) |
|
Spinal bifida |
8 (11%) |
|
Multiple sclerosis and spinal cord injury |
4 (6%) |
|
Osteogenesis imperfect |
2 (3%) |
|
Muscular Dystrophy |
1 (1.27%) |
|
Rheumatoid arthritis |
1 (1.27%) |
|
Traumatic brain injury |
3 (4%) |
|
Stroke |
1 (1.27%) |
|
Ambulatory Dysfunction |
1 (1.27%) |
|
Double lower extremity amputation and stroke |
1 (1.27%) |
|
Adreno/Eukodystrophy |
1 (1.27%) |
|
Cardiac complications |
1 (1.27%) |
|
Guillian-Barre Syndrome (GBS) |
1 (1.27%) |
|
Side effects of liver disease |
1 (1.27%) |
|
Thrombocytopenia with absent radius (TAR Syndrome) |
1 (1.27%) |
|
SCI + Amputee |
1 (1.27%) |
Mobility Use Demographics
There were 46 manual wheelchairs users, 20 power wheelchair users, 3 scooter users and 4 manual power assist users enrolled in the study. The percentages of the total for each type of mobility device can be seen in Figure 5.
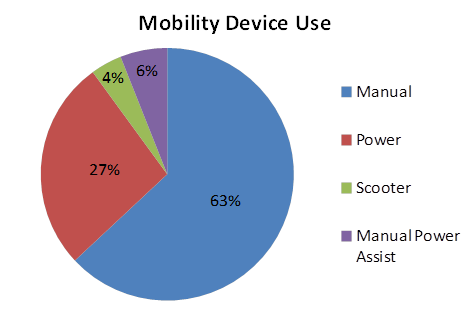
Figure 5. Wheeled mobility devices used by study participants
Tables 6 and 7 show the breakdown of men and women and mobility type by self-reported disability for the study participants respectively.
Table 6. Number of participants by self-reported disability type and WMD type for males study participants
|
|
Male Participants |
|||
|
Disability |
Manual WC |
Power WC |
Scooter |
MPA |
|
Spinal Cord Injury |
22 (30%) |
5 (7%) |
1(1.5%) |
1 (1.5%) |
|
CP |
0 (0%) |
0 (0%) |
1 (1.5%) |
0 (0%) |
|
MS |
2 (3%) |
1 (1.5%) |
0 (0%) |
0 (0%) |
|
Amputee |
8 (11%) |
1 (1.5%) |
0 (0%) |
0 (0%) |
|
Spina Bifida |
3 (4%) |
1 (1.5%) |
0 (0%) |
0 (0%) |
|
Other |
4 (5%) |
4 (5.5%) |
0 (0%) |
2 (3%) |
|
Total |
39 (53%) |
12 (16%) |
2 (3%) |
3 (4%) |
Table 7. Number of participants by self-reported disability type and WMD type for female study participants
|
|
Female Participants |
|||
|
Disability |
Manual WC |
Power WC |
Scooter |
MPA |
|
Spinal Cord Injury |
6 (8%) |
1 (1.5%) |
0 (0%) |
1 (1.5%) |
|
CP |
0 (0%) |
2 (3%) |
0 (0%) |
0 (0%) |
|
MS |
0 (0%) |
2 (3%) |
0 (0%) |
0 (0%) |
|
Amputee |
0 (0%) |
0 (0%) |
0 (0%) |
0 (0%) |
|
Spina Bifida |
0 (0%) |
0 (0%) |
0 (0%) |
0 (0%) |
|
Other |
1 (1.5%) |
3 (4%) |
1 (1.5%) |
0 (0%) |
|
Total |
7 (9.5%) |
8 (11.5%) |
1 (1.5%) |
1 (1.5%) |
Transfer Protocols
In total 73 participants were enrolled the study. One participant was withdrawn because he self-reported being able to independently transfer meeting inclusion criteria but when he came in to do the study he was unable to transfer to any surface independently including a standard therapy mat table which was in the testing room. He was a bilateral amputee that used a power wheelchair. He was 57 years old with a height and weight of 73 inches and 285 lbs respectively.
The remaining 72 participants completed all or part of the study protocols as shown in Figure 6. The primary reason why some participants did not complete all study protocols was due to an onset of pain or fatigue experienced part way through the study.
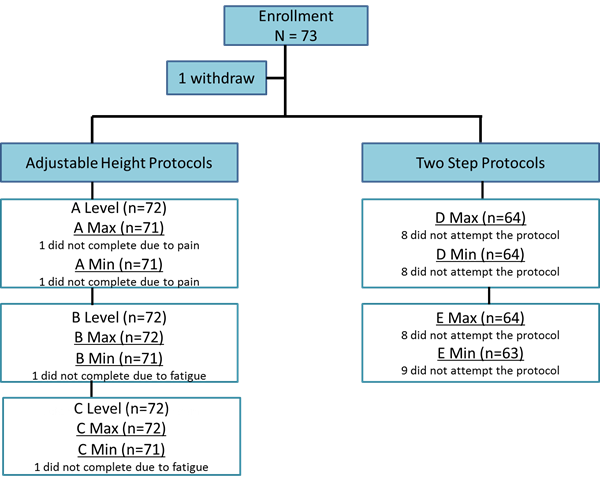
Figure 6. Flow chart of the number of participants that did not complete each protocol (Protocols A, B and C) and participants that did not attempt the two step protocols (Protocols D and E)
Protocol A
Level Transfer: All 72 study participants completed the level transfer in this protocol.
Maximum and Minimum Height Transfers: One the 72 study participants (P1) developed hip pain and did not attempt these two transfers. He was a 52 year old amputee with a weight and height of 220 lbs and 62 inches respectively, who used a manual wheelchair. His data were not included in the result tables. Two participants (P2 and P3) did not attempt to transfer higher or lower than their mobility seat for different reasons. Participant P2 was a 64 year old female with Multiple Sclerosis and used a power chair. Her weight and height were 210 lbs and 66 inches respectively and she lacked the ability to transfer to surfaces that were not at the same level as her wheelchair seat to floor height. Participant P3, was unable to transfer higher or lower than her mobility device seat without the presence of grab bars on the platform. She was a 46 year old female with Multiple Sclerosis that also used a power chair. Her height and weight were 69 inches and 154 lbs respectively. These two participants were included in the results tables with their level seat height being recorded as their maximum and lowest height transfer for this protocol.
Protocol B
Level Transfer: All 72 study participants completed the level transfer in this protocol.
Maximum Height Transfer: Of the 72 participants, participant (P2) did not attempt to transfer higher than her mobility device seat because she lacked the ability. Like protocol A her level height was recorded as her maximum height for this protocol.
Minimum Height Transfer: Of the 72 participants, P4, developed fatigue and was unable to attempt this transfer. He was a 70 year old male with a spinal cord injury who uses a manual wheelchair. His weight and height were 157 lbs and 68 inches respectively. Participant (P2) did not attempt to transfer lower because she lacked the ability. Her data were included in the results and level seat height was recorded as her minimum transfer height.
Protocol C
Level Transfer: All 72 participants completed the level transfer in this protocol.
Maximum Height Transfer: Of the 72 participants, one participant (P2) again did not attempt this transfer because she was unable to transfer higher than her mobility device seat. Like the other protocols her level transfer height was used as the maximum transfer height in the results.
Minimum Height Transfer: Of the 72 participants, one participant (P4) had developed fatigue and was unable to attempt this transfer. His data was not included in the analysis. Participant (P2) did not attempt the transfer because she was unable to transfer lower than her mobility device seat. Like the other protocols her level height was used as the minimum height in the analysis. Participant P3, attempted the transfer but was not successful at completing it (e.g. failed attempt). Her data were included in the data analysis and her level transfer height was used as the minimum height in the analysis.
Protocols D and E
For protocols D and E there were several participants who were unable to complete the two step transfer. The demographics of these individuals are listed in Table 8. For these protocols, participants either attempted the protocol and failed or did not attempt the protocol after visual inspection. For these protocols a failed transfer, is one where the participant transfers to the first platform, but was unable to transfer to the second platform. For protocol D 11% (8/72) of the participants did not attempt it and of the 64 participants who did attempt the protocol, 5% (3/64) had a failed attempt. For protocol E transferring to a higher platform with the ramp, 11% (8/72) of the participants did not attempt the protocol and of the 64 participants who attempted the transfer 11% (7/64) had a failed attempt. When transferring to a lower platform with the ramp, 13% (9/72) did not attempt the transfer and of the 63 subjects who attempted the transfer, 3.2% (2/63) had a failed attempt. Participants who did not attempt two-step transfers or had failed transfers were not included in the results tables for these types of transfers.
Table 8. Characteristics of participants who did not attempt a transfer or had a failed transfer during the two-step transfer protocols D and E.
|
Partic-ipant ID |
aDiag-nosis |
Sex |
Age (yrs) |
Weight (lbs) |
Height (in) |
Failed Transfer Attempts |
Transfers Not Attempted |
WCb Type |
|
P2 |
MS |
F |
64 |
210 |
66 |
None |
D1,D1 |
P |
|
P3 |
MS |
F |
46 |
154 |
69 |
None |
D1,D2 |
P |
|
P5 |
SCI (C4-C5) |
M |
49 |
275.0 |
71.0 |
E1 |
---- |
P |
|
P6 |
Stroke, Edema, COPD |
M |
57 |
280.0 |
70.0 |
D1, E1 |
---- |
P |
|
P7 |
CP |
F |
45 |
110 |
59.0 |
E1 |
E2 |
P |
|
P8 |
MS |
M |
56 |
210 |
70.9 |
D1, D2 |
E1, E2 |
P |
|
P9 |
SCI |
M |
31 |
210 |
78.7 |
E2 |
E1 |
M |
|
P10 |
MD |
M |
50 |
89.9 |
66.9 |
E1 |
---- |
M |
|
P11 |
Limited Mobility |
M |
63 |
300 |
76 |
None |
D1,D2 |
M |
|
P12 |
TBI |
F |
48 |
164 |
68 |
None |
D1,D2 |
P |
|
P13 |
SCI,MS |
F |
55 |
88 |
62 |
E1,E2 |
D1,D2 |
M |
|
P14 |
SCI |
M |
56 |
135 |
67 |
E1 |
---- |
P |
|
P15 |
Guillian-Barre Syndrome |
M |
78 |
155 |
71 |
None |
D1,D2 |
MPA |
|
P16 |
SCI, Amputee |
F |
50 |
276 |
65 |
None |
D1,D2 |
P |
|
P17 |
SCI |
F |
64 |
172 |
59.5 |
None |
D1,D1 |
P |
|
P18 |
SCI |
M |
63 |
180 |
74 |
D1,D2 |
E2 |
MPA |
Note. D1 = Protocol D transfer level to increment higher, D2 = Protocol D transfer level to increment lower, E1 = Protocol E transfer level to increment higher, E2 = Protocol E transfer level to increment lower. aDiagnosis acronyms = SCI (Spinal cord injury), COPD (and Chronic obstructive pulmonary disease), CP (Cerebral palsy), MS (Multiple Sclerosis ), MD (Muscular Dystrophy). bWC Type = Wheelchair Type used, P (power wheelchair), M (manual wheelchair).
Highest and Lowest Heights Obtained
Table 9 shows the 5th, 25th, 50th, 75th, and 95th percentiles for protocols A through C. These data represent the ability of the participants in the study to complete a transfer. The 5th percentile lowest and highest transfers attained were similar to the average WMD seat height (22.1 inch) for all protocols. The 50th percentile participants were able to transfer to a simple platform (no grab bars or a backrest present) that was 28 inches high with respect to the floor and 14 inches low relative to the floor (about 6 inches above and below average wheelchair seat to floor height). For all of the minimum height transfers, the 75th and 95th percentiles were at the minimum transfer height possible with the station (10 inches). For protocols A and B one person could transfer to the maximum height of the station (43 inches) and was an outlier in the study. The relative height differences for the high and low transfers can be seen in Addendum F.
Table 9. Maximum attainable height variable percentiles (in inches)
|
|
Percentiles |
|
||||
|
Protocol |
5th |
25th |
50th |
75th |
95th |
End Range |
|
A. Adjustable Height |
||||||
|
Maximum Height (n=71) |
22.8 |
26.0 |
28.0 |
31.0 |
35.0 |
43.0 |
|
Minimum Height (n=71) |
22.2 |
19.5 |
14.0 |
10.0 |
10.0 |
10.0 |
|
B: Adjustable Height |
||||||
|
Maximum Height (n=72) |
23.0 |
26.6 |
29.0 |
31.9 |
38.0 |
43.0 |
|
Minimum Height (n=71) |
22.1 |
17.5 |
12.5 |
10.0 |
10.0 |
10.0 |
|
C. Adjustable Height |
||||||
|
Maximum Height (n=72) |
23.0 |
26.5 |
28.9 |
32.4 |
34.7 |
35.0 |
|
Minimum Height (n=71) |
21.9 |
17.5 |
12.3 |
10.0 |
10.0 |
10.0 |
Two Step Transfers Attainable Heights
Among the participants that were able to complete the two step transfers, the 5th percentile were able to transfer to a second platform that was 3 inches higher than the first platform for the adjacent transfer and 2 inches higher for the ramp transfer. The 5th percentile of participants could transfer to a platform that was 2 inches lower than the first platform for both the adjacent and the ramp transfers. The 95th percentile could transfer to a second platform that was 8 inches higher and lower than the first platform for both the adjacent and ramp transfers.
Table 10. Maximum attainable height difference in two step transfer percentiles (in inches)
|
|
Percentiles |
||||
|
Protocol |
5th |
25th |
50th |
75th |
95th |
|
D. Adjacent Two Step Transfer |
|||||
|
Platform above (n=64) |
3.0 |
4.0 |
7.0 |
8.0 |
8.0 |
|
Platform below (n=64) |
2.0 |
5.0 |
7.0 |
8.0 |
8.0 |
|
E. Ramped Two Step Transfer |
|||||
|
Platform above (n=64) |
2.0 |
5.0 |
7.0 |
7.0 |
8.0 |
|
Platform below (n=63) |
2.0 |
5.0 |
7.0 |
7.0 |
8.0 |
Questionnaire on Two Step Transfers
All subjects completed a questionnaire to describe their impressions about performing the two step transfers or to explain the reasons why they did not attempt these transfers. Of the 10 participants in total that did not attempt protocol D or E, all but one (90%) said they would avoid these transfers in the real world with the one participant answering NA. There were 9 participants in total who had a failed attempt on any of the transfers in protocols D and E. A majority of these 9 participants 89% (8/9) said they would avoid the two step transfers if they were encountered in the real world, while one person said that they would attempt these transfers in the real world. Of the 56 participants who completed both two-step protocols successfully 73% (41/56) said they would complete these transfers again if they encountered them in the community. Additionally, 21% of study participants (12/56) said they would avoid them and 5% (3/56) answered NA. Addendum C lists some of the participant’s responses for either willing to transfer or wanting to avoid the two-step transfers they performed.
Space Needs
Figure 7 was composed to provide a general idea of the variability observed among participants in 1) the amount of space in front of the platform required by each participant and their WMDs and 2) the physical locations of these spaces relative to the first platform. Subjects in general required more width (distance along the x-axis) than depth (distance along the y-axis) when performing transfers to this platform. Also there was a tendency for more subjects to position themselves to the right of the platform, than directly in front of or to the left of the platform.
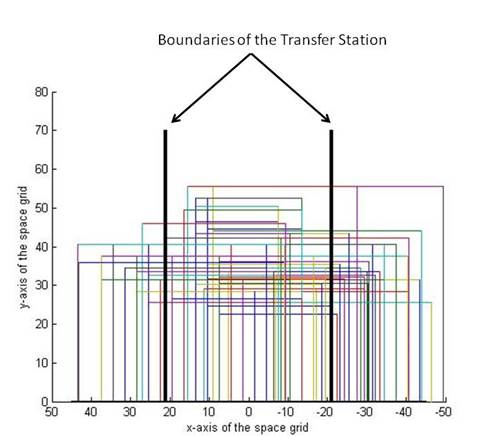
Figure 7. The black lines represent the boundaries of the transfer station which is centered around the zero point on the x-axis and expands out to 21 inches from the center of platform on either side. Each colored box in this figure represents the amount of area used by each study participant and their WMD (72 total boxes). The x-axis is the width of the grid space and the y-axis is the total depth of the grid space (see figure 1 above as a reference).
Tables 11, 12 and 13 illustrate how and what percentage of individuals in the study positioned themselves within a defined floor area centered on the transfer station. Percentages were calculated instead of percentiles due to complexity of the measures (see Data Analysis section in the Methods for further explanation). All participants were able to transfer inside a space with a depth of 55.5 inches (along the y-axis as shown in Figure 7). Table 11 shows that for a given width of 40 inches (centered in front of the transfer station) that 25% of the subjects were able to perform a transfer to the platform in Protocol A (no grab bars or backrest on the station) whereas for a given width of 100 inches (e.g. 50 inches on either side of the transfer station) 100% of subjects were able to perform a transfer to the platform during Protocol A.
Table 11. Percentage of subjects who were able to transfer within each clear floor space dimension for Protocol A transfer TO and FROM the platform at their maximum height (Max) and minimum height (Min).
| Space (inches x inches) |
A Max TO |
A Max FROM |
A Min TO |
A Min FROM |
|
40x55.5 |
25% |
25% |
21% |
21% |
|
44x55.5 |
28% |
30% |
21% |
23% |
|
48x55.5 |
36% |
37% |
27% |
28% |
|
52x55.5 |
46% |
48% |
39% |
42% |
|
56x55.5 |
50% |
51% |
42% |
45% |
|
60x55.5 |
66% |
65% |
53% |
56% |
|
64x55.5 |
73% |
72% |
62% |
62% |
|
68x55.5 |
76% |
76% |
62% |
63% |
|
72x55.5 |
82% |
82% |
76% |
77% |
|
76x55.5 |
87% |
87% |
83% |
85% |
|
80x55.5 |
87% |
87% |
86% |
88% |
|
84x55.5 |
92% |
92% |
90% |
91% |
|
88x55.5 |
97% |
97% |
94% |
94% |
|
92x55.5 |
97% |
97% |
96% |
97% |
|
96x55.5 |
99% |
99% |
97% |
99% |
|
100x55.5 |
100% |
100% |
100% |
100% |
Table 12. Percentage of subjects who were able to transfer within each clear floor space dimension for Protocol B transfer TO and FROM the platform at their maximum height (Max) and minimum height (Max)
| Space (inches x inches) |
B Max TO |
B Max FROM |
B Min TO |
B Min FROM |
|
40x55.5 |
23% |
24% |
21% |
21% |
|
44x55.5 |
23% |
27% |
21% |
21% |
|
48x55.5 |
34% |
35% |
27% |
30% |
|
52x55.5 |
48% |
46% |
39% |
42% |
|
56x55.5 |
49% |
49% |
42% |
46% |
|
60x55.5 |
65% |
66% |
53% |
53% |
|
64x55.5 |
75% |
73% |
62% |
67% |
|
68x55.5 |
76% |
77% |
62% |
70% |
|
72x55.5 |
82% |
82% |
76% |
77% |
|
76x55.5 |
87% |
87% |
83% |
83% |
|
80x55.5 |
87% |
87% |
86% |
84% |
|
84x55.5 |
91% |
92% |
90% |
90% |
|
88x55.5 |
96% |
97% |
94% |
94% |
|
92x55.5 |
96% |
97% |
96% |
96% |
|
96x55.5 |
99% |
99% |
97% |
97% |
|
100x55.5 |
100% |
100% |
100% |
100% |
Table 13. Percentage of subjects who were able to transfer within each clear floor space dimension for Protocol C transfer TO and FROM the platform at their maximum height (Max) and minimum height (Min (note: that there was one subject who positioned himself 52 inches right of center with respect to station (outlier)).
| Space (inches x inches) |
C Max TO |
C Max FROM |
C Min TO |
C Min FROM |
|
40x55.5 |
21% |
20% |
20% |
23% |
|
44x55.5 |
21% |
21% |
20% |
23% |
|
48x55.5 |
30% |
30% |
30% |
31% |
|
52x55.5 |
48% |
46% |
42% |
44% |
|
56x55.5 |
51% |
50% |
45% |
46% |
|
60x55.5 |
65% |
62% |
55% |
52% |
|
64x55.5 |
76% |
75% |
69% |
69% |
|
68x55.5 |
76% |
75% |
69% |
69% |
|
72x55.5 |
83% |
80% |
75% |
75% |
|
76x55.5 |
90% |
89% |
85% |
85% |
|
80x55.5 |
90% |
89% |
85% |
87% |
|
84x55.5 |
94% |
93% |
88% |
90% |
|
88x55.5 |
97% |
96% |
94% |
94% |
|
92x55.5 |
97% |
96% |
96% |
96% |
|
96x55.5 |
97% |
97% |
97% |
97% |
|
100x55.5 |
100% |
99% |
100% |
100% |
|
104x55.5 |
- |
100% |
- |
- |
A 60 inch wide turning space dimension similar to that found in the ADA-ABA is shown mapped onto the grid space in front of the transfer station in Figure 8. The ADA-ABA depth of 60 inches would accommodate all the subjects in this study whereas a 60 inch width would only accommodate between 52% and 66% of the subjects depending on the type of transfer (with or without grab bars and backrest) and direction of transfer (to or from the platform) (Tables 11-13).
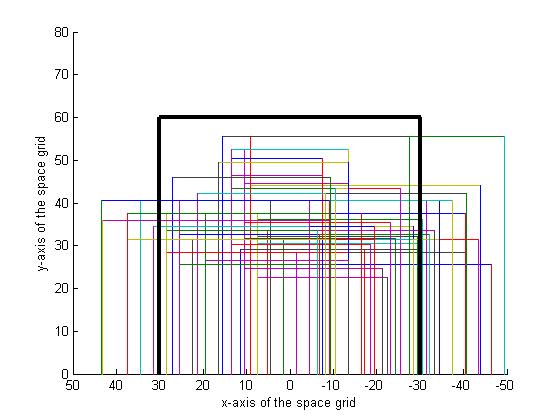
Figure 8. The black lines represent the boundaries of a standard clear floor space dimension of 60 x 60 inches. Each colored box in this figure represents the amount of area used by each study participant and their WMD (72 total boxes). The x-axis is the width of the grid space and the y-axis is the total depth of the grid space (see figure 1 above as a reference).
The angle of approach (Figure 2), the angle at which WC users were located with respect to the station, was measured and recorded for each transfer to and from the transfer station. Tables 14 and 15 shows the 5th, 25th, 50th, 75th and 95th percentiles, the maximum and minimum values for the angles of approach used when transferring to and from the transfer station
Table 14. Angle of approach transferring TO the station
|
|
Percentiles |
|
|
|||||
|
Protocol |
5th |
25th |
50th |
75th |
95th |
Maximum |
Minimum |
|
|
A. Level: No Grab Bars/No Backrest |
||||||||
|
Angle (degrees) |
0.0 |
14.5 |
28.0 |
50.0 |
90.0 |
90.0 |
0.0 |
|
|
A. Maximum Height: No Grab Bars/No Backrest |
||||||||
|
Angle (degrees) |
0.0 |
18.0 |
30.0 |
53.0 |
90.0 |
90.0 |
0.0 |
|
|
1. Minimum Height: No Grab Bars/No Backrest |
||||||||
|
Angle (degrees) |
0.0 |
17.0 |
30.0 |
50.0 |
90.0 |
90.0 |
0.0 |
|
|
1. Maximum Height: Grab Bars/No Backrest |
||||||||
|
Angle (degrees) |
0.0 |
12.0 |
27.0 |
50.0 |
90.0 |
90.0 |
0.0 |
|
|
1. Minimum Height: Grab Bars/No Backrest |
||||||||
|
Angle (degrees) |
0.0 |
13.5 |
28.0 |
52.5 |
90.0 |
90.0 |
0.0 |
|
|
1. Maximum Height: Grab Bars and Backrest |
||||||||
|
Angle (degrees) |
0.0 |
11.8 |
24.5 |
44.0 |
90.0 |
90.0 |
0.0 |
|
|
1. Minimum Height: Grab Bars and Backrest |
||||||||
|
Angle (degrees) |
0.0 |
12.3 |
28.0 |
49.3 |
90.0 |
90.0 |
0.0 |
|
Table 15. Angle of approach transferring FROM the station
|
|
Percentiles |
|
|
|||||
|
Protocol |
5th |
25th |
50th |
75th |
95th |
Maximum |
Minimum |
|
| A. Level: No Grab Bars/No Backrest | ||||||||
|
Angle (degrees) |
0.0 |
14.5 |
30.0 |
50.0 |
90.0 |
90.0 |
0.0 |
|
| A. Maximum Height: No Grab Bars/No Backrest | ||||||||
|
Angle (degrees) |
0.0 |
18.0 |
30.0 |
53.0 |
90.0 |
90.0 |
0.0 |
|
| A. Minimum Height: No Grab Bars/No Backrest | ||||||||
|
Angle (degrees) |
0.0 |
17.0 |
30.0 |
50.0 |
90.0 |
90.0 |
0.0 |
|
| B, Maximum Height: Grab Bars/No Backrest | ||||||||
|
Angle (degrees) |
0.0 |
12.0 |
27.0 |
50.0 |
90.0 |
90.0 |
0.0 |
|
| B. Minimum Height: Grab Bars/No Backrest | ||||||||
|
Angle (degrees) |
0.0 |
13.5 |
28.0 |
52.5 |
90.0 |
90.0 |
0.0 |
|
| C. Maximum Height: Grab Bars and Backrest | ||||||||
|
Angle (degrees) |
0.0 |
11.8 |
24.5 |
44.0 |
90.0 |
90.0 |
0.0 |
|
| C. Minimum Height: Grab Bars and Backrest | ||||||||
|
Angle (degrees) |
0.0 |
12.3 |
28.0 |
49.3 |
90.0 |
90.0 |
0.0 |
|
Preferred Seat Widths
The seat width percentiles remained the same for transfers to and from the station and within each protocol. For all protocols the majority of participants used the 18.0 inch transfer platform seat width to make their attainable transfers (Table 16).
Table 16. Percentiles for the Preferred Seat Widths (in inches)
|
|
Percentiles |
|
|
||||||||
|
|
5th |
25th |
50th |
75th |
95th |
Mini-mum |
Maxi-mum |
||||
|
Level Height A |
24.6 |
18.0 |
18.0 |
18.0 |
18.0 |
18.0 |
28.0 |
||||
|
Protocol A: |
|||||||||||
|
Highest Height |
26.9 |
18.0 |
18.0 |
18.0 |
18.0 |
18.0 |
28.0 |
||||
|
Lowest Height |
26.9 |
18.0 |
18.0 |
18.0 |
18.0 |
18.0 |
28.0 |
||||
|
Protocol B: |
|||||||||||
|
Highest Height |
24.7 |
18.0 |
18.0 |
18.0 |
18.0 |
18.0 |
28.0 |
||||
|
Lowest Height |
24.8 |
18.0 |
18.0 |
18.0 |
18.0 |
18.0 |
28.0 |
||||
|
Protocol C: |
|||||||||||
|
Highest Heights |
24.7 |
18.0 |
18.0 |
18.0 |
18.0 |
18.0 |
28.0 |
||||
|
Lowest Heights |
24.8 |
18.0 |
18.0 |
18.0 |
18.0 |
18.0 |
28.0 |
||||
Effect of Handhelds on Transfer Height
Participant preference for grab bars and backrest heights for protocols B through E are shown in Table 17. For all protocols the tall grab bars were preferred. For protocol C the medium and short back rests were almost equally preferred. Although the participants selected a grab bar and backrest height, not all participants used them when they were on the station. The numbers and percentages of participants that actually used the grab bars are shown in Table 18. Only a few people used the backrests during the transfers. For transferring higher one participant used the backrest with their trailing arm on the way back to their WMD seat after having obtained the transfer. Two participants used the backrest for the minimum height transfers. They used the backrest by their trailing arm moving back to their mobility device seat.
Table 17. Grab bar and backrest preferences for protocols B through E
|
|
|
||||
|
Protocol |
Tall Grab Bar |
Short Grab Bar (2.75in) |
Tall Backrest (20.0in) |
Medium Backrest (17.0in) |
Short Backrest (14.0in) |
|
Protocol B |
n = 54 |
n = 17 |
NA |
NA |
NA |
|
Protocol B |
n = 54 |
n = 16 |
NA |
NA |
NA |
|
Protocol C |
n = 53 |
n = 18 |
n = 3 |
n = 33 |
n = 35 |
|
Protocol C |
n = 53 |
n = 16 |
n = 3 |
n = 33 |
n = 33 |
|
Protocol D |
n = 52 |
n = 12 |
NA |
NA |
NA |
|
Protocol D |
n = 53 |
n = 11 |
NA |
NA |
NA |
|
Protocol E |
n = 53 |
n = 11 |
NA |
NA |
NA |
|
Protocol E |
n = 52 |
n = 11 |
NA |
NA |
NA |
Table 18. The use of grab bars for protocols B through E
|
|
|
|
|
|
||||
|
Protocol |
Leading Arm TO |
Trailing Arm TO |
Leading Arm FROM |
Trailing Arm FROM |
TO Second Platform Leading |
TO Second Platform Trailing |
FROM Second Platform Leading |
FROM Second Platform Leading |
|
Protocol B (n=72) |
n = 56 |
n = 15 |
n = 5 |
n = 56 |
NA |
NA |
NA |
NA |
|
Protocol B (n=71) |
n = 49 |
n = 15 |
n = 2 |
n = 47 |
NA |
NA |
NA |
NA |
|
Protocol C (n=72) |
n = 54 |
n = 12 |
n = 4 |
n = 55 |
NA |
NA |
NA |
NA |
|
Protocol C (n=71) |
n = 51 |
n = 12 |
n = 1 |
n = 47 |
NA |
NA |
NA |
NA |
|
Protocol D (n=64) |
n = 43 |
n = 12 |
n = 0 |
n = 46 |
n = 60 |
n =58 |
n = 59 |
n = 58 |
|
Protocol D (n=64) |
n = 43 |
n = 15 |
n = 4 |
n = 35 |
n = 58 |
n =58 |
n = 55 |
n = 51 |
|
Protocol E(n=64) |
n = 46 |
n = 16 |
n = 5 |
n = 40 |
n = 55 |
n =53 |
n = 52 |
n = 51 |
|
Protocol E (n=63) |
n = 44 |
n = 17 |
n = 3 |
n = 32 |
n = 54 |
n =53 |
n = 51 |
n = 51 |
The repeated measures ANOVA showed that there was a significant difference between the transfer heights when grab bars were on the station (protocols B and C) compared to when there were no grab bars or a backrest on the station (protocol A). Participants were able to transfer higher and lower with the presence of the grab bars. The results from this test are shown in Table 19.
Table 19. Repeated measures results for protocols A, B and C
|
|
|
Protocol A |
Protocol B |
Protocol C |
|
Highest Height Attained |
Mean |
28.7ǂ |
29.6ǂ |
29.3 |
|
Highest Height Attained |
Std. Deviation |
3.9 |
4.2 |
3.5 |
|
Highest Height Attained |
Median |
28.0 |
29.0 |
29.0 |
|
Lowest Height Attained |
Mean |
14.5*+ |
13.6* |
13.6+ |
|
Lowest Height Attained |
Std. Deviation |
4.2 |
4.1 |
4.1 |
|
Lowest Height Attained |
Median |
14 |
12.3 |
12.3 |
ǂ Significant difference between A and B, p=0.001
*Significant difference between A and B, p= 0.016
+Significant difference between A and C, p=0.017
User Comments/Questions
Add Comment/Question