Independent Wheelchair Transfers in the Built Environment: How Transfer Setup Impacts Performance Phase 2: Final Report
Detailed Age Demographics
Th [sic] histogram of ages shows a slight skew to the right (Figure 4), indicating that more individuals in the 45-64 age range were tested compared to adults who were in the 25-45 age range. Table 4 shows the number of participants in each age category and the percentage of the total study sample that each age group makes up.
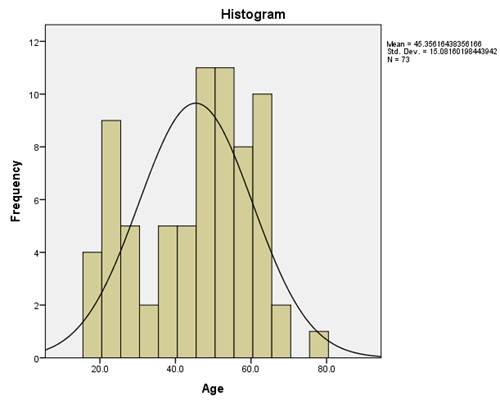
Figure 4. Histogram of age distribution for the study participants
Table 4. Percentage of Participants in each age range category
Age Bin |
Percent |
|
18-24 |
14 |
|
25-34 |
14 |
|
35-44 |
12 |
|
45-54 |
30 |
|
55-64 |
25 |
|
65-74 |
4 |
|
75-84 |
1 |
User Comments/Questions
Add Comment/Question