Independent Wheelchair Transfers in the Built Environment: How Transfer Setup Impacts Performance Phase 2: Final Report
Mobility Use Demographics
There were 46 manual wheelchairs users, 20 power wheelchair users, 3 scooter users and 4 manual power assist users enrolled in the study. The percentages of the total for each type of mobility device can be seen in Figure 5.
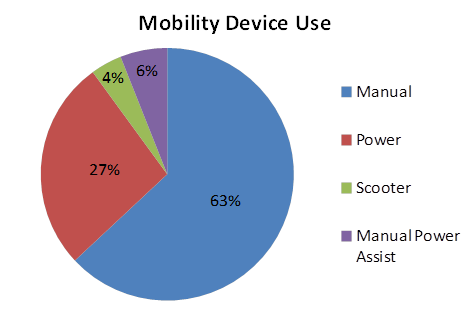
Figure 5. Wheeled mobility devices used by study participants
Tables 6 and 7 show the breakdown of men and women and mobility type by self-reported disability for the study participants respectively.
Table 6. Number of participants by self-reported disability type and WMD type for males study participants
|
|
Male Participants |
|||
|
Disability |
Manual WC |
Power WC |
Scooter |
MPA |
|
Spinal Cord Injury |
22 (30%) |
5 (7%) |
1(1.5%) |
1 (1.5%) |
|
CP |
0 (0%) |
0 (0%) |
1 (1.5%) |
0 (0%) |
|
MS |
2 (3%) |
1 (1.5%) |
0 (0%) |
0 (0%) |
|
Amputee |
8 (11%) |
1 (1.5%) |
0 (0%) |
0 (0%) |
|
Spina Bifida |
3 (4%) |
1 (1.5%) |
0 (0%) |
0 (0%) |
|
Other |
4 (5%) |
4 (5.5%) |
0 (0%) |
2 (3%) |
|
Total |
39 (53%) |
12 (16%) |
2 (3%) |
3 (4%) |
Table 7. Number of participants by self-reported disability type and WMD type for female study participants
|
|
Female Participants |
|||
|
Disability |
Manual WC |
Power WC |
Scooter |
MPA |
|
Spinal Cord Injury |
6 (8%) |
1 (1.5%) |
0 (0%) |
1 (1.5%) |
|
CP |
0 (0%) |
2 (3%) |
0 (0%) |
0 (0%) |
|
MS |
0 (0%) |
2 (3%) |
0 (0%) |
0 (0%) |
|
Amputee |
0 (0%) |
0 (0%) |
0 (0%) |
0 (0%) |
|
Spina Bifida |
0 (0%) |
0 (0%) |
0 (0%) |
0 (0%) |
|
Other |
1 (1.5%) |
3 (4%) |
1 (1.5%) |
0 (0%) |
|
Total |
7 (9.5%) |
8 (11.5%) |
1 (1.5%) |
1 (1.5%) |
User Comments/Questions
Add Comment/Question