
Publication Number: FHWA-HRT-04-103
Date: October 2004
Characteristics of Emerging Road and Trail Users and Their Safety
Federal Highway Administration
Research and Development
Turner-Fairbank Highway Research Center
6300 Georgetown Pike
McLean, VA 22101
FOREWORD
Throughout the United States, there has been a dramatic increase in the varieties and numbers of nonmotorized users on trail and roadway facilities. Kick scooters, inline skates, hand cycles, recumbent bicycles, and other emerging users are now commonly seen sharing space with bicycles and pedestrians on roadways and shared use paths. Urban trail operators are reporting operational and safety problems associated with the increasing number of emerging users and their operational needs. User groups are petitioning State legislatures and local governments to legally operate their nonmotorized vehicles on roadways. The guidelines provided in the American Association of State Highway and Transportation Officials (AASHTO) Guide to the Development of Bicycle Facilities are based on the physical dimensions and operating characteristics of bicycles only and may not meet the needs of emerging trail users. To address these issues, the Federal Highway Administration (FHWA) sponsored this study to better understand the physical dimensions and operational characteristics of an increasingly diverse group of nonmotorized trail and roadway users.
The results of this study can be used to help design professionals adequately design roadway and shared use path facilities to meet the operational and safety needs of a more diverse group of users.
Michael Trentacoste
Director, Office of Safety
Research and Development
Notice
This document is disseminated under the sponsorship of the U.S. Department of Transportation in the interest of information exchange. The U.S. Government assumes no liability for the use of the information contained in this document.
The U.S. Government does not endorse products or manufacturers. Trademarks or manufacturers' names appear in this report only because they are considered essential to the objective of the document.
Quality Assurance Statement
The Federal Highway Administration (FHWA) provides high-quality information to serve Government, industry, and the public in a manner that promotes public understanding. Standards and policies are used to ensure and maximize the quality, objectivity, utility, and integrity of its information. FHWA periodically reviews quality issues and adjusts its programs and processes to ensure continuous quality improvement.
Technical Report Documentation Page
| 1. Report No. FHWA-HRT-04-103 |
2. Government Accession No. | 3. Recipient's Catalog No. | |
| 4. Title and Subtitle Characteristics of Emerging Road and Trail Users and Their Safety |
5. Report Date October 2004 |
||
| 6. Performing Organization Code | |||
| 7. Author(s) Bruce W. Landis, Theodore A. Petritsch, and Herman F. Huang |
8. Performing Organization Report No. | ||
| 9. Performing Organization Name and Address Sprinkle Consulting, Inc. 18115 US Highway 41 North, Suite 600 Lutz, FL 33549 |
10. Work Unit No. (TRAIS) | ||
| 11. Contract or Grant No. DTFH61-02-C-00026 |
|||
| 12. Sponsoring Agency Name and Address Federal Highway Administration Turner-Fairbank Highway Research Center 6300 Georgetown Pike McLean, VA 22101 |
13. Type of Report and Period Covered Final Report January 2002-January 2004 |
||
| 14. Sponsoring Agency Code | |||
|
15. Supplementary Notes Contracting Officer's Technical Representative (COTR): Ann Do, Office of Safety Research and Development, HRDS-06 |
|||
|
16. Abstract This study was undertaken to clarify the operational characteristics of an increasingly diverse group of trail and other nonmotorized transportation users. Three "Ride for Science" data collection events were conducted to obtain the physical dimensions, turning capabilities, lateral operating space, acceleration, speed, and stopping sight distance of trail users. The results confirmed the great diversity in the operating characteristics of various road and trail user types. Some examples of findings include: Sweep Width-The 85th percentile inline skater had a 1.5-meter (m) (4.9-foot (ft) sweep width, wider than the AASHTO recommended width for bike lanes. Design Speed-Recumbent bicyclists had the highest observed 85th percentile speeds of 29 kilometers per hour (km/h) (18 miles per hour (mi/h)), less than AASHTO's minimum design speed. Horizontal Alignment-Most users did not reduce their speeds for turning radii greater than 16 m (52.5 ft). Stopping Sight Distance-A recumbent cyclist in the 85th percentile requires a stopping sight distance of 32.7 m (107.3 ft) on wet pavement, less than the AASHTO value. Vertical Alignment/Crest Vertical Curves-Recumbent bicyclists had a required length of a crest vertical curve of 46.7 m (153 ft), less than the AASHTO value. Signal Clearance Intervals-Five-second clearance intervals would provide insufficient time for most users (85th percentile users) to clear a five-lane (18.3-m (60-ft) wide) intersection. Characteristics of Segway® Users-Many characteristics of Segway users were comparable with those of other emerging trail users. These findings suggest that design guidelines may need to be revised to incorporate the needs of emerging trail users. The results of this study can be used to help design professionals adequately design roadway and shared use path facilities to meet the operational and safety needs of this growing group of users. |
|||
| 17. Key Word Bicyclists, emerging users, AASHTO, operating characteristics, shared use paths |
18. Distribution Statement No restrictions. |
||
| 19. Security Classif. (of this report) Unclassified |
20. Security Classif. (of this page) Unclassified |
21. No. of Pages |
22. Price |
Form DOT F 1700.7 (8-72) Reproduction of completed page authorized
EXECUTIVE SUMMARY
Introduction
The variety of users on the trails and roadways of the United States has increased dramatically over recent years. Devices such as kick scooters, inline skates, hand cycles, and recumbent bicycles that were rarely seen on shared use paths as recently as 10 years ago are now common. Among the reasons for this shift are the development of new technologies and changing demographics. For example, electric personal transporter devices (e.g., the Segway®) are new technologies that are appearing on paths and roadways around the country. Additionally, coincident with the aging of the American population, the number of people using mobility assistive devices (such as manual wheelchairs, powered wheelchairs, and powered scooters) is increasing.
With the increasing variety of emerging users comes the question of whether we are designing and building suitable facilities. Many jurisdictions throughout the United States have adopted the American Association of State Highway and Transportation Officials (AASHTO) Guide to the Development of Bicycle Facilities as a standard for shared use trail design and other facilities used by nonmotorized travelers. This guide is written with bicyclists in mind, so its recommendations are based on the physical dimensions and operating characteristics of bicyclists. Furthermore, some user groups are petitioning to legally operate on roadways and streets. As this report will document, some users have different characteristics from bicyclists, so facilities designed and built to accommodate bicyclists and/or motorists may not meet the needs of these users.
The Federal Highway Administration (FHWA) recognized this need to accommodate emerging trail users and sponsored this study to better understand their physical dimensions and operational characteristics. This research naturally links the existing capacity methodologies in the Highway Capacity Manual and the FHWA study on "Evaluation of Safety, Design, and Operation of Shared Use Paths"with the design professionals' need for adequate information to design facilities to meet the operational and safety requirements of the increasingly diverse nonmotorized transportation users. It represents a very important step in providing crucial information for the future development of AASHTO's Policy on Geometric Design of Highways and Streets, the AASHTO Guide to the Development of Bicycle Facilities, the AASHTO Pedestrian Facilities Guide, as well as other new design standards.
This report describes the operational characteristics of bicycles and these emerging user types:
-
Inline skates
-
Electric bicycles
-
Kick scooters
-
Tandems
-
Strollers
-
Segway
-
Recumbent bicycles
-
Manual wheelchairs
-
Bicycle trailers
-
Assistive power scooters
-
Power wheelchairs
-
Adult tricycles
-
Skateboards
-
Hand cycles
Organization of this Report
This report begins with an introduction explaining why this research is needed. The next section discusses potential sources of safety and crash data. Details of the field data collection plan are provided in the third section. The results of the field data collection are then presented, followed by a discussion of the results and their implications for what the design user types should be for each of several design criteria. Next, recommendations regarding design criteria are given. The report concludes with a marketing plan.
Safety/Crash Data Availability
As part of this study, a variety of data sources were examined with regard to their potential for providing information on the safety of emerging road and trail users:
-
Data from the National Electronic Injury Surveillance System (NEISS).
-
Other hospital discharge, trauma registry, or ED data.
-
State motor vehicle crash databases.
-
State narrative crash data. These data sources were found to have limited usefulness in safety analysis for emerging user types. Of these sources, NEISS was the most useful data format for safety studies.
Field Data Collection
In this study, data were obtained by observing shared use path users at seven types of observation stations to generate:
-
Physical dimensions: length, width, height, eye height, wheelbase, wheel spacing, wheel diameter, tire/wheel width, tire type.
-
Space required for three-point turn.
-
Lateral operating space (sweep width).
-
Turning radii.
-
Acceleration capabilities.
-
Speed.
-
Stopping sight distance: perception / reaction (time) and braking distance.
Three data collection ("Ride for Science") events were held in 2003: Pinellas Trail in St. Petersburg, FL (January 25, 2003); Paint Branch Trail in College Park, MD (May 3, 2003); and San Lorenzo River Trail in Santa Cruz, CA (June 13, 2003).
The trail users consisted of both active and in situ (passive) participants. Active participants were those who either were intercepted on the shared use path (via event signage) or responded to the public outreach program and specifically traveled to the location to actively participate in the event. Active participants registered with the data collectors and were given a briefing on the purpose of the study, an overview of the event and course, and safety provisions. They generally progressed through all the data collection stations. In situ participants were those who were on the shared use path just "passing through" the event stations. Thus, at all seven stations, data were collected from active participants. At two stations, speed and lateral operating space, data were also collected on in situ participants. A total of 811 participants (551 in situ and 260 active) were observed at the three events.
Discussion
This research shows that there is a great diversity in the operating characteristics of various types of road and trail users. To ensure the safe accommodation of emerging road and trail users, their operating characteristics must be considered in the development of design criteria; in some cases, it will be important to use an emerging user instead of the bicycle as the design user.
Sweep Width
With respect to sweep width, the critical user is the inline skater, having an 85th percentile sweep widths of 1.5 meters (m) (5.0 feet (ft)). This research only addressed individual users. Users traveling abreast or passing each other may require additional space.
Three-Point Turns
For three-point turn widths, hand cyclists are the critical users, requiring 5.4 m (17.8 ft) (at the 85th percentile level). Several other user types, including bicyclists and recumbent bicyclists, required more than 3 m (10 ft) of width (at the 85th percentile level) to execute a three-point turn.
Design Speed
The design speed of a facility is that speed used to determine the various geometric design features of a facility. It influences many aspects of geometric design. Consequently, it can significantly impact the cost, operational safety, and constructability of a project.
Recumbent bicyclists had the highest observed 85th percentile speeds, 29 kilometers per hour (km/h) (18 miles per hour (mi/h)). This appears to suggest that they may be the appropriate user upon which to set a minimum design speed. However, before coming to such a conclusion, the additional design characteristics of the various users need to be evaluated.
At the other extreme, hand cyclists appear to have the lowest 15th percentile speed, 8 km/h (5 mi/h), of those users who would be expected to operate in the street. Among all user types, strollers had the lowest 15th percentile speed (4 km/h (3 mi/h)).
Horizontal Alignment
For horizontal alignment, the critical factor is the point at which users will instinctively decelerate to maintain a comfortable degree of lateral acceleration while traversing a curve. This point is represented by the coefficient of friction used in AASHTO's minimum design radius equations. Most users did not appear to reduce their speeds for radii greater than 15.3 m (50 ft). The exception is recumbent bicyclists, who may have been constrained by even the 27.5-m (90ft) radius.
Stopping Sight Distance
Adequate sight distance is required to provide path users ample opportunity to see and react to the unexpected. The distance required for a user to come to a complete stop, stopping sight distance, is a function of the user's perception and brake reaction time, the initial speed of the user, the coefficient of friction between the user's wheels and the pavement, the braking ability of the user's device, and the grade (all the observations of this research were conduced on flat grades).
The critical trail user for stopping sight distance is the recumbent bicyclist, with a calculated stopping sight distance on wet pavement of 32.7 m (107 ft).
Vertical Alignment-Crest Vertical Curves
The minimum length for a crest vertical curve is a function of the stopping sight distance, the algebraic difference in the upgrade and downgrade grades, the assumed height of an object on the pavement, and the user's eye height.
The recumbent bicyclist would be the critical user for determining the minimum length of a crest vertical curve. Using the 85th percentile stopping distance and eye height, and assuming wet pavement conditions, the minimum length of a crest vertical curve with a difference in grade of 10 percent would be 46.7 m (153 ft) for recumbent bicyclists.
Refuge Islands
When designing a path crossing of a roadway, refuge islands are frequently provided between opposing motor vehicle traffic flows to allow pathway users to cross only one direction of traffic at a time. The longest likely users, bicycles with trailers, exceeded 2.4 m (8 ft) in length and should be considered the critical users. Two other user groups, recumbent bicyclists and hand cycles, both had 85th percentile lengths in excess of 1.8 m (6 ft).
Signal Clearance Intervals
Roadway users approaching a traffic signal that changes to yellow often cannot stop before the signal turns red; signal clearance intervals allow time to enter and clear the intersection before the cross-street traffic is given a green light. Signal clearance intervals include both the yellow interval and any all-red interval. Signal clearance intervals timed for motor vehicle traffic (typically a maximum of five seconds) provide insufficient time for most users to clear a five-lane (18.3-m (60-ft) wide) intersection. For intersections wider than 8.1 m (24 ft), the kick scooter appears to be the critical user.
Pedestrian Clearance Intervals
Pedestrian clearance intervals allow pedestrians who begin crossing a signalized intersection before the beginning of the flashing DON'T WALK phase to completely cross the street before crossing traffic enters the intersection. Typically, pedestrian signals are timed for walking speeds of 1.2 m/second (sec) (4 ft/sec). The manual wheelchair users evaluated were able to cross intersections within the time provided for an assumed 1.2 m/sec (4 ft/sec) walking speed. A walking speed of less than 1.2 m/sec (4 ft/sec) should be considered in determining the pedestrian clearance time at crosswalks that are routinely used by slower pedestrians, including those who use wheelchairs.
Minimum Green Times
Another signalization criterion is minimum green time. The AASHTO equation addresses three factors in its calculation of minimum green time for signalized intersections: perception-reaction time, acceleration time, and travel time at the design speed. Perception-reaction time is assumed to be 2.5 sec. The AASHTO equation assumes a constant acceleration rate; however, this research shows that the assumption is not accurate. After an initial increase to the acceleration rate, the rate decreases with increasing speed. Rather than produce an equation that compensates for the change in acceleration as speed increases, a table format has been used to represent the distance traveled as a function of time. Further, as many users were on "long" devices (for example, recumbent bicycles had an 85th percentile length of 208 centimeters (cm) (82 inches)), the length of the device is included in the travel distances in table 21 so that the times shown include the time that it takes for the user to accelerate from a stop and completely clear the length of his/her device from the intersection.
Hand cyclists are the critical users to consider when determining the appropriate minimum green times for vehicular devices (table 11, figure 49).
Characteristics of Segway Users
The data from this study provide information on the performance and maneuverability of the Segway and how it might function within shared use paths, sidewalks, and streets. Table 1 shows how the Segway characteristics compare with the design values (for bicyclists) in the AASHTO Guide. The Segway was not found to be the critical user for any design criteria.
Table 1. Characteristics of Segway users vs. AASHTO (bicycle) values.
| CHARACTERISTIC | SEGWAY (MIN-MAX VALUES) | AASHTO (BICYCLE) VALUE |
|---|---|---|
| Eye height (cm) | 175-204 | 140 |
| Length (cm) | 56 | 180 |
| Width (cm) | 64 | 120 |
| Acceleration rate from 0 to 12.2 m (m/sec2) | 0.29-0.36 | 0.46-0.92 |
| Acceleration rate from 12.2 to 24.4 m (m/sec2) | 0.49-0.98 | 0.46-0.92 |
| Acceleration rate from 24.4 to 36.6 m (m/sec2) | 0.05-0.12 | 0.46-0.92 |
| Acceleration rate from 36.6 to 48.8 m (m/sec2) | 0.03-0.95 | 0.46-0.92 |
| Time to travel 12.2 m (sec) | 4.1-4.6 | 5.2 |
| Time to travel 24.4 m (sec) | 6.6-7.8 | 9.8 |
| Time to travel 36.6 m (sec) | 8.7-11.1 | 11.4 |
| Time to travel 48.8 m (sec) | 10.9-14.7 | 12.8 |
| Speed (km/h) | 14-18 | 30 |
| Perception-reaction time (sec) | 0.6-2.0 | 1.5 |
| Sweep width (m) | 0.9-1.7 | 1.0 |
| Three-point turn (cm) | 97-102 | 300 |
1 cm = 0.39 inches 1 m = 3.28 ft 1 km = 0.621 mi
Recommendations
The AASHTO Guide for the Development of Bicycle Facilities is the primary reference for designers of shared use facilities and has been adopted as the standard for shared use path design by many jurisdictions around the country. Its standards were developed using the operational characteristics of the bicycle to determine design criteria. While this research is not intended to validate or discredit the AASHTO criteria, comparisons to AASHTO are appropriate because of its status as a national guide.
The data collected for this study reveal that the appropriate design user for shared use paths may vary with respect to design criteria or a facility design element. Table 2 shows design features, AASHTO design values for bicyclists, potential design users, and 85th percentile performance values.
Table 2. Design criteria and potential design users.
| DESIGN FEATURE | AASHTO DESIGN VALUE (FOR BICYCLISTS) | POTENTIAL DESIGN USER | PERFORMANCE VALUE (85TH PERCENTILE) |
|---|---|---|---|
| Sweep width | 1.2 m | Inline skaters | 1.5 m |
| Horizontal alignment | 27 m | Recumbent bicyclists | 26.8 m |
| Stopping sight distance (wet pavement) | 38.7 m | Recumbent bicyclists | 32.7 m |
| Vertical alignment-crest (5% grades) | 49.8 m | Recumbent bicyclists | 46.7 m |
| Refuge islands | 2.5 m | Bicycles with trailers | 3.0 m |
| Signal clearance intervals | 7.5 sec for a distance of 24.4 m | Kick scooters | 10.6 sec for a distance of 24.4 m |
| Minimum green times | 12.8 sec for a distance of 24.4 m | Hand cyclists | 17.9 sec for a distance of 24.4 m |
| Pedestrian clearance intervals | 20.0 sec for a distance of 24.4 m | Manual wheelchairs | 15.4 sec for a distance of 24.4 m |
1 m = 3.28 ft
It is worth noting that bicyclists (without trailers) do not appear as critical users for any design features. This is a major finding that may have a significant effect on how shared use paths and other components of the U.S. transportation system are designed, constructed, controlled, and maintained.
While additional research is needed to determine which user type should be the basis for specific design criteria, the findings suggest that design guidelines may need to be revised to incorporate the needs of emerging trail users. The results of this study can be used to help design professionals adequately design roadway and shared use path facilities to meet the operational and safety needs of a more diverse group of user types.
Marketing Plan
The goal of the marketing plan is to outline how to disseminate the information in this report to transportation professionals, trail designers/coordinators, landscape architects, engineers, public works officials, and other professionals and policymakers. The results of this study are being publicized through numerous venues and using different methods. These include slide presentations to Transportation Research Board (TRB) committees and at the Midwest Regional Bike/Ped Conference; a poster session at the TRB 2004 Annual Meeting; new National Highway Institute (NHI) course development (or modifications to existing bicycle and pedestrian facility design courses); and others. Much of this marketing plan has already been implemented.
INTRODUCTION
The varieties of equipment on our trails and roadways has increased dramatically over recent years: Kick scooters, inline skates, hand cycles, and recumbent bicycles were uncommon on shared use paths as recently as 10 years ago; now they are common. Among the reasons for this shift are the development of new technologies and changing demographics. For example, with the aging of the American population, the number of people using mobility assistive devices (such as manual wheelchairs, powered wheelchairs, and powered scooters) is increasing.(1)Additionally, electric personal transporter devices (e.g., the Segway) are new technologies that are appearing on paths and roadways around the country.
With increases in the number of emerging users comes a greater need to design and build suitable facilities. The Americans with Disabilities Act Accessibility Guidelines (ADAAG) set minimum standards for constructing and altering pedestrian facilities, including shared use paths, sidewalks, and crosswalks. By law, States and local jurisdictions are required to follow ADAAG when constructing or altering any pedestrian facility. Many jurisdictions throughout the United States have adopted the AASHTO Guide to the Development of Bicycle Facilities as a standard for the design of shared use trails and other facilities for nonmotorized transportation users.(2)As its title implies, the guide is written with bicyclists in mind, so its recommendations are based on the physical dimensions and operating characteristics of bicyclists. As this report will document, emerging users have different characteristics from bicyclists, thus trails (and other transportation facilities) designed and built to accommodate bicyclists may not meet their needs. Indeed, both formal and informal surveys of operators of shared paths (urban trails) reveal increasing problems with their facilities due to the increasing number of emerging users, their space requirements, and operational needs.
The growing need to accommodate emerging users is not restricted to off-street shared use paths. For example, many inline skaters believe that they should be allowed access to the roadway with the same rights as bicyclists. In fact, numerous initiatives throughout the United States range from local ordinances allowing inline skating on local streets to pending laws in State legislatures. In New York State for example, inline skating is now legally allowed on roads, with skaters subject to the same rules and laws as bicyclists.
FHWA recognized this need to accommodate emerging trail users and sponsored this study to better understand their physical dimensions and operational characteristics. To get this information, field data collection was performed on bicyclists and emerging users on three paths: the San Lorenzo River Trail in California, the Pinellas Trail in Florida, and the Paint Branch Trail in Maryland. This research naturally links the existing capacity methodologies in the Highway Capacity Manual and the FHWA study on "Evaluation of Safety, Design, and Operation of Shared Use Paths" with design professionals' need for adequate information to design roadway and shared use path facilities to meet the operational and safety needs of the increasingly diverse trail and other nonmotorized transportation users. It represents an important step in providing crucial information for the future development of AASHTO's Policy on Geometric Design of Highways and Streets, the AASHTO Guide to the Development of Bicycle Facilities, the AASHTO Pedestrian Facilities Guide, as well as other new design standards.
This report begins with definitions and operational characteristics of these emerging user types:
-
Inline skates.
-
Electric bicycles.
-
Kick scooters.
-
Tandems.
-
Strollers.
-
Segway.
-
Recumbent bicycles.
-
Manual wheelchairs.
-
Bicycle trailers.
-
Assistive power scooters.
-
Power wheelchairs.
-
Adult tricycles.
-
Skateboards.
-
Hand cycles.
The next section discusses potential sources of safety and crash data. Details of the field data collection plan are given in the third section. The results of the field data collection are then presented, followed by a discussion of the results and their implications for who the design users should be for each of several design criteria. Recommendations follow regarding design criteria and dissemination of these results. The report concludes with a marketing plan.
1. Russell, N.J., G.E. Hendershot, F. LeClere, et al. Trends and Differential Use of Assistive Technology Devices: United States, 1994. Advance Data from Vital and Health Statistics, No. 292, National Center for Health Statistics, Hyattsville, MD, 1997.
2. American Association of State Highway and Transportation Officials. Guide for the Development of Bicycle Facilities. American Association of State Highway and Transportation Officials, Washington, DC, 1999.
DEFINITIONS AND OPERATIONAL CHARACTERISTICS OF ROAD AND TRAIL USERS
This section provides a working definition of each user group. The basic characteristics of the vehicles or devices used by each group are described, as are the users' varying abilities. Earlier studies of inline skates, scooters, strollers, electric bicycles, adult tricycles, recumbents, tandems, bicycle trailers, golf carts, and assistive technologies are referenced and are listed in the appropriate sections. Other sources are included, such as articles in academic journals, conference proceedings, manufacturers' Web sites, public health and advocacy Web sites, and retailer Web sites.
Inline Skates
Inline skates, like their predecessors, quad-wheel skates, are used extensively throughout the United States for recreational and transportation purposes by people of all ages and athletic abilities (figure 1). They typically have three to five wheels of about 75 to 100 millimeters (mm) (3 to 4 inches) (Unless otherwise noted, all photos are by Bruce W. Landis.) with a single frame to a shoe or boot that is usually fairly stiff, providing good support and control. Unlike roller skates with two sets of wheels side by side (quad skates), inline skates can be used in much the same way as ice skates, resulting in more efficiency and higher speeds. Few quad skates are now in use, so this study focused on inline skates.
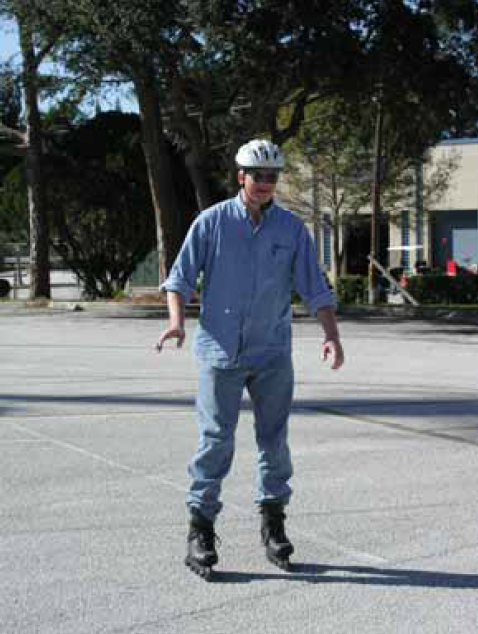
Figure 1. An inline skater.
(Unless otherwise noted, all photos are by Bruce W. Landis.)
Inline roller skates were first developed in the 18th century, preceding the quad skate design invented in the late 19th century; however, the technology then available, quad skates offered more control and became the standard for many years. In the early 1980s, inline skates were reborn based on modern technology, ultimately resulting in the remarkable increase in usage experienced in the 1990s.(3,4,5) With smooth street surfaces and the introduction of polyurethane wheels, inline skates have become very useful devices for transportation and recreation on public ways.
Inline skating grew rapidly as a sport through the 1990s, stabilizing in recent years with about 29 million users in the United States.(6) This represents primarily recreational users, but the growth in recreational users translates to growth in transportation use; many skaters soon realize the transportation potential of skates. As a result, skating is emerging as a mode of transportation.(7)
3. National Museum of Roller Skating (NMRS), various Web pages. www.rollerskatingmuseum.com. Accessed April 23, 2002.
4. Mathis, K. Inline Skating Still a Growth Leader. May 8, 1998. www.iisa.org/releases/980508-growth.htm. Accessed March 18, 2000.
5. International Inline Skating Association (IISA), "Inline Skating Facts & Figures." www.iisa.org/numbers/index.htm. Accessed March 18, 2000.
6. American Sports Data, Inc. Press Release, April 1, 2001. www.americansportsdata.com. Accessed April 23, 2002.
7. Osberg, J. S., S. Faul, J. Poole, and J. McHenry. Skating: An Emerging Mode of Transportation. Presented at the 79th Annual Meeting of the Transportation Research Board, Washington, DC, January 10-14, 2000.
Skating Skill and Performance
According to recent research, differences in skaters' skill levels can result in significant differences in operational characteristics. For example, novice skaters typically travel more slowly and have a narrower sweep width than advanced skaters.(8) Skaters choose among several different techniques to stop, often based loosely on their general skating ability. The more basic stopping techniques used by novice skaters require longer time and distance to stop from a given speed. Novice skaters have difficulty making sharp turns and stopping quickly, especially on downhill grades.(9) Skaters with more practice and experience typically travel at higher speed, which corresponds with a wider sweep width.(8) These skaters also have much more maneuverability and control. Some techniques employed by advanced skaters can stop them in a very short distance when necessary.
8. Birriel, E., J.C. Pernia, J.J. Lu, and T.A. Petritsch. The Operational Characteristics of Inline Skaters. University of South Florida, Tampa, FL, January 2001.
9. Osberg, J.S., and S.C. Stiles. Safety Behavior of In-line Skaters. Injury Prevention, Vol. 6, No. 3, 2000, pp. 229-231.
Skateboards
Skateboards have a platform attached to sets of small wheels (usually four), but do not have steering handles. Each set of wheels is attached to the platform with a pivoting "truck," which allows the board to turn when the user leans his or her body and/or feet. Skateboards are available in many different shapes and sizes, and with different wheel diameters. The variation in sizes results in potential differences in speed, turning radius, and other operational characteristics.
Traditional skateboards are under 84 cm (33 inches) long, but "long boards" over 89 cm (35 inches) are used for "cruising." Skateboard decks are normally about 19 cm to 21 cm (7.5 to 8.25 inches) wide. Skateboard wheels are normally 52 mm to 60 mm (2.05 to 2.36 inches) in diameter. Larger wheels are often used on long boards.
Motorized skateboards are also available, but have diminished in popularity in part due to the increased popularity of motorized kick scooters as described below. In addition, motorized skateboards are specifically prohibited from the public right-of-way in many jurisdictions.
Kick Scooters
This group includes users of kick scooters that typically have two inline wheels connected by a platform that is large enough for a user to stand on with one or two feet. Steering handles are attached to the platform, allowing users an additional point of contact with the board to steer the device and maintain an upright position. This user group includes two subgroups: foot powered kick scooters, and similar standup devices with attached motors. Sit-down 3- or 4-wheel assistive powered scooters used by individuals with disabilities are not included in this user group, but are described later in this document. This user group also does not include the sit-down vehicles also referred to as scooters that are in effect small motorcycles (e.g., Vespastm) intended primarily for roadway use.
Nonmotorized Kick Scooters
The most common nonmotorized kick scooters have approximately 100-mm (4-inch) diameter polyurethane wheels like those on inline skates (figure 2). The platform is usually relatively short and too narrow (100 mm (4 inches)) for two feet side by side. Larger nonmotorized scooters with bigger platforms and 150-mm to 300-mm (6- to 12-inch) wheels with polyurethane or rubber tires are also available. These larger scooters are currently less prevalent, but because they provide more utility due to improved efficiency, several manufacturers are developing and promoting larger models.
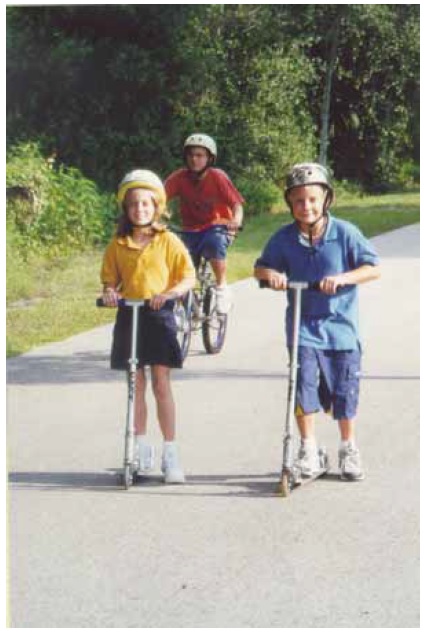
Figure 2. Nonmotorized kick scooters.
Two braking systems are common. Smaller, less expensive scooters have an articulated fender over the rear wheel that can be stepped on to create friction with the wheel. Larger models have a hand brake much like the brakes used on bicycles. A few inexpensive models have no brakes; users simply step on the rear wheel with their shoes or skid their feet on the ground.
Nonmotorized kick scooter use in the United States has increased phenomenally in the past several years. Although very few were sold in 1999, it was estimated that approximately 5 million scooters were sold in the United States in 2000.(10) As expected, scooter crashes have increased significantly as well. The U. S. Consumer Product Safety Commission (CPSC) reported a 13-fold increase in emergency-room-treated scooter injuries between the first and second half of 2000, from 2,820 to 37,750.(11)
Operational characteristics for nonmotorized scooters depend on many factors, including the abilities of the user and the design of the scooter. For example, a nonmotorized scooter with large aluminum wheels has lower rolling resistance than a scooter with small inline skate-type wheels, potentially resulting in faster acceleration rates and higher speeds. It is likely that the different braking systems result in different stopping distances and deceleration rates. Scooters likely have varying maneuverability, as well.
10. Rutherford, Jr. G. W. and R. Ingle. Unpowered Scooter-Related Injuries-United States, 1998-2000. CDC MMWR Weekly, Vol. 49, No. 49, December 15, 2000, pp. 1108-1110. www.cdc.gov/mmwr/preview/mmwrhtml/mm4949a2.htm. Accessed August 10, 2001.
11. Consumer Product Safety Commission. Motorized scooter use increases and injuries climb. Press release, August 22, 2001. www.cpsc.gov/CPSCPUB/PREREL/prhtml01/01222.html
Motorized Kick Scooters
Motorized kick scooters are usually larger than nonmotorized ones. Because the user does not normally need to push, these scooters often have a platform wide enough for two adult feet side by side. Motorized scooters can be either gasoline or electric powered. There are many different manufactures and styles of scooters with different characteristics. Due in part to legislation in some States, most scooters are governed to speeds below 32 km/h (20 mi/h). However, many owners of powered scooters customize their scooters, often removing or modifying the governors. Motorized scooters usually have hand brakes and often have larger, pneumatic rubber tires; and some have pedestal seats.
Baby Strollers
This user group includes a variety of wheeled devices pushed by adults to transport babies or small children. Some stroller models can accommodate up to three children; a few models for four or more are also available on a limited basis. Stroller size varies greatly depending on the number of children to be carried and the type of stroller. The operational characteristics for all types of strollers depend on the wheel size, stroller geometry, and the physical ability of the adult who is pushing the stroller. On most strollers, the babies sit in a partially prone position facing away from the person pushing the device. Larger strollers (often called "baby carriages") where babies lie totally prone are relatively rare in the public right-of-way.
Limited research has been conducted on the use of strollers on public streets and shared use paths. However, two sources discuss stroller safety; one of the main stroller safety concerns is lateral overturning.(12,13)
12. Jana, L. Practical Stroller Safety Tips. www.drspock.com/article/0,1510,5222,00.html. Accessed August 14, 2001.
13. Juvenile Products Manufacturers Association. Carriage and Stroller Safety Remains Important. www.jpma.org/public/pr-043099.html. Accessed August 14, 2001.
Conventional Strollers
These devices typically have four wheels or four pairs of wheels; the wheels are generally small, about 150 mm (6 inches) in diameter. Strollers for one or two children are common, but strollers that carry three or four children are available as well. The small pivoting front wheels on these strollers make them fairly easy to maneuver, but limit their use on unpaved surfaces or rough pavement. These strollers are fairly difficult to maneuver over curbs, so the installation of curb ramps in the public right of way is valuable to these users. Umbrella strollers are foldable, lightweight versions of conventional strollers.
Jogging Strollers
In recent years, large-wheeled jogging strollers have become increasingly popular, especially for longer distance use on paths and roads (figure 3). These strollers usually have spoked wheels of about 300 to 500 mm (12 to 20 inches) diameter with pneumatic rubber tires allowing use at higher speeds and over more varied terrain. Jogging strollers that carry one or two children typically have three wheels, two in the back and one in the front; those for three children are more rare and typically have narrowly spaced front wheels and two rear wheels with wider spacing. The wheels of jogging strollers do not pivot, so steering is accomplished by unweighting the front wheel or wheels and rotating the stroller on the rear axle. Some jogging strollers have hand brakes similar to bicycle brakes, improving stopping capabilities at higher speeds.
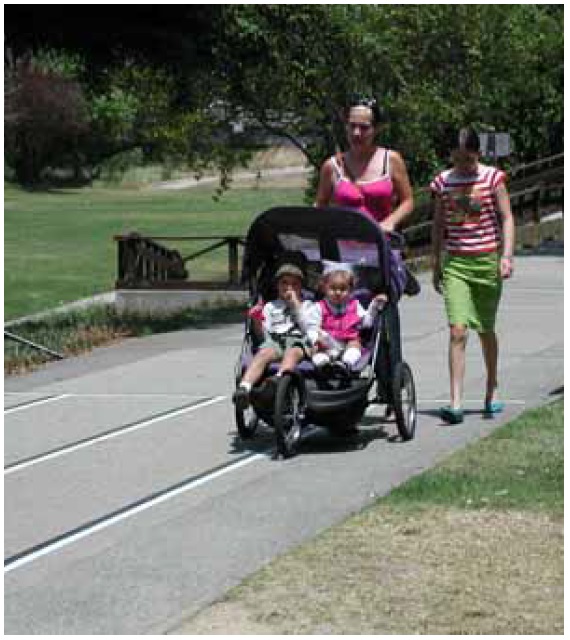
Figure 3. Jogging stroller for two.
Electric Bicycles
Electric bicycles are similar in geometry to human-powered bikes but have a motor that provides pedal assistance and allows riders to accelerate, climb hills, and overcome wind resistance more easily than manually powered bikes. Depending on the rider's weight, the terrain, and wind conditions, the average rider who travels a distance of 16 km (10 miles) at 16 km/hr (10 mi/h) under manual power can travel at 24 to 32 km/h (15 to 20 mi/h) with the same effort when assisted by electric power.(14) Electric bicycles can be obtained as stand-alone products or by adding an electric assist unit to an existing bicycle.
Many States have addressed electric bicycles through legislation. Often the legislation allows electric assisted bikes on bike lanes and shared use paths. For example, an electric bicycle is legally a "bicycle" in California, according to California Vehicle Code CVC 406(b).(14) In Florida, electric bicycles that travel under 32 km/h (20 mi/h) are considered "bicycles."(15)
Because many State statutes limit speeds to 32 km/h (20 mi/h), manufacturers generally design and govern their electric bicycles to match this speed. This speed is not much different from that of a normal bicycle, so many operational characteristics are anticipated to be similar to those for bicycles.
It should be noted that there are also recumbent bicycles, tandem bicycles, and adult tricycles with electric-assisted power. Because these vehicles are relatively rare, they will probably not be evaluated independently, but some operational characteristics will likely be similar to their nonelectric equivalents.
14. Electric-Bikes.com. www.electric-bikes.com/others.htm. Accessed August 10, 2001.
15. State of Florida. The 2000 Florida Statutes. Title XXIII, Section 316.1995. Online Sunshine, www.leg.state.fl.us/Statutes/index.cfm?App_mode=Display_Index&Title_Request=IV. Accessed August 14, 2001.
Tandem Bicycles
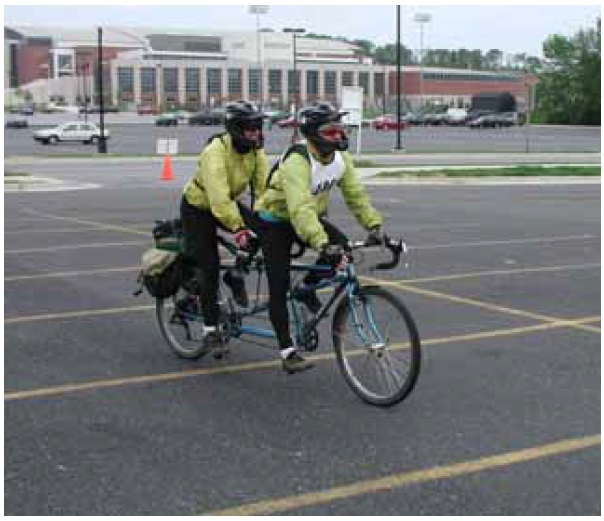
Figure 4. Tandem bicycle.
Tandem bicycles (often called tandems) have positions for two cyclists; typically, the front rider (the "captain") is responsible for steering, balance, shifting, braking, and pedaling, while the back rider (the "stoker") adds pedaling power (figure 4). Due to the significant increase in pedaling energy without much additional wind resistance, tandems allow riders to travel faster and farther with the same effort. The greater mass of a tandem means that tandem bicycles are generally slower traveling uphill and faster traveling downhill than single bikes. Tandem bicycles are typically equipped with multiple gears, including higher gears to accommodate the additional power.
Most tandem bicycles are similar to upright single bikes where riders sit on a small saddle and reach forward to handlebars that are typically at or slightly above or below the seat height. Tandem bicycles are also available in recumbent versions. See below for a more detailed description of recumbent bicycles.
Recumbent Bicycles
Recumbent bicycles, often simply called recumbents (or bents), are bicycles that allow riders to sit in a broad seat, usually with a backrest, potentially reducing neck and wrist pain. Recumbent handlebars are either in front of the user's arms hang naturally.(16) The pedals on recumbent bicycles are usually well forward of the seat (figure 5).
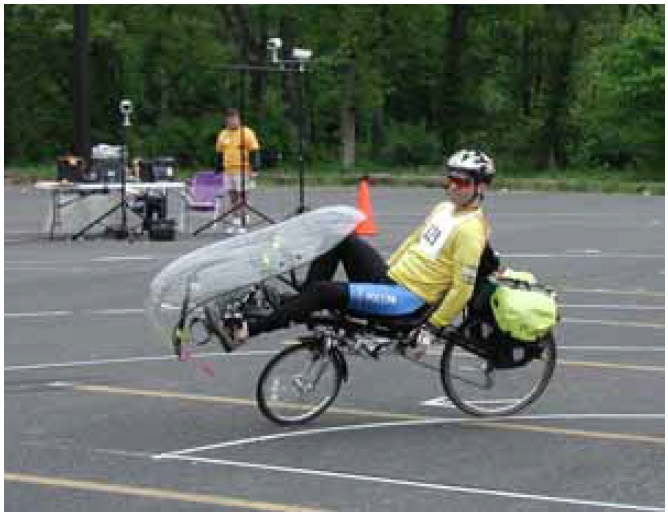
Figure 5. Recumbent bicycle.
Two-wheeled recumbents can be difficult to learn to balance, especially those with under-seat steering. As a result of the seated position, dismounting is more difficult on a recumbent as well. With pedals in front of the seat, riders cannot take advantage of their weight as on a standard bike. This typically results in slower acceleration from stops and the need for lower gears on hills, resulting in slower climbing speeds. The reduced wind resistance of recumbent bicycles provides for increased efficiency, resulting in higher speeds. Recumbents are generally longer and wider than upright bicycles, but they are available in many different shapes and sizes so length and operating width vary greatly. Their low profile results in decreased visibility by other road users, so many recumbent cyclists attach tall flags to increase their visibility.
16. Recumbents.com. www.recumbents.com. Accessed April 24, 2002.
Recumbent Tricycles
Some recumbents are tricycles, most often with two wheels in the front (sometimes two in the rear). These vehicles are wider and more stable at low speed than two-wheeled recumbent bicycles. However, when turning at higher speeds, these vehicles can be unstable. Manufacturers strive to maintain a low center of gravity and use high-tech steering mechanisms to overcome turning instability problems. Simpler, less efficient tricycles used by riders who have mobility impairments are discussed later in this report.
Tandem Recumbent Bicycles
Recumbent bicycles are also available in tandem versions. Tandem recumbent bicycles have the potential for fairly high cruising speeds due to the lower wind resistance of a recumbent combined with the additional energy output of a tandem. These vehicles are uncommon.
Bicycle Trailers
Bicycle trailers are often used to carry children and to transport cargo. Trailers add to the total vehicle length and weight, which may decrease speed and maneuverability, while increasing turning radius and stopping distance. Trailers come in many different shapes and sizes, and are generally low to the ground, so other users may not see the additional length added to a bicycle. Trailer visibility is of increased importance when carrying children. Safety recommendations in several sources include installing a highflying fluorescent warning flag to increase visibility, allowing plenty of stopping distance, and using caution when maneuvering through tight areas.(17,18)
17. Stamford, B. Child Carriers: Tips for Runners, Bikers, and Hikers. The Physician and Sports Medicine, Vol. 26, No. 11, November 1998. www.physsportsmed.com/issues/1998/11nov/carriers.htm. Accessed August 14, 2001.
18. WIKE Ultralights. Bicycle Trailer Safety. www.wicycle.com/safety.htm. Accessed August 14, 2001.
Trailers with Two Wheels
Many two-wheeled trailers are available for carrying children and cargo. Width and length vary, although the majority are relatively small trailers used for carrying children. A single design "vehicle" using the specifications of one of these trailers was used for evaluation. These trailers do not track behind the bicycle well, resulting in reduced maneuverability, especially at higher speeds.
Trailers with Single Wheel
A few single-wheeled trailers are available. These tend to be relatively compact and follow the bicycle very well. Maneuverability of the bicycle is not generally affected, but stopping distances are naturally increased due to the excess weight. These trailers are less common and they have much more maneuverability than two-wheeled trailers.
Trailer Bicycles
Several models of trailer bicycles or "railercycles" are available and used by many families on roads and shared use paths. These devices consist of a single-wheel "half bike" in a child's size that can be attached to the back of a standard adult bicycle (or a tandem). These devices are relatively rare.
Segway Human Transporter
The Segway Human Transporter (HT) is a self-balancing, electric-powered transportation device (figure 6). Its footprint is not much larger than the human body's and has a handlebar and platform similar to a scooter, but with two wheels side by side. The Segway uses gyroscopes and tilt sensors to monitor the body's movements and balance the device on the single axle. When a person leans forward, the Segway HT moves forward; leaning backward causes it to move back. The Segway has no brakes; to stop the device, users simply straighten up from their leaning position. Turning is accomplished with a twisting motion on the handlebar. Because both wheels are on one axle, it can turn in place with no turning radius.(19)
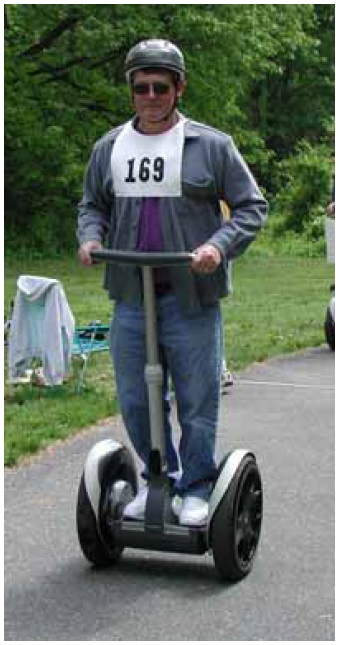
Figure 6. A Segway user.
The Segway HT easily can be governed to travel at various speeds up to a maximum of 12.5 mi/h (20 km/h).(19) The manufacturer has been actively pursuing legislation throughout the United States to allow the Segway on sidewalks and paths. In some cases, requirements for different speeds on roads and sidewalks are being considered.
19. Segway, LLC home page. www.segway.com. Accessed May 2, 2002.
Manual Wheelchairs
(Photo by Peter Axelson.)
Figure 7. Manual wheelchair.
The manual wheelchair user group are individuals who use wheelchairs that are propelled by their own muscular strength and endurance (figures 7 and 8). Manual wheelchairs have a seat between two rear wheels usually about 600 mm (24 inches) in diameter. The 75-mm to 200- mm (3- to 8-inch) front wheels swivel to allow for easy steering. Users can propel themselves using push rims attached to the rear wheels. Braking is accomplished by resisting wheel movement with the hands or arms. Alternatively, another individual can control the wheelchair using handles attached to the back of the chair.
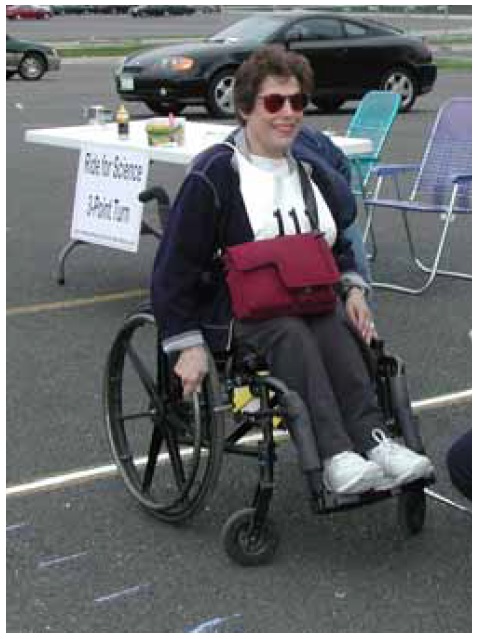
Figure 8. Another manual wheelchair.
There are two general types of manual wheelchair: standard and lightweight; their performance characteristics are significantly different. Standard wheelchairs are typically used by individuals living in institutions, those who lack the financial resources for the purchase of a lightweight model, or those who simply prefer them. Lightweight wheelchairs are often referred to as "sports chairs" or "ultralights." Their design is based on the types of wheelchairs developed by athletes with disabilities over the past 20 years. They usually feature a lighter weight frame, smaller footrests, smaller front caster wheels, lower back support only, and no arm rests in comparison to the standard models. They are also much more expensive than a standard manual wheelchair.
Power-assist wheels are devices that can be attached to either a standard or lightweight manual wheelchair. They provide propulsion via an electric motor to assist individuals with more limited arm strength who wish to travel over longer distances. A power unit with pneumatic tires and a steering tiller can also be attached to the front of a manual chair.
There are several different categories of users of manual wheelchairs ranging from those with full upper body function to those with no independent mobility. Manual wheelchair users with limited or no independent mobility are generally pushed by another person, and may be trail users too.
Power Wheelchairs
(Photo by Peter Axelson.)
Figure 9. Power wheelchair.
Power wheelchairs utilize battery power to move the wheelchair (figure 9). Power wheelchairs are expensive relative to manual wheelchairs and typically weigh up to 115 kilograms (kg) (250 pounds). They often cannot be folded or disassembled for transport, so a ramp or lift-equipped van is required. The weight and bulk of a power wheelchair severely limits the size of obstacles-usually less than 50 mm (2 inches) in height-that can be negotiated without a ramp or bevel. Braking is usually passive; it occurs with deceleration when the power is turned off. Power wheelchairs are available in many different shapes and sizes. Many different wheel sizes are available as well.
Individuals who use power wheelchairs typically have conditions that significantly limit their upper and lower body movement, strength, coordination, or endurance. Various control units are available that enable individuals to control the movement of their power wheelchair with very limited independent movements (e.g., a puff of breath).
Assistive Powered Scooters
Assistive powered scooters are three- or four-wheel devices designed to provide mobility for individuals with limited endurance for walking or using a manual wheelchair (figure 10). These scooters have a tiller for steering and a comfortable seat, usually with a back and armrests. Standup two-wheel scooters used for recreation and transportation by primarily nondisabled users were described earlier in this report and are not included in this user group.
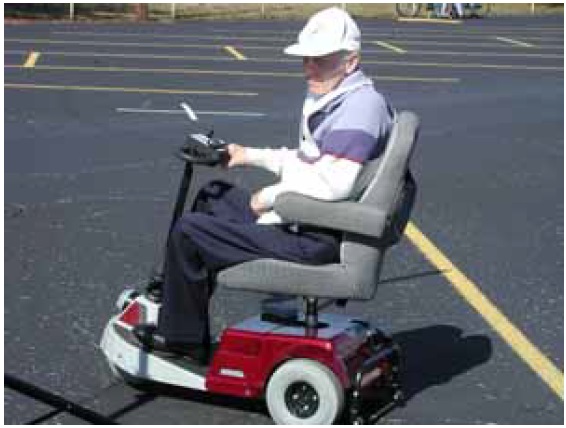
Figure 10. Assistive powered scooter.
These devices typically have a longer wheelbase than a power wheelchair, and are less expensive (costs are approximately comparable to lightweight manual wheelchairs). Power scooters rely on multiple batteries and can weigh up to 90 kg (200 pounds). Braking is provided via disk brakes or by a regenerative braking system utilizing the scooter's motor. Transportation of the scooter requires partially disassembling the scooter (to fit it into a station wagon) or the use of a van or trunk-mounted lift. The tiller steering mechanism requires the user to physically turn the steering handle left and right to turn the vehicle. This requires substantially more strength and range of motion than the typical joystick control provided on powered wheelchairs.
Adult Tricycles
Adult tricycles are primarily used by older adults but may also be used by individuals with disabilities that affect balance or coordination, but who maintain the ability to perform the pedaling and braking motions required for using a tricycle. Adult tricycles generally have a comfortable, upright sitting position and three large wheels (approximately 650 mm (26 inches) in diameter), one in front and two in back. Typically, they do not have multiple gears, which limits their use on hilly or uneven terrain. Individuals who are unable to drive often use tricycles for local transportation, such as a short trip to the store. They can also be used for recreation in a manner similar to bicycles.
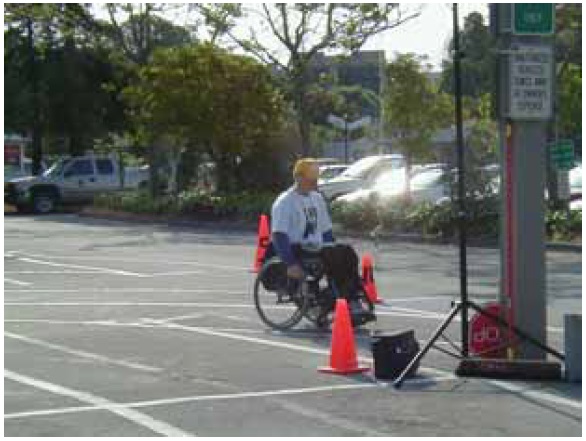
Hand Cycles (Stand-Alone)
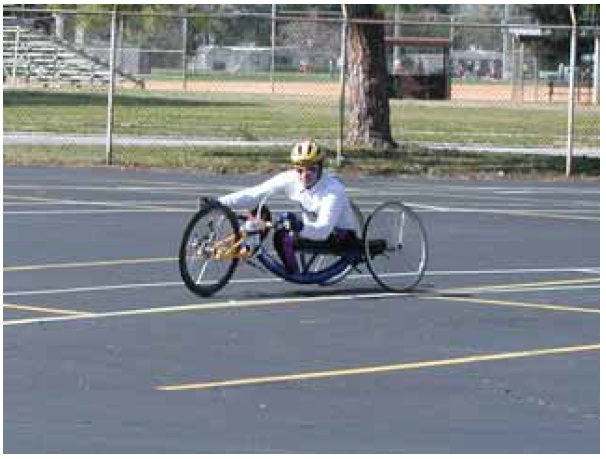
Figure 11. Hand Cycle.
On stand-alone models of hand cycles, the pedaling motion is done with the arms (figures 11 and 12). Hand cycles are available with varying wheel sizes and with the single wheel in either the front or the rear. Hand cycles are also available that are designed with only two large wheels (one front and one back). Additional support, as required, is provided by small caster wheels that are mounted on each side just behind the seat. The caster wheels do not touch the ground unless the rider leans the bicycle to one side or the other.
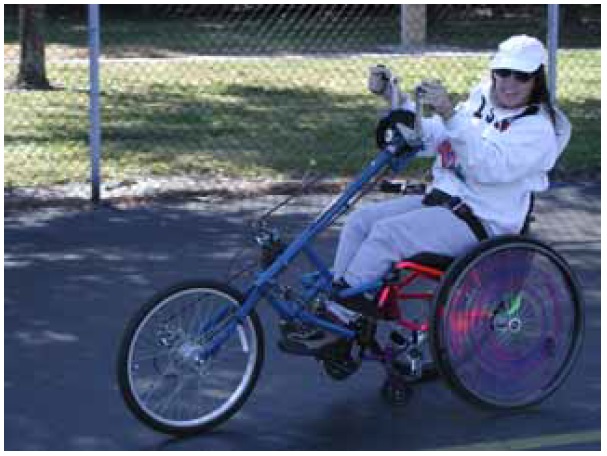
Figure 12. Another hand cycle.
Most stand-alone hand cycles have a relatively long, narrow wheelbase, which decreases the rider's turning ability and increases the risk for capsize with sudden turning movements. Standalone models may offer a wide range of gearing and braking capabilities, depending on the type of use for which they are designed.
Hand Cycle Wheelchair Attachment
Hand cycle attachments that clip onto a manual wheelchair are an example of a propulsion method. Typically, these attachments include a front wheel and arm crank mechanism and incorporate a wide range of gearing options and hand brakes. These attachments offer an arm cycling option to manual wheelchair users but they do not offer the performance of a stand-alone hand cycle model. Hand cycle attachments are typically used for transportation or utilitarian purposes because the user can use the wheelchair in its normal manner when the destination is reached (e.g., cycling to the store). Hand cycle attachments may also be used for recreational purposes, although most experienced cyclists would prefer a stand-alone model.
Racing Wheelchairs
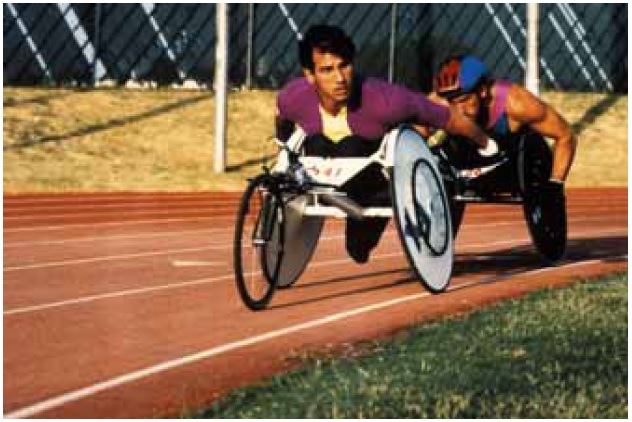
(Photo by Peter Axelson.)
Figure 13. Racing wheelchairs.
Racing wheelchairs are specially modified manual wheelchairs that are designed to maximize their performance in specific activities. They are typically used by competitive athletes for training as well as competition and may be used on road or shared use path surfaces (figure 13). Given the amount of training time dedicated to a particular activity, individuals are usually very experienced and skilled in the use of a racing wheelchair.
Road Racing Wheelchairs
Road racing wheelchairs typically have a long wheelbase and fixed (nonsteerable) front wheels. The wheels consist of two large (approximately 700 mm (27.5 inches)) rear wheels with push rims for propulsion and braking. Most chairs also have hand brakes to assist in stopping at high speeds. A steering mechanism compensates for the crown of the road so that the athlete can push equally with both arms. Racers, even during training, will usually be traveling at a relatively high speed, particularly on downhill sections. Typically, a low seating position is preferred to increase stability and decrease resistance. The low seating position also reduces the user's visibility by other road and shared use path users. Road racing wheelchairs are usually finely tuned for balance and use by one specific individual.
Off-Road Racing Wheelchairs
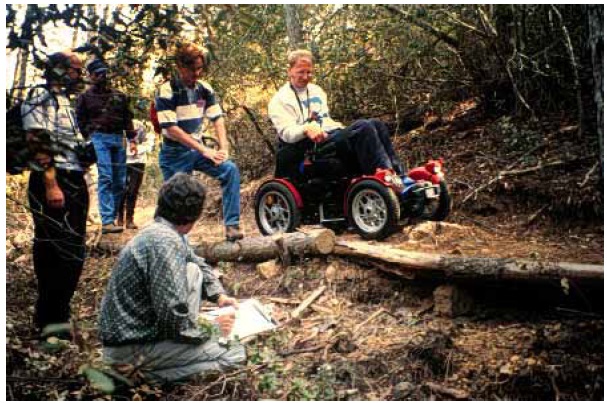
(Photo by Peter Axelson.)
Figure 14. Off-road racing wheelchair.
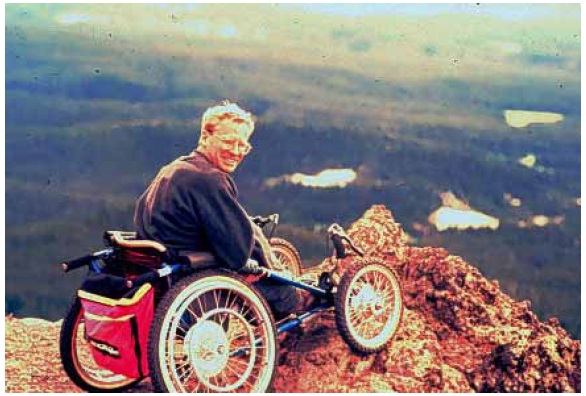
(Photo by Peter Axelson.)
Figure 15. Another off-road racing wheelchair.
Off-road racing wheelchairs typically are designed for recreational use on mountain bike or single-track trails (figures 14 and 15). They typically have all-terrain tires on four wheels with varying sizes from 400 mm to 650 mm (16 inches to 26 inches). They often utilize a more rugged frame, incorporate a suspension system, and provide four-wheel braking systems actuated by hand brake levers. If used, gearing is accomplished through multiple push rims. A long and wide wheelbase with camber on the rear wheels is used to increase stability on a variety of terrains. Although they provide much more stability and control when traveling downhill (e.g., can be driven down a flight of stairs), they can be heavy and cumbersome for movement on level ground or going uphill. These devices are used infrequently on public roads and shared use paths, and were therefore beyond the scope of this study.
Other Road and Shared Use Path Users with Disabilities
A variety of road and shared use path users who do not, at first glance, appear to influence the characteristics of road and path use: (1) individuals with partial or total vision loss (who may not use a white cane or guide animal); (2) individuals with hearing impairments or deafness; (3) individuals with cognitive limitations; and (4) people who use other mobility devices, such as walkers, canes, prostheses, and crutches. While it was beyond the scope of this study to evaluate the characteristics of these groups, it is recommended that the needs of these road and shared use path users be investigated and documented in a future study because their movement characteristics are known to differ from typical or expected patterns.
Individuals with Partial or Total Vision Loss
Individuals with vision loss usually will have independent mobility for use of roads and shared use paths as pedestrians. They often participate with another person (tandem bicycles are particularly popular for individuals with vision loss). Pedestrians with vision loss who use canes will follow edges to travel, while those who use dog guides typically use audible, tactile, and environmental cues in lieu of vision for obstacle detection and gap selection. In addition, their path of travel may be influenced by subtle changes in grade or cross slope that are not readily detected by others, or by overhead and overhanging branches, etc., and things that protrude into their travel paths.
Individuals with Hearing Impairments or Deafness
Individuals with limited hearing rely extensively on visual cues for safe and independent mobility. Unobstructed and well-lit sight lines along a facility and at intersections are needed. They may not respond as expected to the presence of auditory stimuli (e.g., the sound of approaching traffic or cyclists ringing a bell).
Individuals with Cognitive Limitations
For individuals with cognitive limitations, the additional information processing time required to acquire and understand external stimuli may significantly affect their movement and vehicle or device operational characteristics. Stopping times may be increased because of an increase in the time required to understand and interpret the stopping cue. Decisionmaking [sic] and purposeful movement may be compromised in complex situations or rapidly changing environments. The consequences of passing, acceleration, or sudden changes in movement pattern of other road and shared use path users may not be understood or considered.
Other Road and Shared Use Path Users
Although the above summary of user groups is long, other devices and vehicles are occasionally used on roads and streets that have not been listed above. A full evaluation of these devices and vehicles as part of this study was either not possible or unnecessary for one of the following reasons:
-
They are used very infrequently so a reasonable sample size could not be obtained.
-
They are so small or are used at such slow speeds that their operational characteristics are less important because roads, shared use paths, and other public ways will necessarily be designed for the critical operational characteristics of larger and/or faster users.
Although these user groups will not be described in detail, it is important to mention their existence, in the event that their use grows significantly and results in the need for evaluation as part of a future study:
-
Unicycles-Devices with a single wheel, pedals, and a seat.
-
Bicycle rickshaws and pedal carriages-Pedal vehicles with three or four wheels that are intended to carry one or more passengers in addition to the person pedaling the vehicle.
-
Electric toys for children-Small electric devices, usually with four wheels, often designed to emulate full size adult motor vehicles.
-
Child tricycles-Small, three-wheeled pedal devices used by small children.
-
Bicycles with training wheels.
-
"Low rider" bicycles- Bicycles that have been customized for aesthetics to be low to the ground and often longer than standard bicycles.
In addition, mopeds and small motorcycles (scooters) are used on roads and in some places on shared use paths. However, these vehicles have been in use on public rights-of-way for a long time and most States specifically regulate them as motorized vehicles. As regulations already exist and this study was conducted on shared use paths that are closed to these vehicles, they were not evaluated as part of this study.
SAFETY/CRASH DATA AVAILABILITY
As part of this study, potential sources of information regarding the safety of emerging road and trail users were identified. The primary data sources examined were:
-
Data from the NEISS.
-
Other hospital discharge, trauma registry, or emergency department (ED) data.
-
State motor vehicle crash databases.
-
State narrative crash data.
This section presents relevant information on each of these sources and discusses their advantages and disadvantages.
The Fatality Analysis Reporting System (FARS) contains information on motor vehicle crashes that result in a fatality to either a vehicle occupant or a nonoccupant (such as a pedestrian) within 30 days of the crash. However, the majority of crashes are not fatal and thus are not included in FARS. Moreover, FARS does not indicate whether a person was using a wheelchair, inline skates, or another emerging user device. Therefore, FARS was not considered to be a potential source of information and is not discussed in this section.
NEISS Data
NEISS was felt to be by far the most useful data source available for studying the safety of the identified emerging road and trail users. NEISS is an injury surveillance data collection system that is operated by the U.S. CPSC. It is currently based on a statistically valid sample of 100 hospital EDs nationwide. NEISS has been operational for 30 years, and recently (in 2000) expanded its scope to collect data on all injuries, rather than just those related to consumer products. Reported cases (generally between 200,000 and 300,000 a year before the recent expansion) are weighted to provide overall national estimates of injuries serious enough to require ED treatment.
Data are collected electronically at participating hospitals and immediately forwarded to CPSC. The data collection protocol includes information on the injury victim's age, gender, race, injury diagnosis, ED disposition (treated and released, or admitted to the hospital), and the locale of the accident (home, farm/ranch, street or highway, school, place of recreation or sports, etc.). While the latter does not specifically include off-road trails, communication with CPSC revealed that this information might be captured in the 144-character narrative descriptions accompanying the reports.
What makes the NEISS data especially valuable is the level of detail captured with regard to involved products. Currently, more than 900 different products can be identified. From the coding manual, it is not clear how some of the newer assistive vehicle types such as powered scooters, hand cycles, and powered wheelchairs would be identified, or how bicycle trailers are coded. Also, jogging strollers are not differentiated from conventional strollers. As in the case of location information, further detail may be available in the report narratives. Bicycle trailers have been studied retrospectively using NEISS data.(20) Additionally, if a subject was not using a device, but rather was injured by someone else using the device, that information might not be coded in the database; a review of narratives would be required to obtain this data.
NEISS data are publicly available, and CPSC has a long history of cooperation with the Centers for Disease Control and Prevention (CDC), National Highway Traffic Safety Administration (NHTSA), and other Government agencies in using the data for research purposes other than identifying potential product hazards. In addition to reports taken from the computerized database, the CPSC regularly conducts special "follow-back" studies in which it contacts the victim, the victim's parent, or a witness (usually by telephone, but sometimes involving on-site investigations) for more detailed information. Generally, these contacts can be made within a few weeks of the occurrence of the injury. This approach was used for an in-depth study of bicycle-related injuries occurring in 1991.(21)
In reviewing the literature on the safety of the various emerging road and trail users being examined in the current study, NEISS data were frequently cited.(10,22,23)
Wheelchair-related injuries and deaths may also be reported in greater detail to the Food and Drug Administration (FDA), as required under its Medical Device Reporting program (data available at http://www.fda.gov/cdrh/mdrfile.html), or as part of its voluntary MedWatch program. For example, FDA data served as the basis for a study on wheelchair safety.(23) Devices examined in this study included manual wheelchairs, powered wheelchairs, and assistive scooters.
In summary, the NEISS data appear to be an especially rich source of information on the safety of many emerging vehicle types targeted in this study. Because its basis is in hospital EDs, it incorporates data on injury events occurring on and off public roadways, and regardless of whether or not a motor vehicle was involved. The data constitute a statistically valid national sample, and CPSC has a long tradition of working cooperatively with researchers and other Government agencies interested in accessing the data. In addition, opportunities exist for further expanding the available data by incorporating follow-back telephone interviews into the data collection process.
10. Rutherford, Jr. G. W. and R. Ingle. Unpowered Scooter-Related Injuries-United States, 1998-2000. CDC MMWR Weekly, Vol. 49, No. 49, December 15, 2000, pp. 1108-1110. www.cdc.gov/mmwr/preview/mmwrhtml/mm4949a2.htm. Accessed August 10, 2001.
20. Powell E.C. and R.R. Stanz. Tykes and bikes: injuries associated with bicycle-towed child trailers and bicycle-mounted child seats. Archives of Pediatric and Adolescent Medicine Vol. 155, No. 4, 2001, p. 525.
21. Rodgers, G.E. Bicycle Use and Hazard Patterns in the United States, and Options for Injury Reduction. U.S. Consumer Product Safety Commission, Washington, DC, 1993.
22. Schieber, R.A. and C.M. Branche-Dorsey. In-line skating injuries: epidemiology and recommendations for prevention. Journal of Sports Medicine, Vol. 19, No. 6, 1995, pp. 427-432.
23. Kirby, R.L. and S.A. Ackroyd-Stolarz. Wheelchair safety-adverse reports to the United States Food and Drug Administration. American Journal of Physical Medicine and Rehabilitation, Vol. 74, No. 4, 1995, pp. 308-312.
Other Hospital-Based Sources of Data
Literally hundreds of studies in the published literature deal with skateboard and skating injuries, and a rapidly growing body of literature addresses nonmotorized and motorized scooter injuries; a few specialized studies consider bike trailers, golf carts, and racing wheelchairs. The primary source of data for these studies has been hospital ED data-either individual case series from a single hospital, or local or regional trauma registry data. Studies have involved both retrospective examination of ED records and prospective case identification, and have most often targeted a single user category (e.g., inline skate injuries in children). In addition to studies conducted here in the United States, a significant number of studies have been conducted in Australia, Great Britain, and the Scandinavian countries.
While much can be learned from these studies, they generally do not represent viable data sources for further study. The data are typically not publicly available, and often involve some level of specialized data collection. They are also relatively small-scale studies that may not be generalizable to larger populations.
An exception would be studies based on data from a population-based trauma registry, such as a State, regional (multihospital), or national registry. Trauma registries most often capture information on hospitalized patients, but in some cases collect information on those treated in the ED, as well. An example of a large, publicly available trauma registry database is the National Trauma Data Bank (NTDB), established by the American College of Surgeons in 1997 (with data extending back to 1994). As of 2001, the NTDB contained data from four State registries and from 67 hospitals in 29 States, representing all regions of the United States. Still, overall case numbers were relatively small, at slightly more than 181,000 cases (1994-1999 data).(24) Another example of a national trauma registry is the National Pediatric Trauma Registry, a voluntary system of reporting of pediatric trauma patients ages 0 to 19 years that was operational until February 2002. Although no new data are being added to the system, researchers can still access the available data, including a total of more than 43,000 submitted cases from 1994-2001.(25)
A major disadvantage of trauma registry and most other routinely collected hospital-based data is that it is not sufficiently detailed with respect to the cause of injury, and in particular the involvement of specific equipment such as inline skates, scooters, and motorized wheelchairs. Most rely on standardized E-Codes for coding the cause of injury. But while E-Codes differentiate among pedestrians and bicyclists being struck by motor vehicles on and off public roadways, they do not identify the specific equipment being used at the time, or the specific location of the user if not in the roadway. Neither is it possible to obtain this information through special follow-up studies because the identity of subjects is generally stripped from the files. Thus, existing hospital-based data sources would appear to be of limited usefulness for studying the safety characteristics of emerging road and trail users.
Such limitations could, of course, be overcome by implementing a hospital-based data collection system specifically designed to gather information on the safety of the various user groups of interest. One could also attempt to modify a data collection system or trauma registry already in place. Both are likely to be costly undertakings, especially in light of the large number of hospitals that would need to participate to generate a sufficient number of cases with respect to the "rarer" user groups, including adult tricycles, tandem bicycles, and racing wheelchairs.
24. American College of Surgeons. National Trauma Data Bank Report 2001. Chicago, IL: American College of Surgeons, 2001. www.facs.org/ntdbreport2001/summary.html.
25. National Pediatric Trauma Registry. Characteristics and Technical Highlights. Boston, MA: Tufts-New England Medical Center. www.nptr.org.
State Motor Vehicle Crash Data
State motor vehicle crash files are another potential source of information on the safety of emerging road and trail users. To determine whether States collect information on the various user groups identified, the researchers sent a brief e-mail survey (included in the appendix) to the crash form coordinator in each State. The names of the crash form coordinators and their e-mail addresses were obtained from NHTSA's Traffic Records System Inventory Web site (http://www.nhtsa.dot.gov/people/perform/trafrecords/crash/Pages/coordinators.htm). The site also provides telephone numbers and downloadable copies of State crash report forms.
Surveys were initially sent to the 40 States with available e-mail addresses. Of these 40, however, only 22 proved to be viable (i.e., deliverable) addresses, and only 15 responded. Researchers continued to follow up with nonrespondents, and also began trying to contact persons by telephone to obtain updated e-mail addresses. Eventually, researchers were able to identify e-mail addresses for all but a few States, and obtained completed surveys for 35.
The results are not especially encouraging. In response to the question about whether specific user groups could be identified on their computerized crash database, the number of "yes" responses (out of 35) is shown in table 3.
Table 3. User types that can be identified in State motor vehicle crash files.
| USER TYPE | NUMBER OF "YES" RESPONSES | STATES |
|---|---|---|
| Inline skates | 4 | NV, NY, NC, OH |
| Skateboards | 2 | NV, NC |
| Nonmotorized scooter | 0 | |
| Motorized scooter | 7 | AZ, AR, GA, KS, KY, NV, VT |
| Nonstandard bicycle | 0 | |
| Adult tricycle | 0 | |
| Hand cycle | 0 | |
| Bicycle trailer | 2 | OR, WY |
| Golf cart | 0 | |
| Wheelchair | 2 | NV, OR |
| Assistive powered scooter | 0 | |
| Racing wheelchair | 1 | OR |
Four States indicated that they could identify inline skaters (or rollerbladers), but in two of these States (Nevada and North Carolina), inline skaters were coded together with skateboards. Seven States indicated that they could identify motorized scooters; however, we believe that in most if not all of these cases, the motorized scooter that the respondent was referring to was the larger powered motorbike similar to a motorcycle, and not the small, motorized stand-on scooter that we had intended by our question. The exception may be Nevada, which indicated that it had begun collecting data on motorized scooters in November 2001. The only other special use groups identified by any of the States were bicycle trailers (two States), wheelchairs (two States), and racing wheelchairs (one State). In the case of wheelchairs, Oregon indicated that although they had been coded separately since 1998, they were not differentiated by type. This may also be the case in Nevada (i.e., Nevada may code racing wheelchairs along with regular wheelchairs). Thus, there appears to be few data available on emerging road and trail users from computerized State motor vehicle crash databases.
Anticipating this might be the case, we also asked the coordinators whether their State computerized the narrative descriptions of crashes, either full descriptions or key words, and if they did, whether this data could be electronically searched. Five States (Arkansas, Delaware (under development), North Carolina, Oregon, and Rhode Island) indicated that they did computerize some or all of their crash narratives, and three of these (North Carolina, Oregon, and Rhode Island) indicated that these data could be searched using key words to identify potentially relevant crash reports for the various identified user groups.
A final question asked respondents whether there had been any efforts in their State to use available crash data to study the safety of any of the identified emerging user groups (not including standard bicycles). Florida indicated that its department of transportation had studied inline skaters, and Vermont that pedestrians had been studied (although without reference to any of the identified user groups). In North Carolina, the crash data have been queried in response to requests from the public, but no formal studies have been carried out on any of the identified user groups. Several respondents indicated that these user groups were not felt to constitute a safety problem in their State.
As a side task, we searched the North Carolina crash data to identify all crashes in which "Person Type" was coded as "roller skater, roller blader, etc." Over a period of approximately 2.5 years (2000, 2001, and through about August 2002), only 17 such cases were coded.
However, it was clear that the coding was not entirely accurate, since when we examined the hard copies of the crash reports for these cases, 9 of the 17 did not appear to involve skaters. In addition, there were cases that we had identified from our narrative search (see following section) that should have been coded in this category but were not. This admittedly limited pilot effort suggests that routinely coded crash data may not be the most complete or reliable source of information on emerging road users.
Based on these results, it does not appear that State motor vehicle crash databases are especially useful sources of information on the safety of the emerging road and trail users that are the focus of the current study. Although this is primarily because only a few States are collecting data on only a few of the user categories, it is also because the data that are collected are limited almost entirely to crashes involving motor vehicles and occurring on public roadways. Recognizing these limitations, it may still be useful to pool available information from selected States to study the characteristics of, for example, crashes involving inline skaters or skateboard users. While sample sizes are likely to be too small for a statistical analysis of the data, the identified crash reports could be accessed and reviewed as a case series to identify potentially important characteristics, such as involved age groups and factors contributing to the crash.
State Narrative Crash Data
As noted above, at least three States-Oregon, Rhode Island, and North Carolina-computerize some or all of the narrative descriptions contained on their crash reports, and are able to conduct key word searches of these data. Theoretically, at least, this should make it possible to identify crashes involving any road user group desired, regardless of whether they are coded elsewhere on the form. In practice, narrative searches always underestimate the occurrence of a particular crash type, because (1) officers do not always report the information, (2) if they do report the information, they may use words, or spellings of words, that do not coincide with any of the key search terms chosen, and/or (3) there may be omissions or other errors in entering the narrative data into the computerized database. For example, an officer may fail to notice that a child struck by a car was riding a scooter at the time, or may refer to the scooter in his report as a "push bike" or "skooter."
In North Carolina, narrative searches have been used to study a wide array of topics that otherwise could not have been studied from the computerized crash data alone. Examples include post-crash fires, deer crashes, cellular phone use and crashes, driver distractions, billboards, hydroplaning in wet weather crashes, and road debris as a causative factor in crashes. To explore the potential usefulness of narrative searches for identifying crashes involving emerging road and trail users, we used the following search words to identify crashes potentially involving inline skates, roller blades, or skateboards: inline, skate, roller, blade. This list generated 43 narratives for crashes occurring between January and some time in August 2002. However, upon reading the printed narratives, many of these were found to be false hits: for example, reference to a roller tape used in taking measurements, an asphalt roller used in road repair, or a snow plow blade. Eight narratives were true "hits." Examples of these appear below:
"Vehicle 1 made a right turn onto Hillburn Street from Chapel Road. Pedestrian child was rollerblading across Hillburn Street. Driver 1 stated that child skated from his blind spot directly in front of vehicle. Driver 1 stated he did not see the child until the collision."
"After interviewing witnesses and subjects involved it was determined that ped was roller blading in roadway and attempted to cross roadway making contact with the vehicle 2 on the front left quarter panel and then rolling up onto the windshield and was thrown off the front into the roadway."
"Driver Vehicle 1 stated he had just about passed the child on a skateboard when the child moved back into the street and hit [his truck]."
"Driver of Vehicle 1 stated she was going straight ahead and the child was riding a skateboard and came out of side street and struck her vehicle. Pedestrian's mother stated that her son told her he couldn't stop in time and struck vehicle 1 in the side."
While these are only a few example cases, they illustrate how narrative searches can be used to identify crashes of interest that otherwise might go undetected on the computerized crash database.
In addition to underestimating the occurrence of a particular type crash, data resulting from computerized narrative searches will suffer from the same limitations as the computerized report data, namely, a restriction to crashes involving motor vehicles and occurring on public roadways. This data source is again likely to be most useful when used as a basis for a case series study to provide guidance to a larger data collection and analysis activity.
Summary
In summary, a variety of data sources were examined for their potential for providing information on the safety of the emerging road and trail users that are the focus of this FHWA study. While there are advantages and disadvantages to each of the sources, the data available through the NEISS system operated by the CPSC appears to present the greatest advantages (see table 4). It is recommended that FHWA, NHTSA, and the CDC jointly sponsor a study using NEISS data and incorporating follow-back telephone interviews to gather comparative data on the crashes and injuries associated with these various user groups.
Table 4. Summary of advantages and disadvantages to the data sources reviewed.
| DATA SOURCE | ADVANTAGES | DISADVANTAGES |
|---|---|---|
| NEISS | Nationally representative data. Publicly available. Ongoing, routine data collection. Current data. All types crashes, all locations. Special studies option. Relatively inexpensive. | Some limitations on data items routinely coded (e.g., insufficient detail on location of injury event, user experience). |
| Other Hospital-Based Data | Good for studying specific populations and specific problems. Many excellent studies already conducted. | Generally not representative sample of cases (except in larger trauma registries). Can be expensive. Data may not be publicly available. No opportunities to "customize" data collection elements; may not include desired data items. |
| Computerized Crash Data | Potentially large number of cases, at no additional cost. | Specific user categories generally not identified. |
| Wealth of additional crash event information available for analysis. | Limited to injuries resulting from collisions with motor vehicles on public roadways. | |
| Computerized Crash Narratives | Viable alternative for accessing relevant crash reports when user groups are not routinely coded. Provides case series descriptive data to help guide future research. | Few States maintain searchable narrative databases. Will underreport number of events. Limited to injuries resulting from collisions with motor vehicles on public roadways. |
FIELD DATA COLLECTION PLAN
This study evaluated the following characteristics of emerging road and trail users:
-
Physical dimensions: length, width, height, eye height, wheelbase, wheel spacing, wheel diameter, tire/wheel width, tire type.
-
Space required for three-point turn.
-
Lateral operating space (sweep width).
-
Turning radii.
-
Acceleration capabilities.
-
Speed.
-
Stopping sight distance: perception / reaction (time) and braking distance.
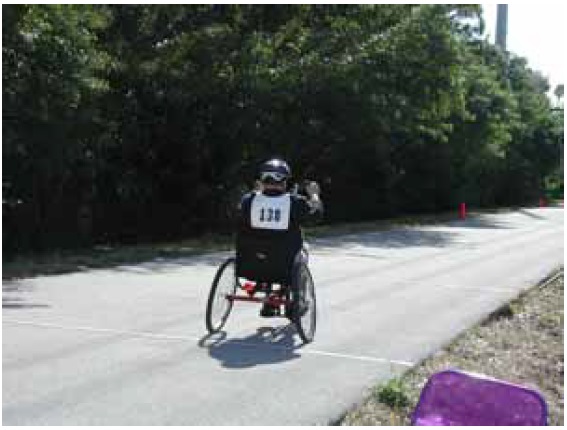
Figure 16. Pinellas Trail, St. Petersburg, FL.
Data were collected at three data collection ("Ride for Science") events held in 2003: Pinellas Trail in St. Petersburg, FL (January 25, 2003); Paint Branch Trail in College Park, MD (May 3, 2003); and San Lorenzo River Trail in Santa Cruz, CA (June 13, 2003) (figures 16-18).
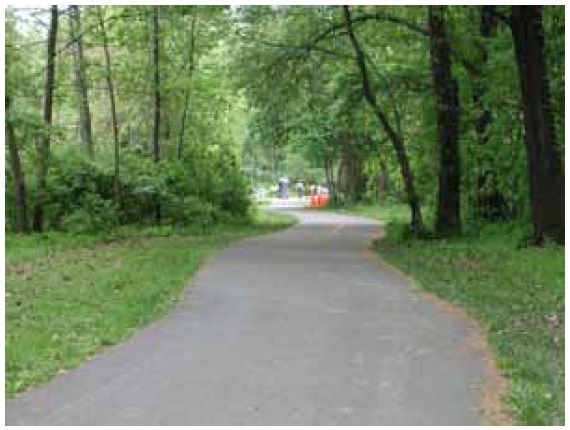
Figure 17. Paint Branch Trail, College Park, MD.
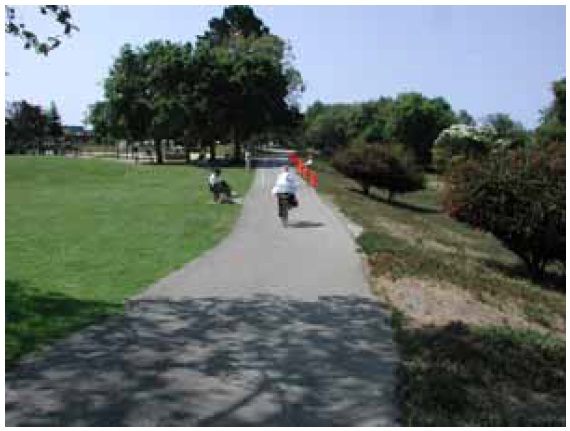
Figure 18. San Lorenzo River Trail, Santa Cruz, CA
In addition to being geographically dispersed, the event sites met several other criteria including:
-
Portions of the trails functioned at unconstrained levels of operation.
-
The trails were relatively flat and the observation stations were not influenced by grades.
-
There was sufficient space along the sides of the trails to set up observation stations.
-
The trails were within metropolitan areas.
-
The event sites were located adjacent to large, flat, smooth paved surfaces that could accommodate the turning radius station.
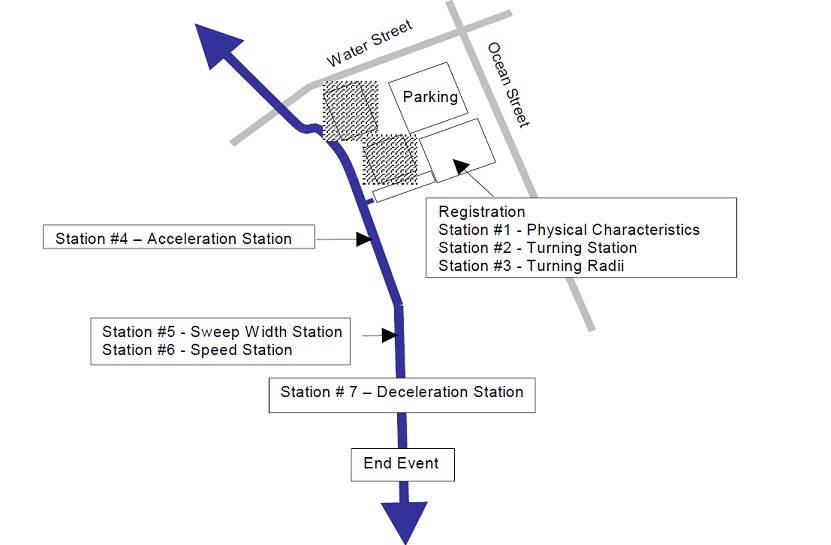
Figure 19. Typical layout of data collection stations (San Lorenzo River Trail).
Data were collected by observing trail users at seven stations (figure 19). The trail users consisted of both active and in situ (passive) participants (figure 20). Active participants were those who either were intercepted on the shared use path (via event signage; see figure 21) or responded to the public outreach program and specifically traveled to the location to actively participate in the data collection event. They were recruited through contacts with mode specific clubs (inline skaters, skateboarders, Segway users), seniors' centers, and schools. Flyers were placed in sporting goods stores and parks. Advocacy groups for disabled individuals were also contacted. Active participants registered with the data collection team and generally progressed through all the data collection stations. In situ participants were those who were on the shared use path just "passing through" the event stations. Thus, at all seven stations, data were collected from active participants. At two stations, speed and lateral operating space, data were also collected on in situ participants.
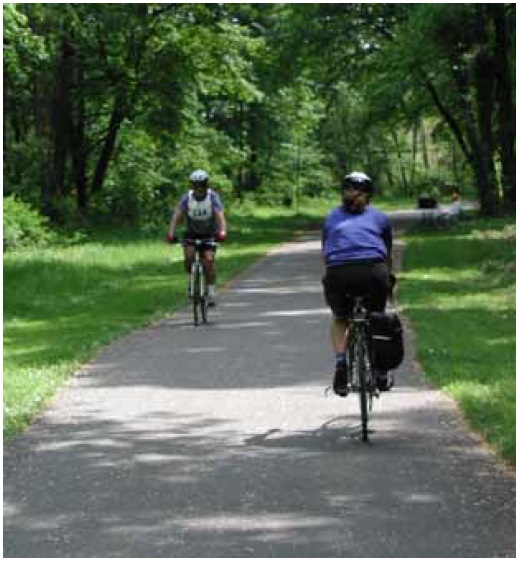
Figure 20. Trail users consisted of both active and in situ participants
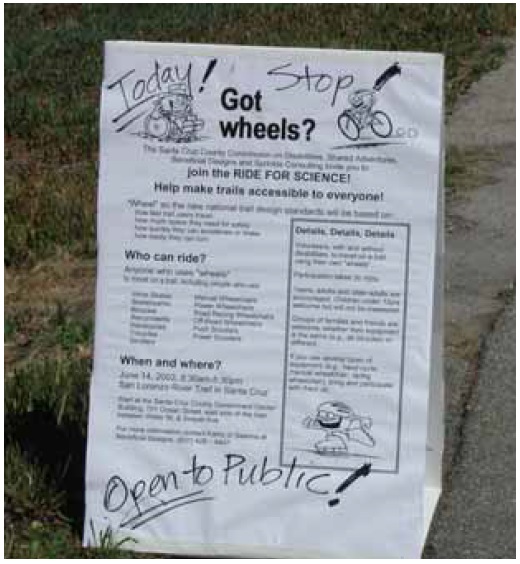
Figure 21. Trail user intercept signage.
A total of 551 in situ participants and 260 active participants were observed at the three events (table 5) for a total of 811 participants.
Table 5. Active and in situ participants at each event.
| CALIFORNIA | FLORIDA | MARYLAND | TOTAL | |
|---|---|---|---|---|
| Active | 95 | 81 | 84 | 260 |
| In situ | 193 | 210 | 148 | 551 |
| Total | 288 | 291 | 232 | 811 |
Age and gender were obtained for many of the active participants. The ages ranged from 5 to 88, and the breakdown by equipment type is shown in table 6.
Table 6. Gender distribution and ages of active participants.
| USER TYPE | N (by gender) | MALE | FEMALE | N (by age) | MEAN AGE (years) |
|---|---|---|---|---|---|
| Bicycle | 115 | 57% | 43% | 114 | 39 |
| Hand cycle | 21 | 52% | 48% | 20 | 33 |
| Inline skates | 20 | 65% | 35% | 21 | 37 |
| Kick scooter | 7 | 43% | 57% | 7 | 25 |
| Manual wheelchair | 7 | 86% | 14% | 7 | 46 |
| Power wheelchair | 5 | 80% | 20% | 6 | 48 |
| Recumbent bicycle | 6 | 100% | 0% | 5 | 52 |
| Other | 8 | 50% | 50% | 8 | 36 |
The physical characteristics (Station 1) and three-point turn widths (Station 2) were measured using tape measures. Synchronized video cameras were set up to record participant movements at the other stations (figure 22). Several types of video logging, including digital video, were employed to capture and document the operational characteristics of emerging road and trail users and their safety. The accurate and precise video documentation of the user groups was essential to the success of this study. As technology has advanced, digital data collection equipment has become more economical and productive. Thus digital technology was used at all stations to ensure optimized precise viewing, timing, and subsequently convenient downloading of data. Highly specialized audio-visual staff was directed by the Assistant Principal Investigator to provide the technical setup, supervision, and maintenance of the video-based stations to ensure maximum efficiency. This decreased the margins for error, assuring a complete one-time setup (after the pilot testing, of course).
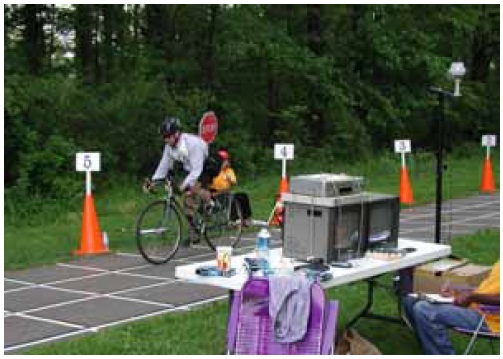
Figure 22. Video cameras were setup to record participant movements at Stations 3 through 7.
Another important consideration in planning data collection was the methodology employed at each survey data station. Each station was preliminarily designed and extensively pilot tested, considering any earlier research and developing several options for data collection techniques (figure 23). During the subsequent data reduction and analysis portions of the study, because all data had been collected digitally, the data could be computer interfaced to streamline the data reduction and analysis times.
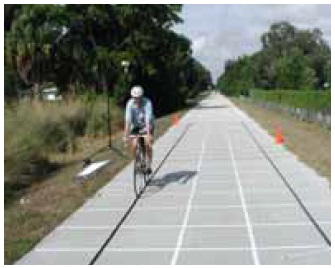
Figure 23. Equipment testing at data collection stations.
a. Bicyclist riding through acceleration station.
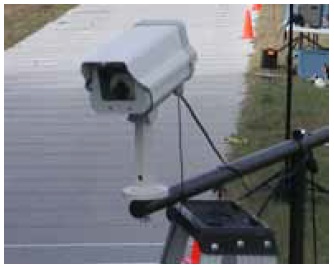
Figure 23. Equipment testing at data collection stations.
b. Video camera.
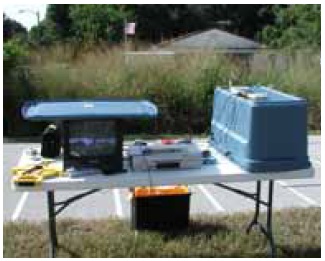
Figure 23. Equipment testing at data collection stations.
c. Video camera recorder and video monitor.
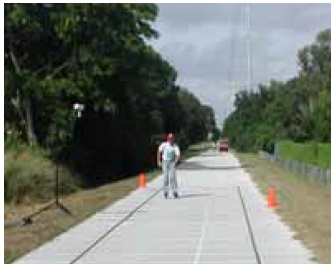
Figure 23. Equipment testing at data collection stations.
d. Inline skater traveling through acceleration station.
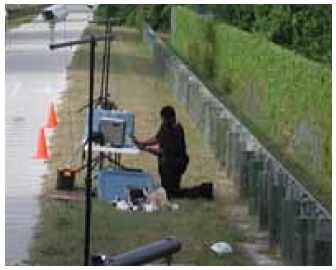
Figure 23. Equipment testing at data collection stations.
e. Event staff checks equipment.
A precursor to determining equipment needs was an understanding of the objective (operational consideration) of each station, the station's unique data objectives, and, ultimately, the design application of the information. Accordingly, the survey station designs, data collection, and analysis was planned in a comprehensive manner so that future facilities design can be done more accurately and that the safety of road and trail users will be enhanced.
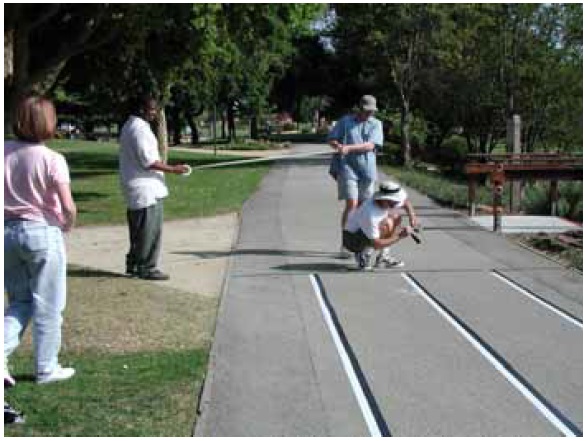
Figure 24. Temporary pavement markings were tested.
This applications-focused backdrop helped determine the specific equipment used at each station. Each station also required extensive pilot testing and technical analysis of equipment options from the video recording media to the quad synchronization communication devices. Various temporary pavement markings (for data reduction reference) were tested to maximize data reduction accuracy while minimizing effects to normal trail operations (figure 24). Following each data collection event, the videotapes were converted to digital format and subsequently viewed to reduce the data and determine operational characteristics, as described below for each of the seven stations.
Registration desks were established for each data collection event (figure 25). Participants who responded to the outreach campaigns or trail intercept signage signed in and were given a briefing on the purpose of the study, an overview of the event and course, and safety provisions.
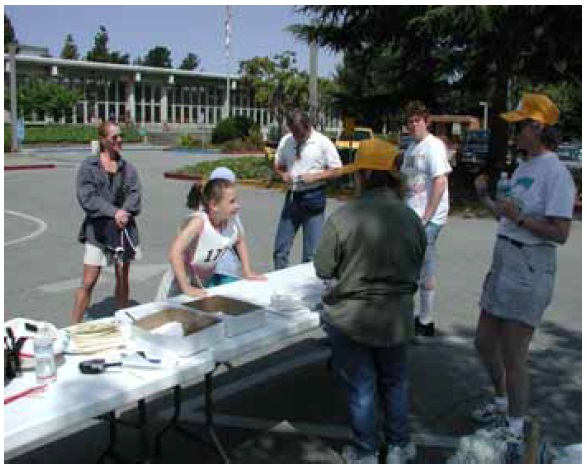
Figure 25. Registration desk.
Station 1-Physical Characteristics
At the first station, the physical characteristics of active participants and their equipment were measured (figure 26). These included:
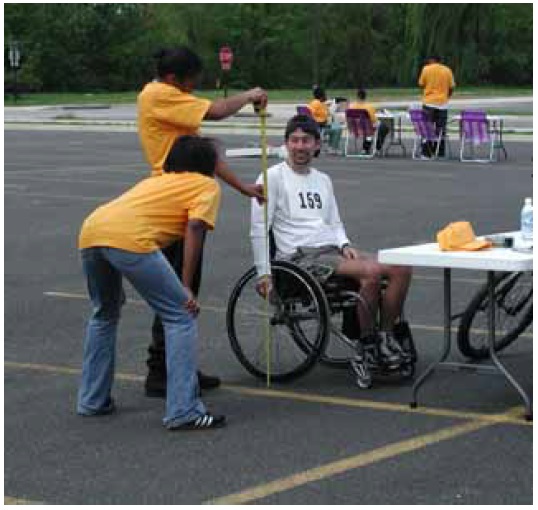
Figure 26. Physical measurements.
a. Physical measurements of a wheelchair and rider.
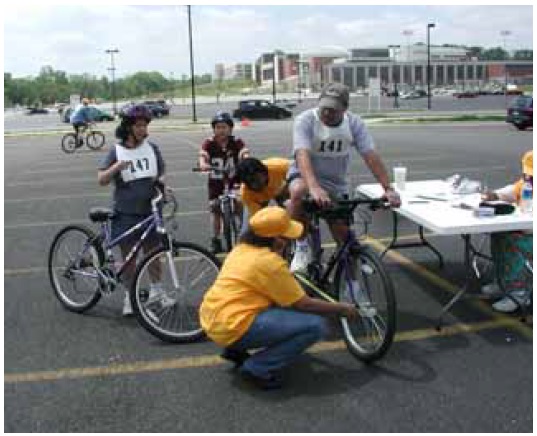
Figure 26. Physical measurements.
b. Physical measurements of a bicycle and rider.
-
Length-measured parallel to the direction of travel, including the user's body, if applicable.
-
Width-measured perpendicular to the direction of travel, including the user's body if it extends beyond the device or vehicle.
-
Height-measured from the ground to the highest point on the device or vehicle or the top of the user's head, whichever is higher.
-
Eye height-measured from the ground to the user's eye location.
-
Wheelbase-measured between the front axle and the rear axle of the device or vehicle.
-
Wheel spacing-measured from the center of one outside wheel to the center of the other outside wheel.
-
Wheel diameter-measured vertically from the point of contact with the ground to the highest point on the wheel.
-
Tire or wheel width.
-
Tire type (pneumatic, polyurethane, solid rubber, etc.)
These physical dimensions can be used by practitioners to provide an assessment of users' operational characteristics and facility design features that are critical to some user groups. For example, pavement condition requirements for a user group depend on the size and type of wheels and tires of the device or vehicle. Large-wheeled vehicles and devices like bicycles and jogging strollers can be used on a variety of pavements. Small-wheeled devices like skateboards, inline skates, and kick scooters are nearly impossible to use on unpaved surfaces and can be uncomfortable and difficult to operate on rough pavements such as chip seal and asphalt with large aggregate. Similarly, pavement condition is a factor in wheelchair travel. Manual and powered wheelchairs that are built to optimize indoor maneuvering will not be as usable in the outdoor environment.
For motorized scooters, wheelchairs, and other assistive devices, the critical measurement is width, which is necessary to determine the minimum clear width for passage. Section 4.2.1 of the ADAAG requires a minimum clear width of 815 mm (32 inches) at a point, and 915 mm (36 inches) continuously, for single wheelchair passage. In addition, Section 4.2.2 of the ADAAG requires that the minimum width for two wheelchairs to pass is 1525 mm (60 inches).
Maneuvering around a turn requires additional space for wheeled devices. Where bollards, fences, gates, or turnstiles restrict access to shared use paths, users may have difficulty getting their devices through the restricted area. The results of this research will help provide facility designers with the information needed to design for both accessibility and safe operation.
Station 2-Three-Point Turn
A three-point turn is defined as a maneuver where the user starts at one edge of the shared use path, makes a forward turn toward the other side of the path, backs up while turning the device or vehicle in the other direction, and then makes a forward turn in the original direction to complete the 180-degree turn. Designers can use this information to select shared use path widths and, if necessary, build wider turnaround areas, so that users can execute U-turns within the confines of the path. To make a U-turn, bicyclists can dismount, pick up their bikes, turn them around, get back on, and ride off in the desired direction. This is often not possible for people with mobility impairments, or other users. Instead, they must be able to turn around in their manual or powered wheelchair, hand cycle, or other device within the confines of the traveled way. However, the turning radius of these devices can make it difficult or impossible for a user to make a U-turn on a narrow shared use path. For example, it was discovered in this research that a hand cyclist can require 4.5 m to 6 m (15 ft to 20 ft) to make a U-turn. In these situations, a multipoint turn is necessary.
At this station, active participants were asked to make a three-point turn and the width that they required was measured (figure 27).
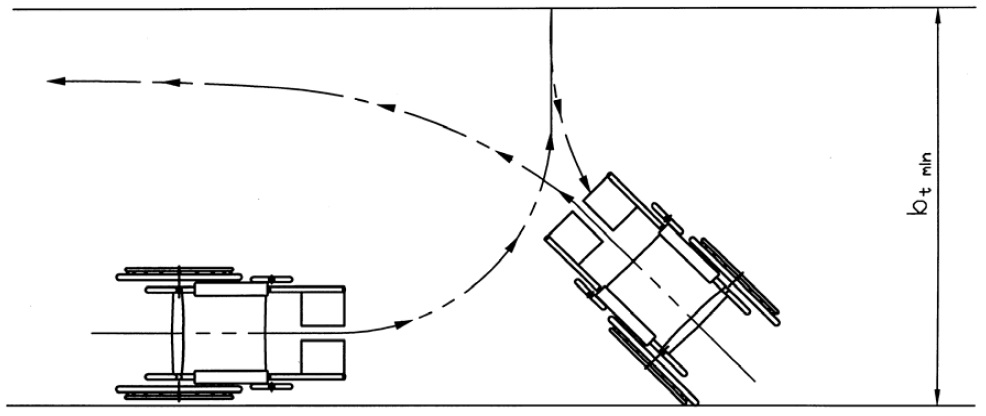
(Illustration by Peter Axelson.)
Figure 27. Three-point turn.
Station 3-Turning Radii
Typical turning radii are critical in determining the horizontal alignment of roads and shared use paths. A bicyclist leans inward (toward the center of a curve) and is likely to slow down while rounding the curve so that he/she does not fall outward due to centrifugal force. The extent of the lean, as measured from the perpendicular, is the lean angle. As the turning radius increases, the bicyclist does not have to lean as much to overcome centrifugal force, holding speed constant. Alternatively, a higher turning radius means that the bicyclist can maintain the same lean angle and travel around the curve at a faster speed. For bicycles, AASHTO (p. 38) recommends a minimum radius of 12 m (36 ft) for a design speed of 20 km/h (12 mi/h), increasing to a minimum radius of 74 m (225 ft) for a design speed of 50 km/h (30 mi/h).(2) This recommendation is based on a 15-degree lean angle.
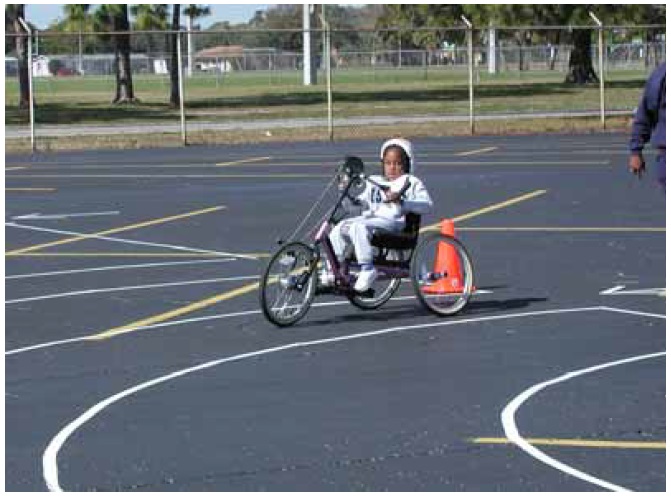
Figure 28. Participant within turning radii station.
Only active participants were used for the turning radius measurements. Turning paths with predetermined radii were delineated in a large paved area (figures 28 and 29).
Careful briefing was done to ensure that participants understood the testing procedure (figure 30).
Several research staff oversaw the stations at the various events to ensure proper participant flow-through (figure 31). The participants traveled through the largest radius path first (figure 32). They repeated the process on paths with progressively smaller radii (figure 33). The multiple-synchronized cameras enabled multiperspective time-stamped videoing of active participants as they went through each radius. The composite video was subsequently viewed to determine the times that participants entered and exited each radius. The data entry spreadsheet was set up to calculate the average speeds, based on these recorded times, as participants traveled through each radius.
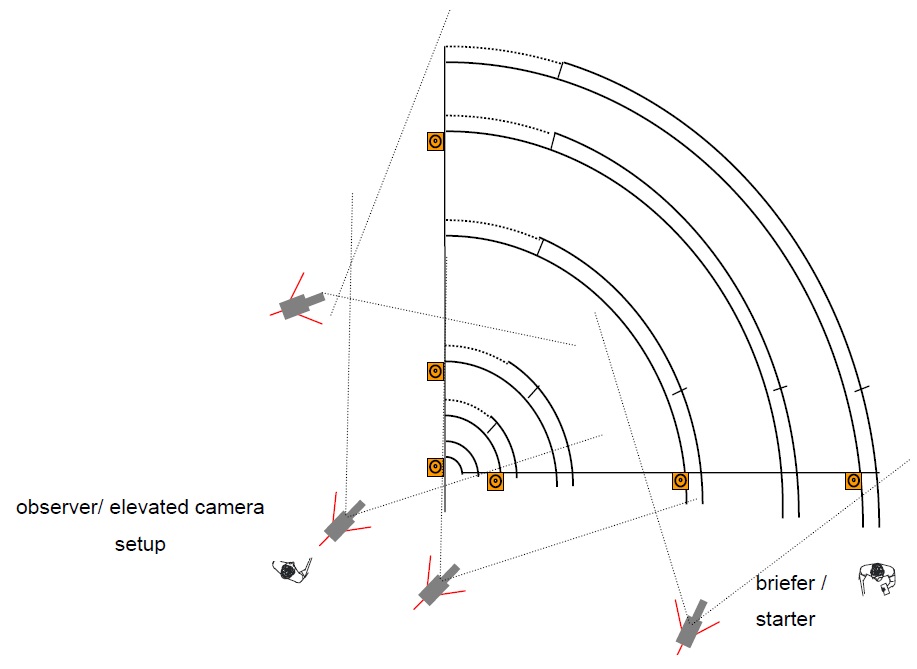
Figure 29. Turning radius layout (not to scale).
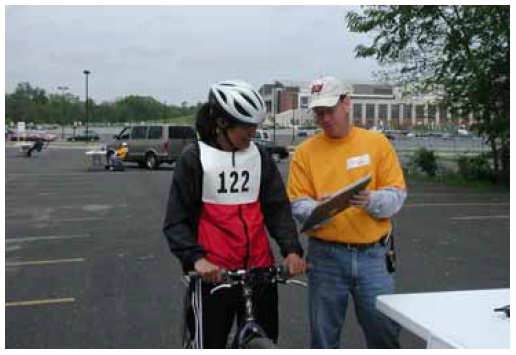
Figure 30. The participants were briefed at the turning radius station.
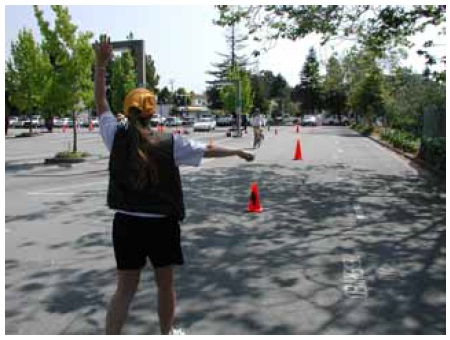
Figure 31. Research staff oversaw the turning radius station to ensure proper participant flow-through.
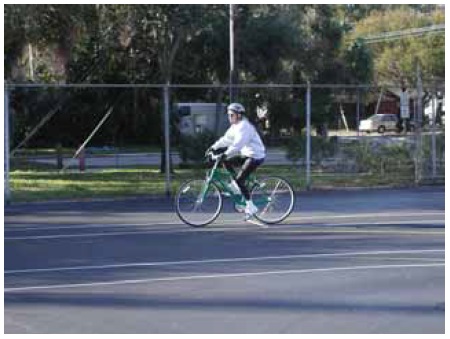
Figure 32. A participant traveling through the largest radius path.
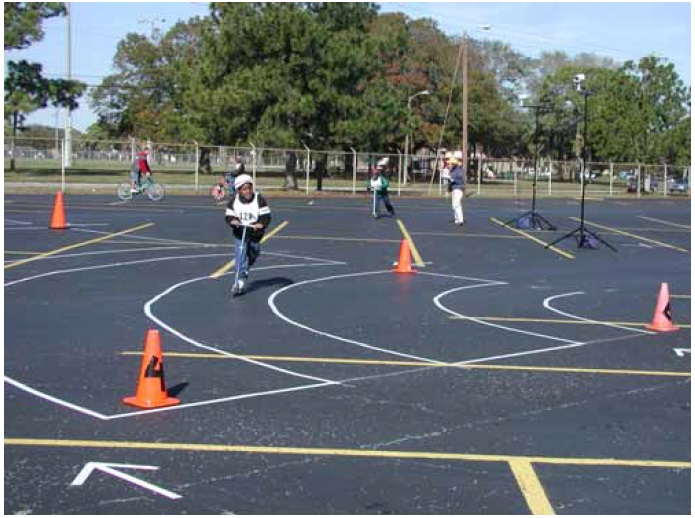
Figure 33. Participants traveling through progressively smaller turning radii.
2. American Association of State Highway and Transportation Officials. Guide for the Development of Bicycle Facilities. American Association of State Highway and Transportation Officials, Washington, DC, 1999.
Station 4-Acceleration
The acceleration rate is defined as the time that it takes for a user to accelerate from a stopped position to a normal cruising speed. Practitioners use acceleration rates to calculate gap acceptance and the necessary intersection sight distance. This is especially important at intersections of shared use paths and roadways where path users are stopped and waiting to cross the roadway. Path users must correctly judge whether gaps in oncoming traffic provide sufficient time to cross the roadway safely, based on the speed of oncoming motor vehicles, their own acceleration capabilities, and the width of the roadway to be crossed.
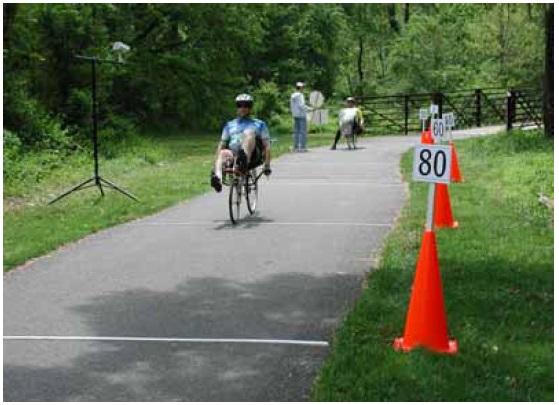
Figure 34. Participants accelerated along a 60-m (200-ft) section of the course.
Acceleration capabilities were measured for active participants. The acceleration data were collected using time-stamped video to determine the elapsed time for the participants accelerating along a 61-m (200-ft) section of the course (figure 34). This section was further subdivided into lines at 12.2-m (40-ft) spacings. Participants were asked to accelerate to their normal running speed (figures 35 and 36). The time when each participant crossed each transverse line was recorded.
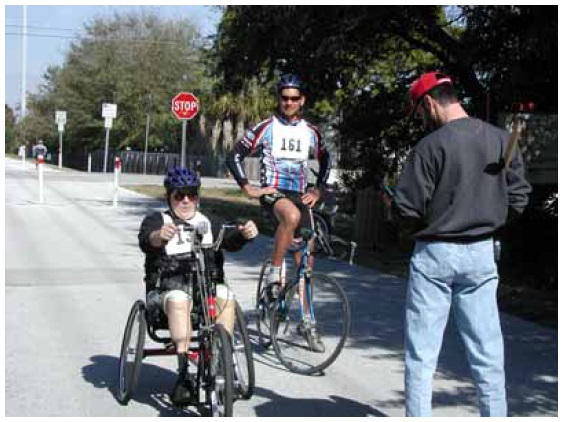
Figure 35. Participants were asked to accelerate to their normal speed.
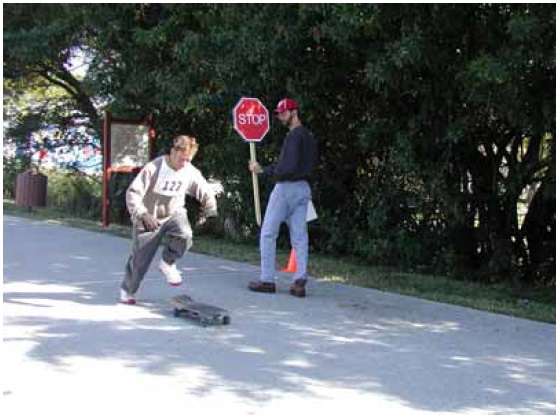
Figure 36. A skateboarder starting to accelerate.
Station 5-Lateral Operating Space (Sweep Width)
Space requirements of transportation users are one of the essential inputs in facility design, particularly in determining cross-sectional dimension needs of facilities. The Highway Capacity Manual(26) outlines the levels of service for shared use paths from the perspective of bicyclists, keying on the calculation of passing hindrance,(27) an operational condition affected by relative speed differentials, acceleration rates, and physical space requirements among bicyclists and pedestrians. The proportion of inline skating and other emerging transportation and recreational modes is rapidly increasing on our Nation's shared path facilities. Thus, over time, if the trend continues, the approach of using only bicyclist and pedestrian user groups, as outlined in chapter 11 and 19 of the 2000 Highway Capacity Manual (HCM), to determine a shared use path's level of service (hence design width) may result in under-designed or undersized transportation facilities.
User densities within a transportation facility can often influence the space occupied by the various emerging users (Fruin, as referenced in the HCM 2000). For example, for inline skaters and perhaps scooter operators, as the operating conditions become congested, people's freedom to maneuver becomes constrained and speeds decrease, and the operational space occupied by the user may decrease. Accordingly, researchers focused the survey design, hence data collection, of space dimensions to actual occupied horizontal and vertical dimensions of users operating within uncrowded pathway operating sections of the shared use paths.
Lateral operating space (or "sweep width") is the width needed by the user to operate in a safe manner under normal conditions. In general, this width is much greater than the measured width of the user in a stopped position. This is especially the case for inline skaters. A person who swerves left and right (such as an inline skater) will occupy more lateral space, and have a wider sweep width, than a person whose movements are parallel to the edges of the trail (such as a bicyclist). Both the tread and max values of sweep width were recorded. The tread is the width of the contact(s) with the ground. For example, the tread of a bicycle is the width of its tires. The tread of a wheelchair is the width from the outer edge of the left tire to the outer edge of the right tire. The max includes the width of the user. For example, a young child bicyclist will have a narrower max than an overweight adult bicyclist. The tread and max values also vary with the path that the participants follow while traveling through this station. A person has wider tread and max values if he/she travels diagonally from the left edge to the right edge of the trail than if he/she travels straight down the middle, parallel to the edges of the trail. Determining the lateral operating space of each user group at varying speeds is important for determining appropriate shared use path widths, given knowledge of trail user volumes and application of the level of service methodologies in the Highway Capacity Manual as calibrated in FHWA's recent "Operation of Shared Use Paths" study.
At each event, a section of trail was marked with longitudinal lines (figures 37 and 38). Both active and in situ participants were videotaped as they traveled through this section. The video was subsequently reviewed to determine the tread and max values for each participant.
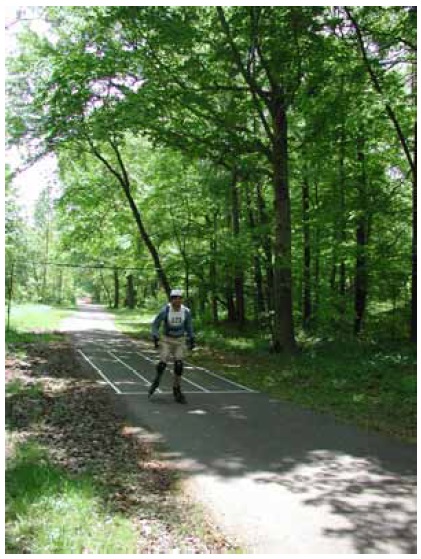
Figure 37. Sweep widths station.
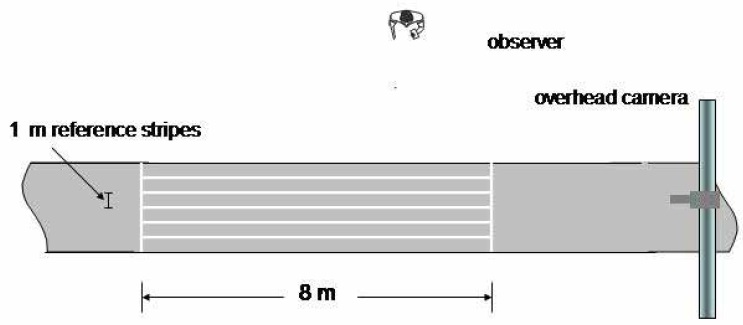
Figure 38. Sweep width and speed.
26. Transportation Research Board. Highway Capacity Manual 2000. Transportation Research Board, National Academy of Sciences, Washington, DC, 2000.
27. Botma, H. Method to Determine Levels of Service for Bicycle Paths and Pedestrian-Bicycle Paths. Transportation Research Record 743, 1995, pp. 30-37.
Station 6-Speed
Speed is defined as the normal cruising speed of users on a flat, smooth section of a shared use path. The speed characteristics of emerging road and trail users are generally influenced by age, gender, experience, weather and pavement conditions, operating conditions, and facility geometrics.(8) Practitioners can use typical cruising speeds to develop design speeds for each user group. Design speed is critical in determining horizontal and vertical alignments. Speed is also used in calculating necessary sight distances.
Time-stamped video was obtained of both active and in situ participants as they traversed the section of trail marked with lateral lines within Station 5 (figure 39). The video was subsequently reviewed to determine the times that participants crossed each of the two lines. The data entry spreadsheet was set up to calculate the average speeds based on these recorded times.
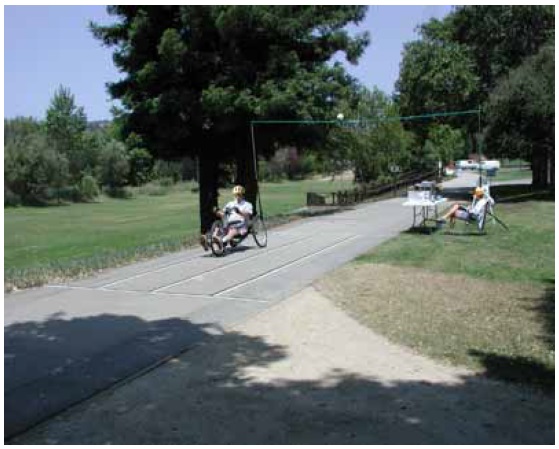
Figure 39. Speed (and sweep width) station.
8. Birriel, E., J.C. Pernia, J.J. Lu, and T.A. Petritsch. The Operational Characteristics of Inline Skaters. University of South Florida, Tampa, FL, January 2001.
Station 7-Stopping Sight Distance (Deceleration)
Stopping sight distance is the total distance traversed by a user between the point where he/she recognizes the existence of an object or situation that requires a stop and the point where he/she has come to a safe stop. This is perhaps one of the most widely used user characteristics in the design of transportation facilities. Stopping distance is based on two components: the distance traveled by the user during his/her perception and reaction time plus the distance required to physically brake to a stop. Accordingly, the stopping distance station was designed to capture both characteristics. The first, the distance traveled during the users' perception and reaction time, was captured with a digital video log similar to the physical setup of the speed studies. Subjects were videoed (from multiple camera positions, see figure 40) within a segment of the shared path. The duration (using a synchronized time display on the video frames) and distance traveled from the "stop" signaling for our downstream-positioned staff to the users' physical commencement of braking was captured on synchronized videos and later reduced by analysis of the video logs. This approach was different from that used by Birriel et al.(8) and Brown,(28) who documented only the braking component of the stopping distance action.
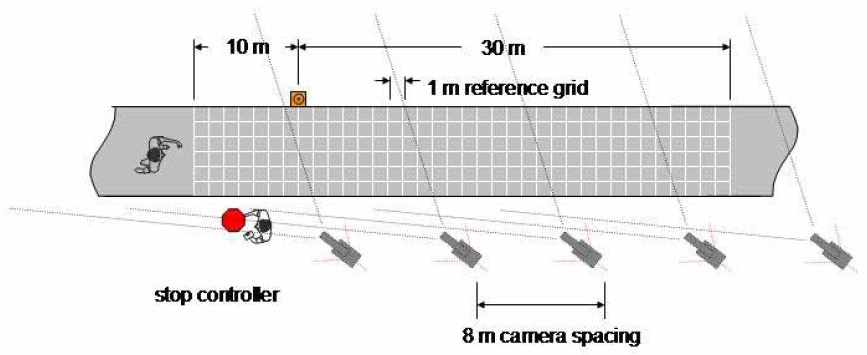
Figure 40: Graphic. Stopping sight distance.
The research team surveyed the second component of stopping sight distance, the actual braking distance, in the following manner. As shown in figure 41, several video cameras were positioned at strategic points around the braking test area. This portion of the camera setup was similar to the methods pioneered by Birriel et al.(8) Data reduction and calculations were done in a similar fashion to that for the perception-reaction component.
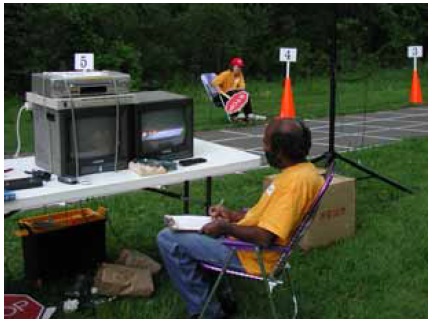
Figure 41. Several video cameras were positioned at strategic points around the braking area.
AASHTO defines stopping sight distance as:
where: d = stopping sight distance
t = brake reaction time, seconds
V = design speed, km/h
a = deceleration rate, m/sec2 (29)
The first term in the above equation is the distance traveled during the user's brake reaction time.
AASHTO uses a brake reaction time of 2.5 seconds for bicyclists.(2) It is entirely possible that other user groups have different brake reaction times. Of course some variation in brake reaction times is likely among the individuals within each user group. The second term in the equation is the braking distance, defined as the distance traveled once the user applies the brakes and before he/she comes to a stop.
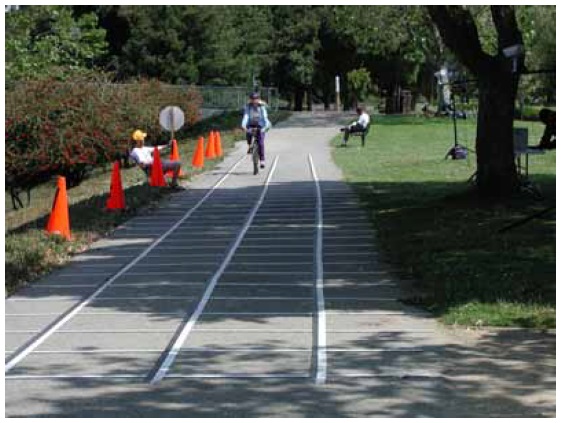
Figure 42: Photo. STOP sign controller signaling a bicyclist to stop.
Only active participants were used for stopping sight distance. During the registration briefing, participants were told that at some point along the course they may be presented with a STOP sign, and if so, they were to stop as "quickly as is comfortable." There were several points along the shared use path where the pavement was marked with a 1 m reference grid on the approach to a "dummy" STOP sign controller. This was done to minimize the participants' anticipation of where the stopping maneuver was to occur. The layout of the actual stopping station is shown in figure 40. An orange cone was placed 30 m (100 ft) in advance of the STOP sign controller to mark the AASHTO stopping sight distance for a bicyclist traveling at 30 km/h (20 mi/h). At various points before the participant reached the cone, the STOP sign controller signaled for the participants to initiate their stop (figure 42).
2. American Association of State Highway and Transportation Officials. Guide for the Development of Bicycle Facilities. American Association of State Highway and Transportation Officials, Washington, DC, 1999.
8. Birriel, E., J.C. Pernia, J.J. Lu, and T.A. Petritsch. The Operational Characteristics of Inline Skaters. University of South Florida, Tampa, FL, January 2001.
28. Brown, D.J. Testing and Analysis of In-line Skating in Relation to Motor Vehicular Traffic. Accident Reconstruction Journal, Vol. 11, No. 1, 2000, pp. 18-22.
29. American Association of State Highway and Transportation Officials. A Policy on Geometric Design of Highways and Streets. (commonly referred to as "Green Book") American Association of State Highway and Transportation Officials, Washington, DC, 2001.
REDUCTION AND ANALYSIS OF DATA
The ADAAG set minimum criteria for accessibility of pedestrian facilities throughout the United States. By law, States and local jurisdictions are required to follow ADAAG when constructing and altering any pedestrian facility. In this study, we recognized ADAAG as rule and thus focused on evaluating select design guidelines contained in the AASHTO Guide, wherein discretion may be allowed by a designer. Consequently we have enumerated in this section of the report the applicable AASHTO criteria for each operational characteristic and compared the AASHTO values to the values that were observed for the participants. While the purpose of this research was not to evaluate the AASHTO Guide for the Development of Bicycle Facilities, that document is currently used throughout the United States to set operational criteria for shared use paths, and it considers the bicycle to be the design vehicle. The analyses reveal important information about the physical dimensions, speeds, etc. for various user types and, thus, how well those various users might be accommodated on facilities designed in accordance with the AASHTO bicycle criteria (figure 43). The implications of our findings are covered in the next section, "Discussion." As that section will detail, the bicycle, in many cases, is not the critical design vehicle.
The following discussion focuses on user types for which five or more users were observed in this study.
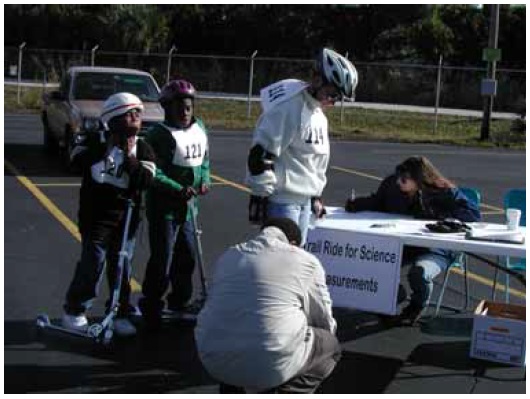
Figure 43. The study reveals important information on various users now common on shared use paths.
Study Limitations
This study contains some limitations. First, the distribution of participants by user type as shown in the following tables may not be representative of the overall user population on the three trails, nor of shared use paths throughout the United States. For example, the observed proportion of hand cyclists (32 out of 260) is likely higher than their incidence at other times (when promoted "Ride for Science" events were not taking place) (figure 44).
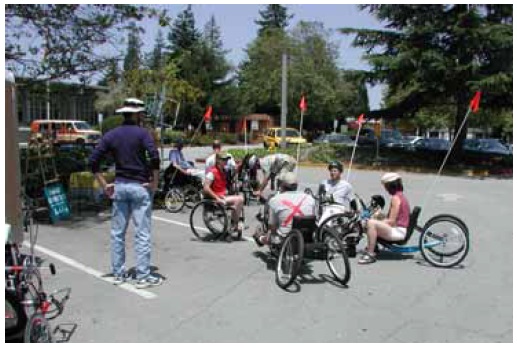
Figure 44. Thirty-two hand cyclists were active participants in this study.
Second, the active participants registered with the data collection team and were aware that they were being observed. Thus, they may have been motivated to perform differently than if they had been in situ participants.
Third, measurements were taken on only individual users, not users traveling side-by-side or one in front of the other. Thus, the design implications discussed in this study pertain only to individual users. For instance, two hand cyclists traveling abreast will require more path width than a solo hand cyclist. Three inline skaters traveling one after the other may require more time to cross an intersection than a single inline skater. Moreover, individuals may behave differently when they are part of a group than when they are traveling alone.
Fourth, the sample sizes by user type varied widely. Among the 260 active users, the largest user type was bicyclists (139). At the other end, twenty-two user types had one user each. Much of the following discussion focuses on user types for which five or more users were observed in this study.
Eye Height
The AASHTO Guide for the Development of Bicycle Facilities (p. 40) assumes a bicyclist eye height of 140 cm (54 inches) in calculating the minimum length of vertical curve necessary to provide minimum stopping sight distance at various speeds on crest vertical curves or sag vertical curves with overhead sight obstructions.(2) Vertical curves are described in more detail in the Discussion section of this report. Table 7 shows that the mean eye height for bicyclists in this study was 157 cm (62 inches). The 85th percentile eye height for bicyclists was 150 cm (59 inches). In other words, 85 percent of bicyclists had eye heights of 150 cm (59 inches) or greater. Consequently, the AASHTO value seems conservative with the minimum values observed for bicyclists.
Hand cyclists appear to be the critical user for shared use path design of vertical curves, as they had the lowest mean (96 cm (38 inches)) and 85th percentile (85 cm (33 inches)) eye heights. Among equipment types with five or more users, the 85th percentile eye heights were less than 140 cm (54 inches) for users of the following: hand cycles, kick scooters, manual wheelchairs, power wheelchairs, and recumbent bicycles. The low eye heights for scooters may have been due to the users' ages.
2. American Association of State Highway and Transportation Officials. Guide for the Development of Bicycle Facilities. American Association of State Highway and Transportation Officials, Washington, DC, 1999.
Table 7. Eye height.
| USER TYPE | N | MEAN (cm) | STD DEV (cm) | 15TH PER (cm) | 85TH PER (cm) | 95TH PER (cm) |
|---|---|---|---|---|---|---|
| Adult tricycle | 2 | 157 | 10 | 162 | 152 | 151 |
| Bicycle | 139 | 157 | 12 | 167 | 150 | 133 |
| Bicycle trailer | 4 | 160 | 15 | 170 | 152 | 148 |
| Hand cycle | 32 | 96 | 11 | 105 | 85 | 78 |
| Inline skates | 26 | 168 | 13 | 181 | 164 | 157 |
| Kick scooter | 13 | 147 | 20 | 165 | 134 | 114 |
| Manual wheelchair | 7 | 121 | 6 | 126 | 116 | 113 |
| Power scooter | 1 | 132 | NA | 132 | 132 | 132 |
| Power wheelchair | 6 | 124 | 5 | 129 | 119 | 120 |
| Power wheelchair + dog | 2 | 117 | 11 | 122 | 112 | 110 |
| Recumbent bicycle | 6 | 126 | 11 | 133 | 118 | 110 |
| Segway | 4 | 188 | 12 | 196 | 179 | 177 |
| Skateboard | 3 | 155 | 13 | 164 | 146 | 144 |
| Stroller | 3 | 133 | 49 | 163 | 100 | 84 |
| Other | 12 | 148 | 16 | 162 | 132 | 121 |
NOTES:
1.This table includes only active participants.
2.AASHTO value for bicyclists = 140 cm (54 inches)
3.NA = Not applicable because N=1.
Length
The AASHTO Guide for the Development of Bicycle Facilities (p. 65) incorporates a bicycle length of 180 cm (72 inches) in its calculations for recommended traffic signal timing.(2) Table 8 shows that the mean length for bicycles was 168 cm (66 inches), and the 85th percentile, 178 cm (70 inches). In other words, 85 percent of observed bicycles had lengths of 178 cm (70 inches) or less. Thus, the values observed for bicycles in particular seem to be consistent with the AASHTO value.
Among equipment types with five or more users, recumbent bicycles appear to be the critical user, as they had the highest mean (190 cm (75 inches)) and 85th percentile (208 cm (82 inches)) lengths. The 85th percentile length of hand cycles also exceeded 180 cm (72 inches). Although only four bicycles with trailers were observed in this study, they had a mean length of 290 cm (114 inches) and an 85th percentile length of 296 cm (117 inches). Thus, the AASHTO value is not sufficiently long for these user types, with potentially serious consequences-see "Refuge Island" in the "Discussion" section of this report.
2. American Association of State Highway and Transportation Officials. Guide for the Development of Bicycle Facilities. American Association of State Highway and Transportation Officials, Washington, DC, 1999.
Table 8. Length.
| USER TYPE | N | MEAN (cm) | STD DEV (cm) | 15TH PER (cm) | 85TH PER (cm) | 95TH PER (cm) |
|---|---|---|---|---|---|---|
| Adult tricycle | 2 | 163 | 15 | 156 | 171 | 173 |
| Bicycle | 139 | 168 | 11 | 163 | 178 | 180 |
| Bicycle trailer | 4 | 290 | 9 | 283 | 296 | 299 |
| Hand cycle | 32 | 181 | 15 | 163 | 195 | 198 |
| Inline skates | 26 | 39 | 9 | 34 | 41 | 45 |
| Kick scooter | 13 | 68 | 5 | 63 | 74 | 76 |
| Manual wheelchair | 7 | 99 | 15 | 87 | 108 | 119 |
| Power scooter | 1 | 112 | NA | 112 | 112 | 112 |
| Power wheelchair | 6 | 123 | 13 | 108 | 134 | 138 |
| Power wheelchair + dog | 2 | 119 | 14 | 112 | 126 | 129 |
| Recumbent bicycle | 6 | 190 | 18 | 178 | 208 | 217 |
| Segway | 4 | 56 | 0 | 56 | 56 | 56 |
| Skateboard | 3 | 76 | 0 | 76 | 76 | 76 |
| Stroller | 3 | 124 | 40 | 100 | 151 | 164 |
| Other | 12 | 192 | 61 | 146 | 245 | 289 |
NOTES:
1. This table includes only active participants.
2. AASHTO value for bicyclists = 180 cm (72 inches)
3. The lengths for inline skaters are their rest lengths. Their lengths while in motion will vary depending on where they are in their stride.
4. NA = Not applicable because N=1.
Width
The AASHTO Guide for the Development of Bicycle Facilities (p. 5) recommends a minimum width of 120 cm (48 inches) for any facility designed to be used by bicyclists.(2) This is based on a typical bicyclist having a width of 75 cm (30 inches) and requiring a minimum of 100 cm (40 inches) of operating space. Table 9 shows that the mean width for bicyclists in this study was 61 cm (24 inches), and the 85th percentile width was 69 cm (27 inches). Hence, the values observed for bicyclists seem consistent with the AASHTO value.
Among equipment types with five or more users, hand cyclists appear to be the critical user, as they had the highest mean (65 cm (26 inches)) and 85th percentile (71 cm (28 inches)) widths. For all user types with five or more users, the 85th percentile width was less than 75 cm (30 inches). Thus, the AASHTO value accommodates above 85 percent of the observed individuals within each user type.
Section 4.2.1 of the ADAAG requires a minimum clear width of 81.5 cm (32 inches) at a point, and 91.5 cm (36 inches) continuously, for single wheelchair passage. All of the "solo" manual and power wheelchair users (i.e., not accompanied by a dog or pulling another wheelchair) had widths of 69 cm (27 inches) or less, and would therefore be accommodated by ADAAG.
2. American Association of State Highway and Transportation Officials. Guide for the Development of Bicycle Facilities. American Association of State Highway and Transportation Officials, Washington, DC, 1999.
Table 9. Width.
| USER TYPE | N | MEAN (cm) | STD DEV (cm) | 15TH PER (cm) | 85TH PER (cm) | 95TH PER (cm) |
|---|---|---|---|---|---|---|
| Adult tricycle | 2 | 65 | 1 | 65 | 66 | 66 |
| Bicycle | 139 | 61 | 8 | 55 | 69 | 72 |
| Bicycle trailer | 4 | 66 | 11 | 59 | 74 | 80 |
| Hand cycle | 32 | 65 | 7 | 58 | 71 | 74 |
| Inline skates | 26 | 52 | 9 | 45 | 62 | 64 |
| Kick scooter | 13 | 39 | 6 | 34 | 45 | 46 |
| Manual wheelchair | 7 | 62 | 4 | 61 | 64 | 67 |
| Power scooter | 1 | 58 | NA | 58 | 58 | 58 |
| Power wheelchair | 6 | 65 | 4 | 62 | 68 | 68 |
| Power wheelchair + dog | 2 | 130 | 0 | 130 | 130 | 130 |
| Recumbent bicycle | 6 | 62 | 8 | 54 | 67 | 69 |
| Segway | 4 | 64 | 0 | 64 | 64 | 64 |
| Skateboard | 3 | 24 | 1 | 23 | 25 | 25 |
| Stroller | 3 | 51 | 6 | 47 | 55 | 57 |
| Other | 12 | 95 | 30 | 64 | 124 | 132 |
NOTES:
1. This table includes only active participants.
2. AASHTO value for a facility designed to be used by bicyclists = 120 cm (48 inches)
3. NA = Not applicable because N=1.
Acceleration
The AASHTO Guide for the Development of Bicycle Facilities (p. 65) uses a bicycle acceleration rate of 0.5 to 1 m/sec2 (1.5 to 3.0 ft/sec2) in its equation to determine the minimum green time.(2) Table 10 below shows the observed 85th percentile acceleration rates by user type and distance, in 6.1-m (20-ft) increments. Bicyclists met or exceeded the AASHTO range for distances of up to 12.2 m (40 ft). At greater distances, the acceleration rates were much lower and fell short of the value range. This is an important finding with its relevance explained in the "Discussion" section.
For all distances, recumbent bicyclists had the highest 85th percentile acceleration rates and manual wheelchairs, as expected, had the lowest 85th percentile acceleration rates. For the initial distance traveled, 0 to 12.2 m (0 to 40 ft), hand cycles, manual wheelchairs, and Segways had acceleration rates slower than the lower end of the range used by AASHTO (i.e., slower than 0.5 m/sec2 (1.5 ft/sec2)).
2. American Association of State Highway and Transportation Officials. Guide for the Development of Bicycle Facilities. American Association of State Highway and Transportation Officials, Washington, DC, 1999.
Table 10. 85th percentile acceleration rates (m/sec2).
| USER TYPE | N | DISTANCE TRAVELED (6.1-M INCREMENTS) | |||
|---|---|---|---|---|---|
| 0-12.2 m | 12.2-24.4 m | 24.4-36.6 m | 36.6-48.8 m | ||
| Bicycle | 122 | 0.5 | 1.4 | 0.2 | 0.2 |
| Hand cycle | 33 | 0.4 | 0.8 | 0.1 | 0.1 |
| Inline skates | 21 | 0.6 | 1.4 | 0.1 | 0.1 |
| Kick scooter | 11 | 0.5 | 1.0 | 0.1 | 0.1 |
| Manual wheelchair | 9 | 0.2 | 0.2 | 0.0 | 0.0 |
| Recumbent bicycle | 6 | 1.0 | 1.7 | 0.3 | 0.4 |
| Segway | 4 | 0.3 | 0.9 | 0.1 | 0.1 |
| Other | 31 | 0.5 | 0.9 | 0.1 | 0.1 |
NOTE: This table includes only active participants.
Table 11 shows the time required for various path users to cover a given distance. This affects calculations for both minimum green time for traffic signals and for pedestrian clearance intervals. The AASHTO minimum green time calculation was performed using the AASHTO 0.5-m/sec2 (1.5-ft/sec2) acceleration rate. The values in the "Pedestrian Clearance" row were calculated using a walking speed of a constant 1.2 m/sec (4 ft/sec). Again, recumbent bicyclists had the lowest 85th percentile elapsed times and manual wheelchair users had the highest 85th percentile elapsed times. At signalized crossings, pedestrian signals are needed to accommodate the slower travel speeds of manual wheelchair users and pedestrians. For users likely to be operating on the roadway, the critical users for minimum green time would be hand cyclists, as they had the highest elapsed time of the vehicular-type devices. For pedestrian clearance intervals, manual wheelchair users would be considered the critical users; compared to other users, manual wheelchair users take the longest time to cover any given distance.
Table 11. 85th percentile elapsed time (sec).
| USER TYPE | N | DISTANCE TRAVELED | |||
|---|---|---|---|---|---|
| 12.2 m | 24.4 m | 36.6 m | 48.8 m | ||
| Bicycle | 122 | 4.8 | 7.7 | 10.3 | 12.7 |
| Hand cycle | 33 | 6.6 | 10.6 | 14.6 | 17.9 |
| Inline skates | 21 | 4.7 | 7.6 | 10.4 | 12.8 |
| Kick scooter | 11 | 4.7 | 8.0 | 11.4 | 14.8 |
| Manual wheelchair | 9 | 8.1 | 15.4 | 22.8 | 30.0 |
| Recumbent bicycle | 6 | 3.3 | 6.1 | 8.5 | 9.7 |
| Segway | 4 | 4.5 | 7.8 | 10.7 | 13.9 |
| AASHTO calculation | 5.2 | 9.8 | 11.4 | 12.8 | |
| Pedestrian clearance | 10.0 | 20.0 | 30.0 | 40.0 | |
NOTE: This table includes only active participants.
Speed
The AASHTO Guide for the Development of Bicycle Facilities (p. 36) recommends a minimum design speed of 30 km/h (20 mi/h) for shared use paths.(2) Table 12 shows that the mean speed for bicyclists in this study was 17 km/h (11 mi/h), and the 85th percentile speed, 22 km/h (14 mi/h). Thus, the AASHTO value is higher than the speeds observed for most bicyclists.
Recumbent bicyclists appear to be the critical user, as they had the highest mean (23 km/h (14 mi/h)) and 85th percentile (29 km/h (18 mi/h)) speeds. For all user types, the 85th percentile speed was less than 30 km/h (20 mi/h). Thus, the AASHTO value is higher than the speeds observed for most recumbent bicyclists.
The lowest mean speeds were observed for strollers (5 km/h (3 mi/h)) and manual wheelchairs (6 km/h (4 mi/h)). These two user types also had the lowest 15th percentile speeds, 4 km/h (3 mi/h) and 5 km/h (3 mi/h), respectively.
2. American Association of State Highway and Transportation Officials. Guide for the Development of Bicycle Facilities. American Association of State Highway and Transportation Officials, Washington, DC, 1999.
Table 12. Speed.
| USER TYPE | N | MEAN (km/h) | STD DEV (km/h) | 15TH PER (km/h) | 85TH PER (km/h) |
|---|---|---|---|---|---|
| Bicycle | 367 | 17 | 6 | 11 | 22 |
| Golf Cart | 5 | 16 | 4 | 12 | 19 |
| Hand Cycle | 38 | 14 | 7 | 8 | 19 |
| Inline Skates | 53 | 16 | 5 | 12 | 23 |
| Kick Scooter | 22 | 12 | 3 | 9 | 15 |
| Manual Wheelchair | 6 | 6 | 2 | 5 | 8 |
| Pedestrian | 38 | 7 | 2 | 5 | 10 |
| Power Wheelchair | 12 | 9 | 5 | 5 | 11 |
| Recumbent Bicycle | 24 | 23 | 7 | 18 | 29 |
| Segway | 4 | 15 | 2 | 14 | 17 |
| Skateboard | 10 | 13 | 5 | 8 | 20 |
| Stroller | 7 | 5 | 3 | 4 | 6 |
| Tandem | 3 | 19 | 6 | 15 | 22 |
| Other | 7 | 14 | 4 | 11 | 17 |
NOTES:
1. This table includes both active and in situ participants.
2. AASHTO value for shared use paths = 30 km/h (20 mi/h)
The speeds of active and in situ participants were compared for each user type. Active bicyclists traveled faster than in situ bicyclists, and this difference was statistically significant. On the other hand, active kick scooters and manual wheelchairs traveled slower than their in situ counterparts, and both differences were statistically significant. For other user types, the observed differences in speed between active and in situ participants were not statistically significant.
Table 13. Speed-active vs. in situ participants.
| USER TYPE | ACTIVE N | ACTIVE MEAN (km/h) | IN SITU N | IN SITU MEAN (km/h) | NOTE |
|---|---|---|---|---|---|
| Bicycle | 114 | 19 | 235 | 16 | S |
| Golf cart | 0 | - | 1 | 20 | NA |
| Hand cycle | 24 | 15 | 9 | 11 | - |
| Inline skates | 24 | 17 | 25 | 16 | - |
| Kick scooter | 11 | 12 | 5 | 15 | S |
| Manual wheelchair | 6 | 6 | 6 | 11 | S |
| Pedestrian | 0 | - | 30 | 7 | NA |
| Power wheelchair | 8 | 10 | 2 | 7 | - |
| Recumbent bicycle | 9 | 21 | 12 | 25 | - |
| Segway | 4 | 15 | 0 | - | NA |
| Skateboard | 4 | 13 | 6 | 13 | - |
| Stroller | 2 | 3 | 5 | 6 | - |
| Tandem | 2 | 17 | 1 | 23 | NA |
| Other | 1 | 16 | 5 | 13 | NA |
NOTES: This table includes both active and in situ participants. S = Significant at the 0.05 level.
- = Not significant.
Blank = Mean not calculated because N=0.
NA = Statistical significance not tested because N<2.
Stopping Distance
The AASHTO Green Book (pp. 111-113) recommends a perception-reaction time of 2.5 seconds for motorists.(29) It cites research by Johansson and Rumar, who found a mean reaction time of 0.66 seconds, after collecting data from 321 drivers who expected to apply their brakes.(30) About 10 percent of drivers had reaction times of 1.5 seconds or longer. Also in that study, when drivers did not expect to apply their brakes, their reaction times increased by approximately 1.0 second. Based on that study and other research, the AASHTO Green Book concluded that a value of 2.5 seconds exceeds the 90th percentile perception-reaction time of all drivers and takes into account the additional time required for unexpected braking vs. expected braking.(29) The AASHTO Guide for the Development of Bicycle Facilities (pp. 40-42) uses a perception-reaction time of 2.5 seconds.(2)
For this study, the perception-reaction time was measured from when the STOP sign was displayed to when the participant started braking. At the upstream acceleration station, participants were told in advance that at some point along the course they might be presented with a STOP sign, and if so, they were to stop as quickly as is comfortable. (In fact, all participants were asked to stop.) In addition, "dummy" stop stations were set up to reduce the anticipation at a particular location.
Table 14 shows that the mean perception-reaction time for bicyclists was 0.9 seconds. This is consistent with the mean reaction time of 0.66 seconds for motorists, as reported by Johansson and Rumar.(30)
2. American Association of State Highway and Transportation Officials. Guide for the Development of Bicycle Facilities. American Association of State Highway and Transportation Officials, Washington, DC, 1999.
29. American Association of State Highway and Transportation Officials. A Policy on Geometric Design of Highways and Streets. (commonly referred to as “Green Book”) American Association of State Highway and Transportation Officials, Washington, DC, 2001.
30. Johansson, G. and Rumar, K. Driver’s Brake Reaction Times. Human Factors, Vol. 13, No. 1, 1971, pp. 23-27.
Table 14. Perception-reaction time.
| USER TYPE | N | MEAN (sec) | STD DEV (sec) | 85TH PER (sec) |
|---|---|---|---|---|
| Bicycle | 130 | 0.9 | 0.7 | 1.3 |
| Hand cycle | 32 | 0.9 | 0.6 | 1.2 |
| Inline skates | 20 | 1.2 | 0.5 | 1.4 |
| Kick scooter | 14 | 1.2 | 0.8 | 2.3 |
| Manual wheelchair | 8 | 1.1 | 0.3 | 1.5 |
| Power wheelchair | 6 | 0.8 | 0.5 | 1.3 |
| Recumbent bicycle | 6 | 0.8 | 0.3 | 1.0 |
| Segway | 5 | 1.1 | 0.6 | 1.5 |
| Other | 24 | 1.3 | 0.2 | 1.5 |
NOTES:
1.This table includes only active participants.
2.AASHTO value = 2.5 sec
The 85th percentile for bicyclists was 1.3 seconds. Adding 1.0 second to this value results in a value of 2.3 seconds for bicyclists who do not expect to stop. Consequently, the AASHTO value of 2.5 seconds seems adequate for the majority of bicyclists, including those who are not expecting to stop. In fact, with the possible exception of kick scooters (whose riders had an 85th percentile perception-reaction time of 2.3 seconds), the AASHTO value of 2.5 seconds seems appropriate for the majority of other users, including those who are not expecting to stop.
Table 15 shows the braking distance, i.e. the distance traveled from the time that the user initiated braking to the time that the user came to a complete stop, for user groups with five or more users. The calculated friction factor is also shown, using the following equation from the AASHTO Guide to the Development of Bicycle Facilities (p. 42):(2)
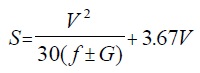
(2)
where: S = stopping sight distance, ft
V = speed, mi/h
f = coefficient of friction
G = grade
V2
The first term 
In this analysis, G has a value of zero because data were collected on level trail sections. The second term, 3.67V, is not part of the braking distance.
Therefore, the preceding equation simplifies to a braking distance equation:

(3)
where: d = braking distance, ft
Rearranging the preceding equation gives:

(4)
The friction factor shown in table 15 is that associated with the act of braking. It was calculated by using these values of V and S:
V = 85th percentile speed for that user type, from when the user entered the stopping sight distance station to when the STOP sign was displayed.
S = 85th percentile braking distance for that user type, as observed at the stopping sight distance station
The deceleration rate was calculated as follows:

(5)
where: a = acceleration, ft/sec2
d = braking distance, ft
t = braking time, sec and the negative sign denotes deceleration
For each individual participant, his/her braking distance and braking time were used to calculate his/her deceleration rate. The aggregated deceleration rate for each user type is shown in table 16.
Table 15. Braking distance and friction factor.
| USER TYPE | N | MEAN (m) | 85TH PER (m) | FRICTION FACTOR |
|---|---|---|---|---|
| Bicycle | 130 | 4.8 | 7.0 | 0.32 |
| Hand cycle | 32 | 3.9 | 7.1 | 0.24 |
| Inline skates | 20 | 8.4 | 10.8 | 0.20 |
| Kick scooter | 14 | 4.9 | 8.9 | 0.09 |
| Manual wheelchair | 9 | 1.0 | 1.7 | 0.23 |
| Power wheelchair | 6 | 2.3 | 4.6 | 0.13 |
| Recumbent bicycle | 6 | 3.9 | 5.3 | 0.30 |
| Segway | 5 | 2.7 | 3.1 | 0.49 |
| Other | 24 | 3.7 | 6.6 |
0.28 |
Table 16. Deceleration rate.
| USER TYPE | N | MEAN (m/sec2) | 85TH PER (m/sec2) |
|---|---|---|---|
| Bicycle | 130 | 2.3 | 3.3 |
| Hand cycle | 32 | 2.3 | 3.6 |
| Inline skates | 20 | 1.5 | 2.0 |
| Kick scooter | 14 | 2.4 | 2.6 |
| Manual wheelchair | 8 | 1.0 | 1.8 |
| Power wheelchair | 6 | 2.2 | 3.2 |
| Recumbent bicycle | 6 | 2.9 | 4.0 |
| Segway | 5 | 3.1 | 4.7 |
| Other | 24 | 1.9 | 2.4 |
NOTE: This table includes only active participants.
The implications of these findings are covered in the "Discussion" section below, under the heading "Sight Distance."
Sweep Width
The AASHTO Guide for the Development of Bicycle Facilities (pg. 22) recommends a minimum width for bike lanes as 1.2 m (4 ft).(2) Additionally it recommends (pp. 35-36) a minimum width of 3 m (10 ft) for a two-way shared use path (and a wider path is desirable where there is substantial use and/or a steep grade), notwithstanding the procedures given in the Highway Capacity Manual for calculating the number and effects of passing events.(26) In other words, the AASHTO recommendation does not explicitly account for user volumes or passing hindrance resulting from user encounters or overtaking/passing events.
The sweep width was measured as each user traveled through an 8-m (26-ft) section of the course (figure 32). Table 17 shows that the mean max sweep width for bicyclists is 1.0 m (3.3 ft). The 85th percentile max sweep width was 1.2 m (4.0 ft). Hence, the AASHTO values of 1.2 m (4 ft) for bike lanes and 3 m (10 ft) for a two-way shared use path accommodates most users traveling single-file in opposite directions to pass each other, though some only barely.
2. American Association of State Highway and Transportation Officials. Guide for the Development of Bicycle Facilities. American Association of State Highway and Transportation Officials, Washington, DC, 1999.
26. Transportation Research Board. Highway Capacity Manual 2000. Transportation Research Board, National Academy of Sciences, Washington, DC, 2000.
Table 17. Sweep width (lateral operating space).
| USER TYPE | N | MEAN MAX (m) | STD DEV MAX (m) | 85TH PER MAX (m) | 95TH PER MAX (m) |
|---|---|---|---|---|---|
| Adult tricycle | 4 | 1.0 | 0.1 | 1.0 | 1.1 |
| Bicycle | 501 | 1.0 | 0.3 | 1.2 | 1.4 |
| Bicycle trailer | 6 | 1.1 | 0.2 | 1.2 | 1.3 |
| Hand cycle | 48 | 0.8 | 0.1 | 1.0 | 1.1 |
| Inline skates | 62 | 1.3 | 0.2 | 1.5 | 1.7 |
| Kick scooter | 28 | 0.9 | 0.2 | 1.1 | 1.2 |
| Manual wheelchair | 15 | 1.1 | 0.4 | 1.5 | 1.8 |
| Pedestrian | 63 | 1.0 | 0.5 | 1.3 | 1.7 |
| Power scooter | 1 | 0.7 | NA | 0.7 | 0.7 |
| Power wheelchair | 12 | 0.8 | 0.2 | 0.9 | 1.1 |
| Recumbent bicycle | 22 | 0.9 | 0.1 | 1.1 | 1.1 |
| Segway | 8 | 1.0 | 0.3 | 1.1 | 1.5 |
| Skateboard | 11 | 1.1 | 0.6 | 1.2 | 2.0 |
| Stroller | 10 | 1.0 | 0.4 | 1.1 | 1.6 |
| Tandem | 3 | 0.9 | 0.0 | 0.9 | 0.9 |
| Other | 17 | 1.2 | 0.3 | 1.5 | 1.7 |
NOTES:
1.This table includes both active and in situ participants.
2.AASHTO value for an on-street bike lane = 1.2 m (4 ft)
3.AASHTO value for a two-way shared use path = 3 m (10 ft)
4.NA = Not applicable because N=1.
Among equipment types with five or more users, inline skates appear to be the critical user. Their mean max sweep width was 1.3 m (4.1 ft), and 85th percentile, 1.5 m (5.0 ft). For all user types, the 85th percentile width was 1.5 m (5 ft) or less. This width slightly exceeds the AASHTO value of 1.2 m (4 ft) for bike lanes. However, the recommended 3 m (10 ft) minimum width for shared use paths is sufficient to accommodate more than 85 percent of the observed individuals within each user type, assuming a two-directional steady linear flow of users traveling single-file on a shared use path.
Section 4.2.2 of the ADAAG requires that the minimum width for two wheelchairs to pass is 1.525 m (60 inches). This assumes that both wheelchair users are traveling in parallel paths to each other and to the edges of the path.
Three-Point Turn
The AASHTO Guide for the Development of Bicycle Facilities (pp. 35-36) recommends a minimum paved width of 300 cm (120 inches) for a two-way shared use path.(2) Table 18 shows that the mean three-point turn width required by bicyclists was 287 cm (113 inches). The 85th percentile turn width was 350 cm (138 inches). Consequently, the AASHTO paved width value accommodates fewer than 85 percent of bicyclists.
2. American Association of State Highway and Transportation Officials. Guide for the Development of Bicycle Facilities. American Association of State Highway and Transportation Officials, Washington, DC, 1999.
Table 18. Three-point turn widths.
| USER TYPE | N | MEAN (cm) | STD DEV (cm) | 85TH PER (cm) | 95TH PER (cm) |
|---|---|---|---|---|---|
| Adult tricycle | 2 | 267 | 75 | 265 | 315 |
| Bicycle | 50 | 287 | 84 | 350 | 371 |
| Hand cycle | 30 | 457 | 86 | 541 | 596 |
| Inline skates | 16 | 160 | 71 | 241 | 262 |
| Kick scooter | 12 | 178 | 61 | 210 | 273 |
| Manual wheelchair | 7 | 113 | 30 | 146 | 155 |
| Power scooter | 1 | 145 | NA | 145 | 145 |
| Power wheelchair | 8 | 138 | 20 | 152 | 167 |
| Recumbent bicycle | 6 | 306 | 36 | 339 | 357 |
| Segway | 3 | 98 | 3 | 100 | 101 |
| Stroller | 2 | 286 | 214 | 392 | 422 |
| Other | 7 | 471 | 221 | 681 | 787 |
NOTES:
1.This table includes only active participants.
2.NA = Not applicable because N=1.
Among user types with five or more users, hand cyclists had the highest mean (457 cm (180 inches)) and 85th percentile (541 cm (213 inches)). The 85th percentile of recumbent bicyclists also exceeded 300 cm (120 inches). In fact, 29 out of the 30 observed hand cyclists had three-point turn widths in excess of 300 cm (120 inches). Two of the six observed recumbent bicyclists also had three-point turn widths in excess of 300 cm (120 inches).
Turning Radius
According to the AASHTO Guide for the Development of Bicycle Facilities (p. 37), the minimum design curve radius can be calculated by using the following formula:
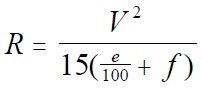
(6)
where: R = Curve radius (ft)
V = Design speed (mi/h)
e = Rate of superelevation (percent)
f = Coefficient of friction
In this study, the trails were flat, so the rate of superelevation was zero, and the formula simplifies to:
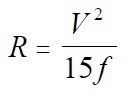
(7)
This formula can be rearranged as
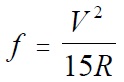
(8)
to calculate friction factors given the speed of each user as he or she traverses curves with specified radii.
It should be noted that what AASHTO refers to as a friction factor is not an actual measurement of the sliding friction of the pavement surface. What it truly represents is the amount of lateral acceleration a user is willing to accept before slowing to a more comfortable speed.
Table 19 of this report shows the friction factors based on 85th percentile speeds. Additionally, the friction factors suggested by AASHTO are provided for comparison. There is a general downward trend in friction factors with increasing curve radii. However, for larger radii the friction factors may level off or even increase. This represents the fact that, at higher radii, users are not slowing substantially from their tangent travel speeds to negotiate the curves (figure 45). Thus, most users could comfortably travel around the larger curves at speeds higher than what was observed in this study. The implications of these results on horizontal alignment are given in the "Discussion" section.
Table 19. Friction factors for different radii, based on 85th percentile speeds.
| USER TYPE | N | 3.1 m RADIUS | 6.1 m RADIUS | 9.2 m RADIUS | 15.3 m RADIUS | 25.4 m RADIUS | 27.5 m RADIUS |
|---|---|---|---|---|---|---|---|
| Bicycle | 142 | 0.61 | 0.52 | 0.36 | 0.26 | 0.18 | 0.20 |
| Hand cycle | 31 | 0.19 | 0.21 | 0.18 | 0.15 | 0.15 | 0.15 |
| Inline skates | 25 | 0.42 | 0.46 | 0.32 | 0.23 | 0.11 | 0.12 |
| Kick scooter | 13 | 0.27 | 0.21 | 0.16 | 0.12 | 0.07 | 0.08 |
| Manual wheelchair | 7 | 0.05 | 0.07 | 0.05 | 0.03 | 0.02 | 0.04 |
| Motorized wheelchair | 4 | 0.12 | 0.09 | 0.07 | 0.12 | 0.06 | 0.07 |
| Recumbent bicycle | 6 | 0.64 | 0.52 | 0.37 | 0.25 | 0.15 | 0.16 |
| Segway | 4 | 0.29 | 0.58 | 0.29 | 0.17 | 0.10 | 0.09 |
| AASHTO values | 0.32 | 0.30 | 0.29 | 0.26 | 0.24 | 0.23 |
NOTE: This table includes only active participants.
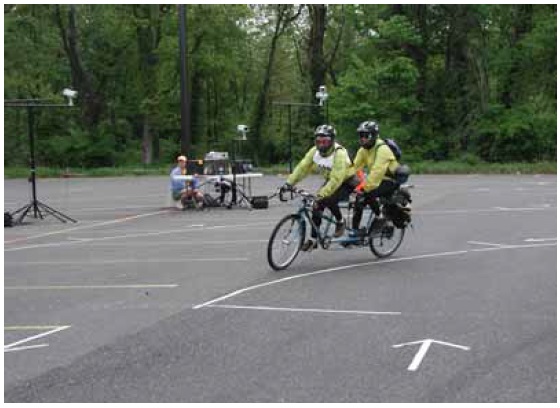
Figure 45. Two tandem riders negotiating a curve at the turning radius station.
DISCUSSION
This research shows that there is a great diversity in the operating characteristics of various road and trail user types (figure 46). To ensure the safe accommodation of emerging types of road and trail users, their operating characteristics must be considered in the development of design criteria; in some cases, it may be prudent to use an emerging user instead of the bicycle as the design user.
The AASHTO Guide for the Development of Bicycle Facilities is the primary reference for designers of shared use facilities and has been adopted as standard for shared use path design by many jurisdictions around the United States.(2) The standards contained therein were developed using the operational characteristics of the bicycle to determine design criteria. While this research is not intended to validate or discredit the AASHTO criteria, comparisons to AASHTO are appropriate because of its status as a national guide.
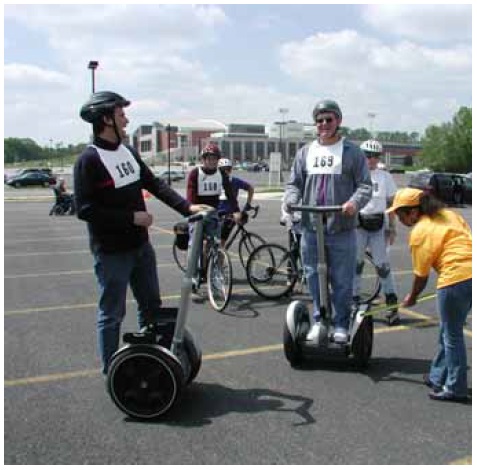
Figure 46. Trail users have diverse operating characteristics.
2. American Association of State Highway and Transportation Officials. Guide for the Development of Bicycle Facilities. American Association of State Highway and Transportation Officials, Washington, DC, 1999.
Bike Lane Width
The AASHTO Guide for the Development of Bicycle Facilities (p. 22) recommends a minimum width for bike lanes of 1.2 m (4 ft).(2) While this dimension appears to be adequate to accommodate most bicyclists, the 85th percentile sweep width for inline skaters exceeds this width.
2. American Association of State Highway and Transportation Officials. Guide for the Development of Bicycle Facilities. American Association of State Highway and Transportation Officials, Washington, DC, 1999.
Path Width
AASHTO (pp. 35-36) recommends a minimum path width of 3 m (10 ft), notwithstanding the procedures given in the Highway Capacity Manual for calculating the number and effects of passing events.(26) The AASHTO recommendation does not explicitly account for user volumes and passing hindrance resulting from user encounters. AASHTO recommends a greater width if there is a substantial use by a mix of users. In a few instances, a lower width may be adequate.
Section 4.2.1 of the ADAAG requires a minimum clear width of 0.815 m (32 inches) at a point, and 0.915 m (36 inches) continuously, for single wheelchair passage. All of the "solo" manual and power wheelchair users (i.e., not accompanied by a dog or pulling another wheelchair) had sweep widths of 0.69 m (27 inches) or less, and would therefore be accommodated by ADAAG.
In addition, Section 4.2.2 of the ADAAG requires that the minimum width for two wheelchairs to pass is 1.525 m (60 inches). This assumes that both wheelchair users are traveling in parallel paths to each other and to the edges of the path.
With respect to sweep width, the critical user is the inline skater. With 85th percentile sweep widths of 1.51 m (4.96 ft), two individuals passing in opposite directions would only just fit a 3m (10-foot) wide path. Additionally, this research only addressed individual users. Users traveling abreast in pairs or groups would likely require additional space. Examples of these include parents and children together, a wheelchair user with his/her dog, and a runner who is visually impaired with a lead.
Several user types, including bicycles, recumbent bicycles, and hand cycles, required more than 3 m (10 ft) of width (at the 85th percentile level) to execute a three-point turn. Hand cyclists are the critical users, requiring 5.40 m (17.8 ft) (at the 85th percentile level) to perform a three-point turn and not having other options for completing a shorter radius turn.
26. Transportation Research Board. Highway Capacity Manual 2000. Transportation Research Board, National Academy of Sciences, Washington, DC, 2000.
Design Speed
The selected design speed of a facility affects many aspects of geometric design. Consequently, it can significantly impact the cost, constructability, and operational safety of a project. The AASHTO Guide for the Development of Bicycle Facilities (p. 36) specifies 30 km/h (20 mi/h) as the minimum design speed that should be used on shared use paths (figure 47).(2) It goes on to provide modifiers for grades and strong prevailing winds.
Figure 47. AASHTO's design bicyclist travels at 30 km/h (20 mi/h).
(Photo by Dan Burden.)
Of the bicyclist participants in this research project, only four, or 1 percent, exceeded the suggested 30-km/h (20-mi/h) design speed. The 85th percentile speed for bicyclists was 22 km/h (14 mi/h). This suggests that the 30-km/h (20-mi/h) design speed may be conservative; however, further research is needed.
Recumbent bicyclists had the highest observed 85th percentile speeds, 29 km/h (18 mi/h). This may suggest that they may be the appropriate user upon which to set a minimum design speed. However, as discussed in the following sections, the additional design characteristics of the various users need to be evaluated before such a conclusion can be drawn.
At the other extreme, hand cyclists appear to have the lowest 15th percentile speed, 8 km/h (5 mi/h), of those users who would be expected to operate in the street. Strollers had the lowest 15th percentile speed, 4 km/h (3 mi/h) (table 12).
2. American Association of State Highway and Transportation Officials. Guide for the Development of Bicycle Facilities. American Association of State Highway and Transportation Officials, Washington, DC, 1999.
Horizontal Alignment
For horizontal alignment, the critical factor is the point at which users will instinctively decelerate to maintain a comfortable degree of lateral acceleration while traversing a curve. This point is represented by the coefficient of friction used in the minimum design radius equations of AASHTO. When evaluating the coefficient of friction, it is important to remember that it does not truly represent the point at which a tire will slide out from under the path user, rather, it is a comfort factor. This is not to suggest that the coefficient of friction should be regarded lightly. Indeed, if a curve is so sharp as to make a path user uncomfortable, the user may understeer and run off the side of the path.
As shown in table 19, users of manual wheelchairs tolerated the lowest degree of lateral acceleration, "coefficients of friction." However, given that their 85th percentile speed is 8 km/h (5 mi/h), the minimum radius required for manual wheelchair users would be 12.2 m (40 ft). Recumbent bicycles, though having the highest calculated tolerance for lateral acceleration (coefficients of friction) for 3.1-m and 9.2-m (10- and 30-ft) radii, also have the highest 85th percentile speeds. The minimum radius calculated for the 85th percentile recumbent bicycle is 26.8 m (88 ft). As a result, recumbent bicycles would be the critical design user for turning radii.
Most users did not appear to reduce their speeds when entering radii greater than 15.8 m (50 ft). The exception is recumbent bicyclists, who may have been constrained by even the 27.5-m (90ft) radius.
AASHTO (p. 38) currently recommends a minimum radius of 27 m (90 ft) for cyclists traveling at 30 km/h (20 mi/h) around a curve with a 2 percent superelevation.(2)
2. American Association of State Highway and Transportation Officials. Guide for the Development of Bicycle Facilities. American Association of State Highway and Transportation Officials, Washington, DC, 1999.
Stopping Sight Distance
Adequate sight distance is required to provide path users ample opportunity to see and react to the unexpected. The distance required for a user to come to a complete stop, stopping sight distance, is a function of the user's perception and brake reaction time, initial speed, the coefficient of friction between the user's wheels and the pavement, and the braking ability of the user's device.
The critical trail user for stopping sight distance is the recumbent bicyclist. For wet pavement, AASHTO assumes the friction factor is half that of dry pavement. Although this would not affect the reaction time, it would double the braking distance. The calculated stopping sight distance on wet pavement would be 32.7 m (107 ft). In comparison, AASHTO currently recommends a stopping sight distance of 38.7 m (127 ft) for a bicyclist traveling at the recommended design speed of 30 km/h (20 mi/h) in a wet pavement condition (i.e., coefficient of friction considered to be half of dry pavement).
Vertical Alignment-Crest Vertical Curves
A crest vertical curve is present when a shared use path (or a roadway) goes uphill and then goes downhill. The minimum length for a crest vertical curve is a function of the stopping sight distance, the algebraic difference in the upgrade and downgrade grades, the assumed height of an object on the pavement, and the user's eye height. The AASHTO Green Book (p. 271) gives equations for calculating the minimum length of a crest vertical curve so that adequate sight distance is available, as shown below.(29)
Case 1-Sight distance greater than length of vertical curve (S>L)

(9)
Case 2-Sight distance less than lenght of vertical curve (S>L)
(10)
For both equations,
L = length of vertical curve (ft)
S = sight distance (ft)
A = algebraic difference in grades (percent)
h1 = height of eye (ft)
h2 = height of object (ft)
The AASHTO Guide for the Development of Bicycle Facilities (p. 36) recommends a maximum grade of 5 percent.(2) With higher grades, many bicyclists may have difficulty climbing and they may end up going downhill too fast for comfort or safe operation. A maximum grade of 5 percent also provides usable conditions for pedestrians in wheelchairs, whereas steeper grades do not. An uphill grade of 5 percent followed by a downhill grade of 5 percent results in a difference in grades of 10 percent.
Table 20 shows the calculated minimum length of crest vertical curve for each user type, using the values of "A" (the algebraic difference in grades) as described above. In addition, the sight distance was obtained by calculating the distance traveled during the perception-reaction time (using the 85th percentile observed speeds from the speed station) to the calculated braking distance under wet pavement conditions. Because the friction factor on wet pavement is one-half that on dry pavement, the 85th percentile observed braking distances were doubled to obtain the "wet" braking distances. The height of eye is the 85th percentile eye height for each user type. The height of object is zero.
Table 20. Minimum length of crest vertical curve.
| USER TYPE | 85TH PER SPEED (m/sec) | 85TH PER EYE HEIGHT (m) | STOPPING DISTANCE (m) | LENGTH OF VERTICAL CURVE (m) |
|---|---|---|---|---|
| Bicycle | 6.1 | 1.5 | 25.2 | 20.4 |
| Hand cycle | 5.2 | 0.8 | 19.2 | 21.7 |
| Inline skates | 6.4 | 1.6 | 35.6 | 38.5 |
| Kick scooter | 4.1 | 1.3 | 19.9 | 13.0 |
| Manual wheelchair | 2.3 | 1.2 | 8.5 | 0 |
| Power wheelchair | 3.1 | 1.2 | 10.2 | 0 |
| Recumbent bicycle | 8.2 | 1.2 | 33.2 | 46.7 |
| Segway | 4.6 | 1.8 | 16.1 | 0 |
| AASHTO bicycle | 8.9 | 1.5 | 38.7 | 49.8 |
The recumbent bicyclist would be the critical user for determining the minimum length of a crest vertical curve. For example, using the 85th percentile stopping distance and height of eye, the minimum length of a crest vertical curve with an algebraic difference in percent grade of 10 would be 46.7 m (153 ft).
In contrast, the AASHTO minimum length of a crest vertical curve for a bicycle with its presumed 38.6-m (127-ft) stopping sight distance is 49.8 m (163 ft). However, the FHWA study's observed stopping sight distances for bicyclists yields a required length of a crest vertical curve of only 20.4 m (67 ft) (on wet pavement).
Horizontal Alignment
The minimum clearance to an obstruction that should be provided along a horizontal curve is a function of the stopping sight distance and radius of the curve. The critical user for this dimension would be the inline skater. For example, using the 85th percentile stopping distance, the minimum offset required for a 15.8-m (50-ft) radius curve would be 3.4 m (11 ft).
In contrast, the AASHTO minimum offset for a bicyclist with its presumed 38.7-m (127-ft) stopping sight distance is 10.7 m (35 ft). However, using the observed 85th percentile stopping sight distance for bicyclists, 12.4 m (41 ft), yields a required length offset of only 1.3 m (4.1 ft).
Refuge Islands
When designing a path crossing of a roadway, refuge islands are frequently provided between opposing motor vehicle traffic flows to allow pathway users to cross only one direction of traffic at a time. AASHTO (p. 52) currently states that, with respect to this refuge, 2.0 m (6 ft) is "poor," 2.5 m (8 ft) is "satisfactory," and 3.0 m (10 ft) is "good."(29) However, recumbent bicycles, bicycles with trailers, and hand cycles all have 85th percentile lengths greater than 1.8 m (6 ft). The longest likely users, bicycles with trailers, exceeded 2.4 m (8 ft) in length and should be considered the critical users (figure 48).
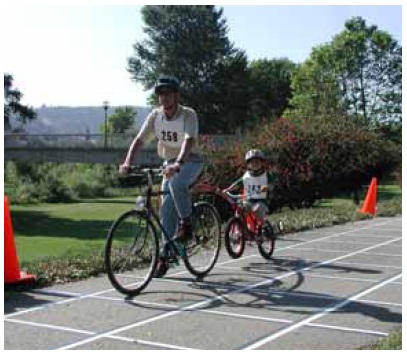
a. Adult bicyclist and child on trailer
Figure 48. The longest users observed in this study exceeded 2.4 m (8 ft) in length and should be considered the critical users.
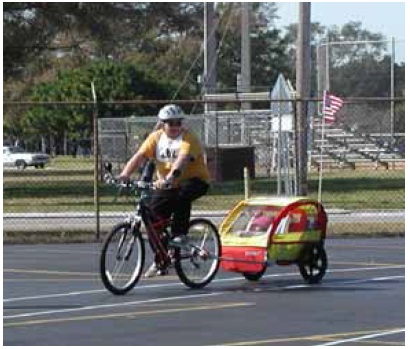
b. Adult bicyclist and covered trailer. bicycle.
Figure 48. The longest users observed in this study exceeded 2.4 m (8 ft) in length and should be considered the critical users.
29. American Association of State Highway and Transportation Officials. A Policy on Geometric Design of Highways and Streets. (commonly referred to as “Green Book”) American Association of State Highway and Transportation Officials, Washington, DC, 2001.
Signal Clearance Intervals
Signal clearance intervals are intended to allow those roadway users who are approaching a traffic signal that changes to yellow, and cannot stop before the signal turns red, time to enter and clear the intersection before the cross-street traffic is given a green light. Signal clearance intervals include both the yellow interval and any all-red interval. For motor vehicles, clearance intervals are typically a maximum of five seconds. Table 21 shows the number of seconds required for the 85th percentile user for various vehicular types to clear roadways of a given width. Additionally, the AASHTO calculated values (assuming acceleration rates of 1.2 m/sec2 (4 ft/sec2)) are shown. Manual wheelchair users had the longest 85th percentile clearance intervals (greater than those provided by the AASHTO assumptions), indicating that they would need the most time to clear the intersection.
Table 21. 85th percentile clearance intervals (sec).
| USER TYPE | WIDTH OF DEVICE PLUS WIDTH OF ROADWAY | |||
|---|---|---|---|---|
| 6.1 m | 12.2 m | 18.3 m | 24.4 m | |
| Bicycle | 4.85 | 5.53 | 6.21 | 6.89 |
| Hand cycle | 5.09 | 5.88 | 6.67 | 7.46 |
| Inline skates | 7.97 | 8.62 | 9.27 | 9.92 |
| Kick scooter | 7.53 | 8.55 | 9.56 | 10.58 |
| Manual wheelchair | 8.29 | 10.12 | 11.95 | 13.77 |
| Power wheelchair | 4.55 | 5.87 | 7.19 | 8.51 |
| Recumbent bicycle | 3.41 | 3.92 | 4.42 | 4.93 |
| Segway | 5.50 | 6.40 | 7.31 | 8.21 |
| AASHTO signal | 5.50 | 5.50 | 6.50 | 7.50 |
| Pedestrian clearance | 5.00 | 10.00 | 15.00 | 20.00 |
The kick scooter is the critical user with respect to clearance intervals for traffic signals if it is legal for kick scooters to operate on the street.
Pedestrian Clearance Intervals
Pedestrian clearance intervals are intended to allow pedestrians who begin crossing a signalized intersection before the beginning of the flashing DON'T WALK phase to completely cross the street before crossing traffic enters the intersection. Typically, pedestrian signals are timed for walking speeds of 1.2 m/sec (4 ft/sec). Manual wheelchair users are the critical users for pedestrian clearance intervals (table 21). A walking speed of less than 1.2 m/sec (4 ft/sec) should be considered in determining the pedestrian clearance time at crosswalks that are routinely used by slower pedestrians, including those who use wheelchairs.
Minimum Green Times
Figure 49. A hand cyclist.
The AASHTO equation addresses three factors in its calculation of minimum green time for signalized intersections: perception-reaction time, acceleration time, and travel time at the design speed. Perception-reaction time is assumed to be 2.5 seconds. The AASHTO equation assumes a constant acceleration rate; however, this research shows that the assumption is not accurate. After an initial increase to the acceleration rate, the rate decreases with increasing speed. Rather than produce an equation that compensates for the change in acceleration as speed increases, a table format has been used to represent the distance traveled as a function of time. Further, as many users were on "long" devices (for example, recumbent bicycles had an 85th percentile length of 208 cm (82 inches)), the length of the device is included in the travel distances in table 21 so that the times shown include the time that it takes for the user to accelerate from a stop and completely clear the length of his/her device from the intersection.
Hand cycles are the critical users to consider when determining the appropriate minimum green times for vehicular devices (table 11, figure 49).
Table 11. 85th percentile elapsed time (sec).
| USER TYPE | N | DISTANCE TRAVELED | |||
|---|---|---|---|---|---|
| 12.2 m | 24.4 m | 36.6 m | 48.8 m | ||
| Bicycle | 122 | 4.8 | 7.7 | 10.3 | 12.7 |
| Hand cycle | 33 | 6.6 | 10.6 | 14.6 | 17.9 |
| Inline skates | 21 | 4.7 | 7.6 | 10.4 | 12.8 |
| Kick scooter | 11 | 4.7 | 8.0 | 11.4 | 14.8 |
| Manual wheelchair | 9 | 8.1 | 15.4 | 22.8 | 30.0 |
| Recumbent bicycle | 6 | 3.3 | 6.1 | 8.5 | 9.7 |
| Segway | 4 | 4.5 | 7.8 | 10.7 | 13.9 |
| AASHTO calculation | 5.2 | 9.8 | 11.4 | 12.8 | |
| Pedestrian clearance | 10.0 | 20.0 | 30.0 | 40.0 | |
Segway Human Transporter
FHWA recently purchased a Segway device, and it was used on the Paint Branch Trail in Maryland. Several other Segway owners brought theirs out, as well (figures 50-52). The physical dimensions and operational characteristics of Segway device users were measured and collected along with all the other trail users. Table 22 shows how the Segway characteristics compare with those values of the design vehicle, the bicycle, in the AASHTO Guide for the Development of Bicycle Facilities.(2)
2. American Association of State Highway and Transportation Officials. Guide for the Development of Bicycle Facilities. American Association of State Highway and Transportation Officials, Washington, DC, 1999.
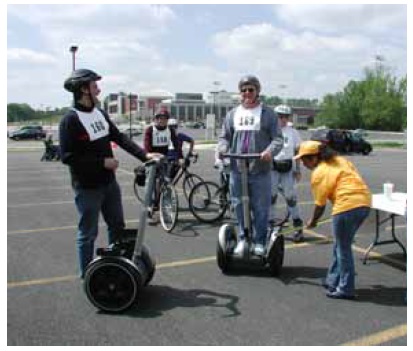
Figure 50. Segway users at the physical measurements station.
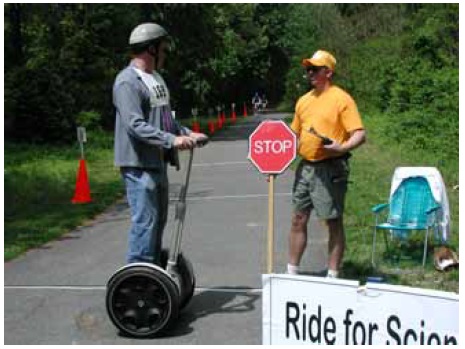
Figure 51. A Segway user on the Paint Brance Trail in Maryland.
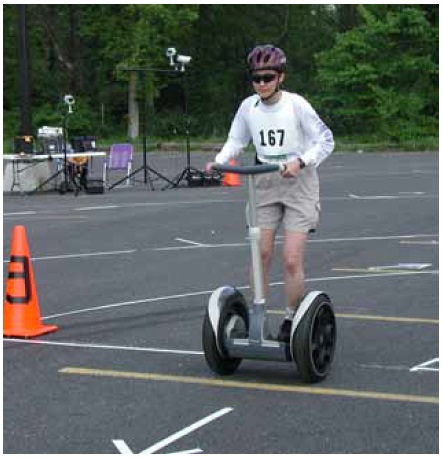
Figure 52. Segway in the turning radius station.
Figure 52. Segway in the turning radius station.
Table 22. Physical dimensions and operational characteristics of Segway users vs. AASHTO (bicycle) values.
| CHARACTERISTIC | SEGWAY (MIN-MAX VALUES) | AASHTO (BICYCLE) VALUE | COMMENT |
|---|---|---|---|
| Eye height (cm) (N=4) | 175-204 | 140 | |
| Length (cm) (N=4) | 56 | 180 | |
| Width (cm) (N=4) | 64 | 120 | |
| Acceleration rate from 0 to 12.2 m (m/sec2) (N=4) | 0.29-0.36 | 0.46-0.92 | |
| Acceleration rate from 12.2 to 24.4m (m/sec2) (N=4) | 0.49-0.98 | 0.46-0.92 | |
| Acceleration rate from 24.4 to 36.6 m (m/sec2) (N=4) | 0.05-0.12 | 0.46-0.92 | |
| Acceleration rate from 36.6 to 48.8 m (m/sec2) (N=4) | 0.03-0.95 | 0.46-0.92 | |
| Time to travel 12.2 m (sec) (N=4) | 4.1-4.6 | 5.2 | AASHTO value calculated with acc. rate of 1.5 ft/sec2 |
| Time to travel 24.4 m (sec) (N=4) | 6.6-7.8 | 9.8 | AASHTO value calculated with acc. rate of 1.5 ft/sec2 |
| Time to travel 36.6 m (sec) (N=4) | 8.7-11.1 | 11.4 | AASHTO value calculated with acc. rate of 1.5 ft/sec2 |
| Time to travel 48.8 m (sec) (N=4) | 10.9-14.7 | 12.8 | AASHTO value calculated with acc. rate of 1.5 ft/sec2 |
| Speed (km/h) (N=4) | 14-18 | 30 | |
| Perception-reaction time (sec) (N=5) | 0.6-2.0 | 1.5 | Research cited in AASHTO Green Book |
| Sweep width (m) (N=8) | 0.9-1.7 | 1.0 | AASHTO assumed bicycle operating space |
| Three-point turn (cm) (N=3) | 97-102 | 300 | AASHTO value is for two-directional trail |
| Friction factor, 3.1-m radius (N=5) | 0.27-0.31 | 0.32 | |
| Friction factor, 6.1-m radius (N=5) | 0.17-0.58 | 0.30 | |
| Friction factor, 9.2-m radius (N=5) | 0.11-0.31 | 0.29 | |
| Friction factor, 15.3-m radius (N=5) radius (N=5) | 0.09-0.17 | 0.26 | |
| Friction factor, 22.9-m radius (N=5) | 0.05-0.10 | 0.24 | |
| Friction factor, 27.5-m radius (N=5) | 0.04-0.10 | 0.23 |
1 cm = 0.39 inches
1 m = 3.28 ft
1 km = 0.621 mi
Many characteristics of the Segway are comparable to those of other emerging trail devices. Segways stand out with regard to a few characteristics, however. The following list gives 85th percentile values.
1. Segway users had higher eye heights (179 cm (71 inches)) than other user types. This is not surprising: Users are standing on the Segway itself while traveling. Inline skaters had the second highest eye height, 164 cm (65 inches) (table 7).
2. All four observed Segways had a length of 56 cm (22 inches). Compared to other devices, only inline skates had a shorter length (while at rest) (table 8).
3. All four observed Segways had a width of 64 cm (25 inches). This width is comparable to other devices (table 9).
4. The highest acceleration rates for Segways were measured between 12.2 and 24.4 m (40 and 80 ft); the value of 0.94 m/sec2 (3.09 ft/sec2) was at the high end of the 0.5 to 1.0 m/sec2 (1.5 to 3 ft/sec2) that AASHTO uses to calculate the minimum green time for bicyclists. For distances between 0 and 12.2 m (0 and 40 ft), and between 24.4 and 48.8 m (80 and 160 ft), Segways accelerated more slowly than the AASHTO values (table 10).
5. Segway users were most comparable to inline skaters and bicyclists in terms of the time required to travel distances of 12.2, 24.4 m, 36.6 m, and 48.8 m (40 ft, 80 ft, 120 ft, and 160 ft). They took roughly half the time of manual wheelchair users, but up to 43 percent more time than recumbent bicyclists (table 11).
6. The observed speed of 17 km/h (10 mi/h) was somewhat faster than kick scooters (15 km/h (9 mi/h)) and somewhat slower than golf carts (19 km/h (12 mi/h). It is also about half that of the 30 km/h (20 mi/h) design speed recommended by AASHTO (table 12).
7. The observed perception-reaction time was 1.5 seconds. This value is within 0.1 sec of the perception-reaction times for manual wheelchair users and inline skaters (table 14).
8. The Segway's braking distance of 3.1 m (10 ft) was the second shortest among devices; only manual wheelchairs had a shorter braking distance (1.7 m (6 ft)). It was also about half that of bicycles and hand cycles (table 15).
9. Segways were observed to decelerate faster (4.7 m/sec2 (16 ft/sec2)) than other user types. This is perhaps surprising, considering that Segways are not equipped with brakes; to stop the device, the user straightens up from the leaning position. Recumbent bicycles had the second fastest deceleration rate, 4.0 m/sec2 (13 ft/sec2) (table 16).
10. Sweep width (1.1 m (3.5 ft)) was most comparable to recumbent bicycles (1.1 m (3.5 ft)) and adult tricycles (1.0 m (3.4 ft)). It is less than half of AASHTO's recommended width of 3 m (10 ft) for a two-way shared use path, which means that a 3-m (10-ft path) is wide enough for two Segway users (or most other users) to pass each other in opposing directions (table 17).
11. The Segway required the least space to make a three-point turn (100 cm (39 inches)). The second narrowest was manual wheelchairs (146 cm (58 in)) (table 18).
12. For 6.1-m (20-ft) turning radii, Segways had the highest calculated tolerance for lateral acceleration (friction factor = 0.58), compared to other devices. This friction factor was also nearly double that recommended by AASHTO. For other turning radii, the friction factors for Segways were lower than those for bicycles and recumbent bicycles. The lowest friction factor (0.09) was associated with a 27.5-m (90-ft) turning radius, a value less than half of that recommended by AASHTO (table 19).
Time will tell whether the Segway catches on and becomes a common mode in transportation networks. The data from this study provide information into the performance and maneuverability of the Segway and how it might function within shared use paths, sidewalks, and streets.
RECOMMENDATIONS
The data collected for this study reveals that the appropriate design user for shared use paths may vary with respect to design criteria or a facility design element. Table 23 shows design features, AASHTO design values for bicyclists, potential design users, and 85th percentile performance values.
Table 23. Design criteria and potential design users.
| DESIGN FEATURE | AASHTO DESIGN VALUE (FOR BICYCLISTS) | POTENTIAL DESIGN USER | PERFORMANCE VALUE (85TH PERCENTILE) |
|---|---|---|---|
| Sweep width | 1.2 m | Inline skaters | 1.5 m |
| Horizontal alignment | 27 m | Recumbent bicyclists | 26.8 m |
| Stopping sight distance (wet pavement) | 38.7 m | Recumbent bicyclists | 32.7 m |
| Vertical alignment-crest | 49.8 m | Recumbent bicyclists | 46.7 m |
| Refuge islands | 2.5 m | Bicyclists with trailers | 3.0 m |
| Signal clearance intervals | 7.5 sec for a distance of 24.4 m | Kick scooters | 10.6 sec for a distance of 24.4 m |
| Minimum green times | 12.8 sec for a distance of 24.4 m | Hand cyclists | 17.9 sec for a distance of 24.4 m |
| Pedestrian clearance intervals | 20.0 sec for a distance of 24.4 m | Manual wheelchairs | 15.4 sec for a distance of 24.4 m |
1 m = 3.28 ft
It is worth noting that bicyclists (without trailers) do not appear as critical users for any of the design criteria. This is a major finding that may have a significant effect on how shared use paths and other components of the U.S. transportation system are designed, constructed, controlled, and maintained.
The data collected during this project suggest that several actions should be considered:
-
The results of this study should be disseminated to design professionals and shared use path operators for their review and comments.
-
A 1-day presentation should be made to, and discussed with, an expert panel of facility design engineers.
-
A new NHI course should be developed (or the existing courses should be significantly modified).
-
An interim FHWA design guide for shared use paths should be developed.
-
The AASHTO Guide for the Development of Bicycle Facilities should be updated to reflect this research's findings on bicycles.
-
An AASHTO document on shared use path design guidelines should be developed. For further details, see the following marketing plan.
MARKETING PLAN
The effectiveness and value of this research is largely dependent on its use by practitioners and policymakers making decisions about roadway and shared use path design and safety programs, respectively. Thus the goal of the marketing plan is to outline how to disseminate the information to transportation professionals, trail designers/coordinators, landscape architects, engineers, public works officials, and other professionals and policymakers. Data from the summary charts and formulas can be incorporated into the existing formats of national guidelines such as the AASHTO Green Book, ADAAG, and the AASHTO Guide for the Development of Bicycle Facilities, and other appropriate documents.
Since shared use paths, in particular, are designed by professionals from a variety of backgrounds, the marketing plan outlines methods of reaching various types of professionals through publications, journal articles, conference presentations, and other means. With that primary goal established, the first and foremost objective is to get the word out.
Getting the word out on this study is important for several reasons:
-
First, the data contain important information with myriad uses. The study provides immediately usable data by engineers who employ the various calculations to establish intersection sight triangles, vertical and horizontal curves, and numerous other features of the transportation environment.
-
Second, as stated in the previous section, this FHWA study has revealed that although currently the bicycle is used as the design vehicle for shared use path design, in many cases, the bicycle is probably not the appropriate design vehicle for many elements of a shared use path facility, nor is it for signalized intersections of streets. The design of signalized intersections and midblock (pedestrian and/or trail) crossings (both signalized and unsignalized) will be affected by the new information and findings of this study.
-
Consequently, and third, discussions of the results of this study with transportation professionals at the various recommended interactive marketing venues for this study (presentations, NHI courses, etc.) will create even more insight into what is the best way for planners, designers, engineers, and operators of shared use paths, streets, bicycle and sidewalk facilities, and midblock crossings to more safely accommodate the myriad existing and emerging users. Either a consensus on the design user or a methodology for that determination needs to be established quickly.
-
Finally, these important discussions and deliberations with practitioners will help clarify what is the most prudent way to modify the existing design guidebooks and/or create a separate one for shared use paths and related transportation facilities to help speed the process of ensuring that all designs will be safe and efficient for all users of transportation facilities.
Accordingly, this section of the Final Report outlines both the recommended marketing plan (table 24) as well as the needed elements for either revisions to NHI's bicycle and pedestrian facility design courses and the existing AASHTO design guidelines, or the creation of a totally new NHI course and a new AASHTO design guideline (for shared use paths).
Table 24. Marketing plan.
| DATE | VENUE | METHOD | WITHIN CURRENT SCOPE? | COMPLETED? |
|---|---|---|---|---|
| Aug 2003 | TRB Paper | Technical paper | Yes | Yes |
| ASAP | NHI Course | New NHI course development (or modification to both the bicycle and pedestrian facility design courses) (also incorporate results from the FHWA study "Operation of Shared Use Paths") | Yes / No | In progress |
| Jan 2004 | TRB Committee on Pedestrians A3B04 Comm. Mtg. | Slide presentation | Yes | Yes |
| Jan 2004 | TRB Committee on Bicycling A3B07 Comm. Mtg. | Slide presentation | Yes | Yes |
| Jan 2004 | TRB paper | Poster session | Yes | Yes |
| Jan 2004 | National Committee on Uniform Traffic Control Devices Manual on Uniform Traffic Control Devices | Presentation to subcommittee | No | Yes |
| Mar 2004 | Midwest Regional Bike/Ped Conference | Slide presentation | Yes | Yes |
| Jun 2004 | AASHTO Subcommittee on Design | Slide presentation | No | No |
| Aug 2004 | Institute for Traffic Engineers (ITE) Annual Meeting | Slide presentation | No | No |
| Sept 2004 | Nationwide State B/P Coordinators' Meeting | Slide presentation | No | No |
| Sept 2004 | Conference ProWalk / ProBike | Slide presentation | No | No |
| Sept 2004 | Association of Pedestrian and Bicycle Professionals (APBP) Seminar Series | Short course | No | No |
The slide presentation, a Microsoft® PowerPoint® file, outlines how the study developed; how the data collection plan was designed; how well the events ran; the variety of users, abilities, and ages in attendance; and the results and implications. A paper describing the study and findings was submitted to TRB and was presented at the 2004 Annual Meeting. Finally, outlined below are the recommended elements for either revisions to NHI's bicycle and pedestrian facility design courses and the existing AASHTO design guidelines, or the creation of a totally new NHI course and an AASHTO design guideline (for shared use paths). Examples of other venues through which this study can be publicized include:
-
Publications-ITE Journal, ITE Ped/Bike Council Newsletter
-
Web sites-www.walkinginfo.org, http://safety.fhwa.dot.gov/ped_bike/pedforum/index.cfm (FHWA Office of Safety's Pedestrian Forum Newsletter), http://www.fhwa.dot.gov/hep/index.htm (FHWA Office of Planning, Environment, and Realty).
-
E-mails to listservs-State Ped/Bike Coordinators, TRB Pedestrian Research Committee, ITE Ped/Bike Council, Pedestrian Rights of Way and Accessibility Committee, APBP, FHWA Field Safety Specialists, etc.
Design of Shared Use Paths, Street Intersections, and Midblock Crossings
This federally sponsored research reveals that in many cases, neither the bicycle nor the pedestrian is the design "vehicle" or user for shared use paths, their intersections with roadways, or for a host of other features throughout the transportation system of the United States. This is an important discovery, confirming what some professionals have suspected: that a number of our design guidelines need to be changed or expanded, and/or new ones added. This is an urgently needed action. Hundreds, if not thousands, of transportation facilities and signals are being designed and built today that do not, or will not, in the very near future, safely accommodate a growing number of nonmotorized users. While the above outlined presentations may help bring about a general awareness within the professional community of bicycle and pedestrian mode planners, they represent a small portion of the design professionals preparing designs and construction documents of signalized roadway and street intersections, midblock pedestrian signals, shared use paths, roads and streets, etc. These tens of thousands of design professionals need to be aware of the possible implications of this study on transportation system designs.
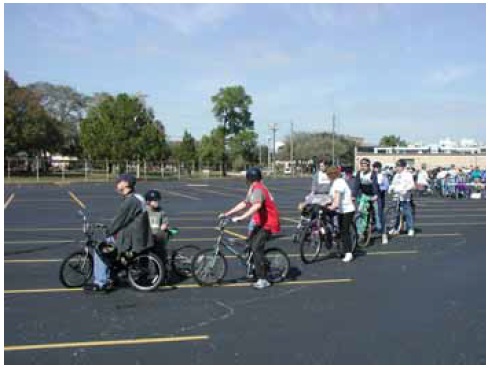
Figure 53. Many users of various ages and abilities participated in each "Ride for Science."
Furthermore, they need training on the proper design to safely accommodate the growing array of users of transportation facilities (figures 53 and 54), and the operational characteristics of persons using the expanding array of assistive devices.
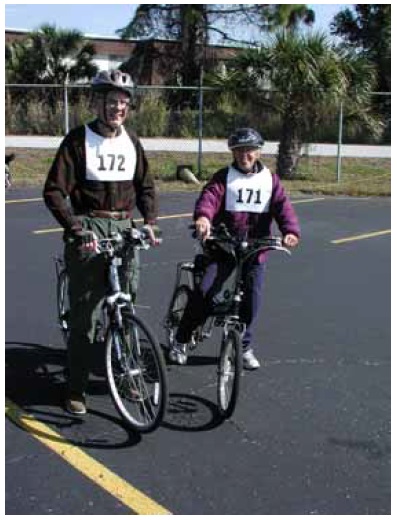
Figure 54. two "Ride for Science" participants.
Accordingly, either revisions are needed to NHI's bicycle and pedestrian facility design courses, the existing AASHTO design guidelines (A Policy on Geometric Design of Highways and Streets, Guide to the Development of Bicycle Facilities and the upcoming Pedestrian Facilities Design Guide) and FHWA's Manual on Uniform Traffic Control Devices (MUTCD), and/or the creation of a totally new NHI course and a new AASHTO design guideline (for shared use paths) should be created. The information could also be put into the revised Ped/Bike University Course. Regardless of the approach taken, certain recommended minimum elements are needed for courses/design guidelines to ensure the safe design and operation of transportation facilities serving nonmotorized users. The major sections that need to be included or referenced are:
1. Design Controls and Criteria.
2. Elements of Design.
3. Cross-sectional Elements.
4. At-grade Intersection Design.
5. Design of Grade-separated Crossings.
6. Sidewalks and "Sidepath" Design Guidance.
These sections are further detailed below.
1. Section 1 - Design Controls and Criteria
A. Function and Purpose of Shared Use Paths, Street Intersections, and Midblock Crossings
1. History of the Facility Types
2. Expectations of the Users
B. Design Users and Operational Characteristics
1. Population of Current and Emerging Users
2. Bicyclists
3. Pedestrians
4. Inline Skaters
5. Recumbents
6. Hand Cycles
7. Wheelchair Users
8. Canes, Walkers, and Related Ambulatory Devices
9. The Segway
10. Etc.
C. Facility Operation and Level of Service Concepts
1. Homogenous User Operation
2. Bicycle and Pedestrian Users
3. Mixed Flow
4. Street Intersections
5. Midblock Crossings
D. ADA Geometric Criteria
E. Speed
1. Operating Speed
2. Running Speed
3. Design Speed
2. Section 2 - Elements of Design
A. Sight Distance
1. Stopping Sight Distance
a. Reaction Time
b. Braking Distance
c. Design Values
2. Criteria for Measuring Sight Distance
a. User Eye Heights
b. Object Height
B. Horizontal Alignment
1. General Considerations
a. Superelevation
b. Friction Factors
2. Design Considerations
3. Sight Distance on Horizontal Curves
a. Stopping Sight Distance
b. Passing Sight Distance
C. Vertical Alignment
1. Grades
2. Vertical Curves
a. General Considerations
1. Population of Users
2. Critical Design User
3. Crest Vertical Curves
4. Sag Vertical Curves
5. Sight Distance at Undercrossings (Grade Separated Intersections)
3. Section 3 - Cross Section Elements
A. Pavement
B. Width
C. Shoulders and Sideslopes
1. Width and Slope of Shoulders
2. Horizontal Clearance to Obstructions
3. Sideslopes
D. (Traffic) Barriers and Railings
E. Cross Sections through Grade Separated Intersections
4. Section 4 - At-Grade Intersections
A. General Design Considerations and Objectives
B. Operational Capabilities of Users
1. Acceleration
2. Gap Acceptance
3. Future Trends in Capabilities
C. Types and Examples of Intersections
1. Signalized Street Intersections
2. Midblock Crossings
D. Assignment of Priority
1. Yield
2. Stop
3. Signalized Control
E. Intersection Sight Distance
1. Path / Path intersections
a. Sight Triangles
1. Approach Sight Triangles
2. Departure Sight Triangles
b. Intersection Control
2. Roadway / Path (Midblock) Intersections
a. Sight Triangles
1. Approach Sight Triangles
2. Departure Sight Triangles
b. Median Refuges
c. Alternative Routing of Shared Use Path
F. Ramps and Vertical Design Considerations
G. Treatments through Interchange Areas
H. Crossing Safety Intervention Measures
5. Section 5 - Grade Separated Intersections
A. Warrant Guidelines for Grade Separation
B. Overpass versus Underpass Structures
C. Lateral and Vertical Clearances
D. Approaches (e.g., Ramps and Elevators)
6. Section 6 - Sidewalks and Sidepaths
A. Introduction and History
B. Crash Statistics
C. The Conflicts and Confusion
D. The Limited Applications and Design Guidelines
APPENDIX
State Crash Form Coordinator Survey
FHWA has funded a research project to determine the safety and operational characteristics of newer or emerging users of our Nation's roadways and trails. These include persons using inline skates, scooters, strollers, electric bicycles, adult tricycles, recumbents, tandems, trailers, golf carts, and assisting technologies such as electric scooters and motorized wheelchairs. As part of the project, we are trying to identify which States collect motor vehicle crash data on some or all of these various user groups.
We obtained your name and contact information from NHTSA's State Crash Forms Catalogue Web site: http://www.nhtsa.dot.gov/people/perform/trafrecords/crash/pages/coordinators.htm.
We would very much appreciate your taking a few minutes to provide us updated information on crash data collected by your State. Responses can be entered directly into the e-mail using the "Reply" feature. Alternatively, the e-mail can be printed and responses faxed to [contractor fax], attention [contractor contact]. If someone else can better respond to this e-mail, please forward it to them. If you have any comments or questions, please call [additional contractor contact] at [additional contractor fax].
Thank you very much for your assistance. Below are our three questions. We look forward to hearing from you.
1. Please identify which, if any, of the following user groups can be identified on your computerized crash database:
Yes No
__ __ Inline skates
__ __ Skateboards
__ __ Scooters (nonmotorized)
__ __ Scooters (motorized)
2a. Does your State computerize any narrative description of the crash, either full descriptions or key words?
2b. If so, is there a way to search this database to identify potentially relevant crash reports (involving the above users)?
__ Nonstandard bicycle types (recumbents, electric, tandems)
__ Adult tricycles
__ Hand cycles
__ Bicycle trailers
__ Golf carts
__ Wheelchairs (manual or powered)
__ Assistive powered scooters
__ Racing wheelchairs
3. Are you aware of any efforts in your State to use available crash data to study the safety of any of these emerging user groups (not including standard bicycles)?
Thank you very much for taking time to answer these questions. If you have any additional comments, please include them below.
ACKNOWLEDGMENTS
This research was funded by FHWA. Ms. Ann Do is the Contracting Officer's Technical Representative. The authors would like to thank the many research staff, FHWA staff, and volunteers who assisted with or participated in the data collection events in California, Florida, and Maryland (figure 55). The views and opinions expressed in this report are those of the authors and do not necessarily represent those of FHWA.
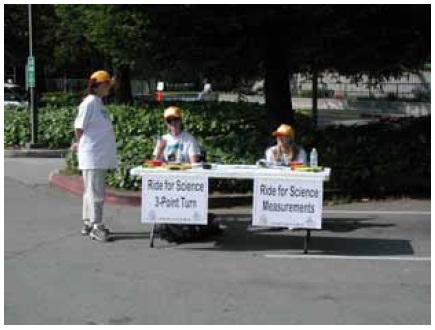
Figure 55. Many volunteers assisted with the "Ride for Science" events
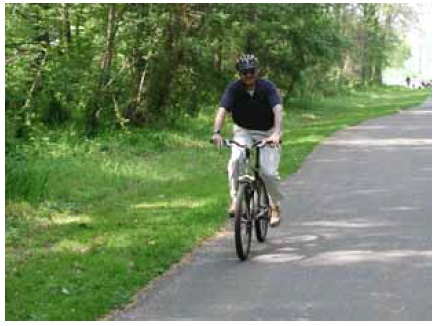
Figure 56. Many volunteers participated in the "Ride for Science" events.
User Comments/Questions
Add Comment/Question