DISCUSSION
This research shows that there is a great diversity in the operating characteristics of various road and trail user types (figure 46). To ensure the safe accommodation of emerging types of road and trail users, their operating characteristics must be considered in the development of design criteria; in some cases, it may be prudent to use an emerging user instead of the bicycle as the design user.
The AASHTO Guide for the Development of Bicycle Facilities is the primary reference for designers of shared use facilities and has been adopted as standard for shared use path design by many jurisdictions around the United States.(2) The standards contained therein were developed using the operational characteristics of the bicycle to determine design criteria. While this research is not intended to validate or discredit the AASHTO criteria, comparisons to AASHTO are appropriate because of its status as a national guide.
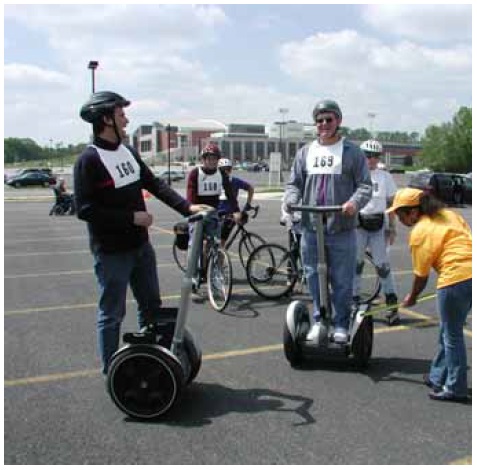
Figure 46. Trail users have diverse operating characteristics.
2. American Association of State Highway and Transportation Officials. Guide for the Development of Bicycle Facilities. American Association of State Highway and Transportation Officials, Washington, DC, 1999.
Bike Lane Width
The AASHTO Guide for the Development of Bicycle Facilities (p. 22) recommends a minimum width for bike lanes of 1.2 m (4 ft).(2) While this dimension appears to be adequate to accommodate most bicyclists, the 85th percentile sweep width for inline skaters exceeds this width.
2. American Association of State Highway and Transportation Officials. Guide for the Development of Bicycle Facilities. American Association of State Highway and Transportation Officials, Washington, DC, 1999.
Path Width
AASHTO (pp. 35-36) recommends a minimum path width of 3 m (10 ft), notwithstanding the procedures given in the Highway Capacity Manual for calculating the number and effects of passing events.(26) The AASHTO recommendation does not explicitly account for user volumes and passing hindrance resulting from user encounters. AASHTO recommends a greater width if there is a substantial use by a mix of users. In a few instances, a lower width may be adequate.
Section 4.2.1 of the ADAAG requires a minimum clear width of 0.815 m (32 inches) at a point, and 0.915 m (36 inches) continuously, for single wheelchair passage. All of the "solo" manual and power wheelchair users (i.e., not accompanied by a dog or pulling another wheelchair) had sweep widths of 0.69 m (27 inches) or less, and would therefore be accommodated by ADAAG.
In addition, Section 4.2.2 of the ADAAG requires that the minimum width for two wheelchairs to pass is 1.525 m (60 inches). This assumes that both wheelchair users are traveling in parallel paths to each other and to the edges of the path.
With respect to sweep width, the critical user is the inline skater. With 85th percentile sweep widths of 1.51 m (4.96 ft), two individuals passing in opposite directions would only just fit a 3m (10-foot) wide path. Additionally, this research only addressed individual users. Users traveling abreast in pairs or groups would likely require additional space. Examples of these include parents and children together, a wheelchair user with his/her dog, and a runner who is visually impaired with a lead.
Several user types, including bicycles, recumbent bicycles, and hand cycles, required more than 3 m (10 ft) of width (at the 85th percentile level) to execute a three-point turn. Hand cyclists are the critical users, requiring 5.40 m (17.8 ft) (at the 85th percentile level) to perform a three-point turn and not having other options for completing a shorter radius turn.
26. Transportation Research Board. Highway Capacity Manual 2000. Transportation Research Board, National Academy of Sciences, Washington, DC, 2000.
Design Speed
The selected design speed of a facility affects many aspects of geometric design. Consequently, it can significantly impact the cost, constructability, and operational safety of a project. The AASHTO Guide for the Development of Bicycle Facilities (p. 36) specifies 30 km/h (20 mi/h) as the minimum design speed that should be used on shared use paths (figure 47).(2) It goes on to provide modifiers for grades and strong prevailing winds.
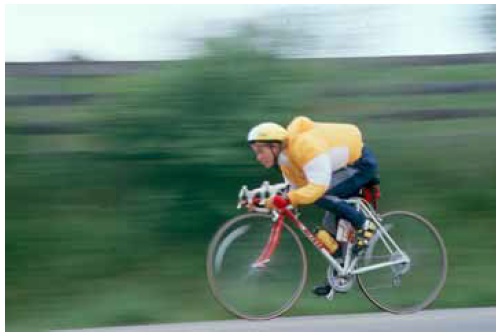
Figure 47. AASHTO's design bicyclist travels at 30 km/h (20 mi/h).
(Photo by Dan Burden.)
Of the bicyclist participants in this research project, only four, or 1 percent, exceeded the suggested 30-km/h (20-mi/h) design speed. The 85th percentile speed for bicyclists was 22 km/h (14 mi/h). This suggests that the 30-km/h (20-mi/h) design speed may be conservative; however, further research is needed.
Recumbent bicyclists had the highest observed 85th percentile speeds, 29 km/h (18 mi/h). This may suggest that they may be the appropriate user upon which to set a minimum design speed. However, as discussed in the following sections, the additional design characteristics of the various users need to be evaluated before such a conclusion can be drawn.
At the other extreme, hand cyclists appear to have the lowest 15th percentile speed, 8 km/h (5 mi/h), of those users who would be expected to operate in the street. Strollers had the lowest 15th percentile speed, 4 km/h (3 mi/h) (table 12).
2. American Association of State Highway and Transportation Officials. Guide for the Development of Bicycle Facilities. American Association of State Highway and Transportation Officials, Washington, DC, 1999.
Horizontal Alignment
For horizontal alignment, the critical factor is the point at which users will instinctively decelerate to maintain a comfortable degree of lateral acceleration while traversing a curve. This point is represented by the coefficient of friction used in the minimum design radius equations of AASHTO. When evaluating the coefficient of friction, it is important to remember that it does not truly represent the point at which a tire will slide out from under the path user, rather, it is a comfort factor. This is not to suggest that the coefficient of friction should be regarded lightly. Indeed, if a curve is so sharp as to make a path user uncomfortable, the user may understeer and run off the side of the path.
As shown in table 19, users of manual wheelchairs tolerated the lowest degree of lateral acceleration, "coefficients of friction." However, given that their 85th percentile speed is 8 km/h (5 mi/h), the minimum radius required for manual wheelchair users would be 12.2 m (40 ft). Recumbent bicycles, though having the highest calculated tolerance for lateral acceleration (coefficients of friction) for 3.1-m and 9.2-m (10- and 30-ft) radii, also have the highest 85th percentile speeds. The minimum radius calculated for the 85th percentile recumbent bicycle is 26.8 m (88 ft). As a result, recumbent bicycles would be the critical design user for turning radii.
Most users did not appear to reduce their speeds when entering radii greater than 15.8 m (50 ft). The exception is recumbent bicyclists, who may have been constrained by even the 27.5-m (90ft) radius.
AASHTO (p. 38) currently recommends a minimum radius of 27 m (90 ft) for cyclists traveling at 30 km/h (20 mi/h) around a curve with a 2 percent superelevation.(2)
2. American Association of State Highway and Transportation Officials. Guide for the Development of Bicycle Facilities. American Association of State Highway and Transportation Officials, Washington, DC, 1999.
Stopping Sight Distance
Adequate sight distance is required to provide path users ample opportunity to see and react to the unexpected. The distance required for a user to come to a complete stop, stopping sight distance, is a function of the user's perception and brake reaction time, initial speed, the coefficient of friction between the user's wheels and the pavement, and the braking ability of the user's device.
The critical trail user for stopping sight distance is the recumbent bicyclist. For wet pavement, AASHTO assumes the friction factor is half that of dry pavement. Although this would not affect the reaction time, it would double the braking distance. The calculated stopping sight distance on wet pavement would be 32.7 m (107 ft). In comparison, AASHTO currently recommends a stopping sight distance of 38.7 m (127 ft) for a bicyclist traveling at the recommended design speed of 30 km/h (20 mi/h) in a wet pavement condition (i.e., coefficient of friction considered to be half of dry pavement).
Vertical Alignment-Crest Vertical Curves
A crest vertical curve is present when a shared use path (or a roadway) goes uphill and then goes downhill. The minimum length for a crest vertical curve is a function of the stopping sight distance, the algebraic difference in the upgrade and downgrade grades, the assumed height of an object on the pavement, and the user's eye height. The AASHTO Green Book (p. 271) gives equations for calculating the minimum length of a crest vertical curve so that adequate sight distance is available, as shown below.(29)
Case 1-Sight distance greater than length of vertical curve (S>L)
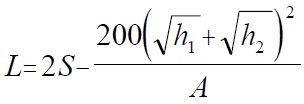
(9)
Case 2-Sight distance less than lenght of vertical curve (S>L)
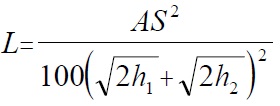
(10)
For both equations,
L = length of vertical curve (ft)
S = sight distance (ft)
A = algebraic difference in grades (percent)
h1 = height of eye (ft)
h2 = height of object (ft)
The AASHTO Guide for the Development of Bicycle Facilities (p. 36) recommends a maximum grade of 5 percent.(2) With higher grades, many bicyclists may have difficulty climbing and they may end up going downhill too fast for comfort or safe operation. A maximum grade of 5 percent also provides usable conditions for pedestrians in wheelchairs, whereas steeper grades do not. An uphill grade of 5 percent followed by a downhill grade of 5 percent results in a difference in grades of 10 percent.
Table 20 shows the calculated minimum length of crest vertical curve for each user type, using the values of "A" (the algebraic difference in grades) as described above. In addition, the sight distance was obtained by calculating the distance traveled during the perception-reaction time (using the 85th percentile observed speeds from the speed station) to the calculated braking distance under wet pavement conditions. Because the friction factor on wet pavement is one-half that on dry pavement, the 85th percentile observed braking distances were doubled to obtain the "wet" braking distances. The height of eye is the 85th percentile eye height for each user type. The height of object is zero.
Table 20. Minimum length of crest vertical curve.
| USER TYPE | 85TH PER SPEED (m/sec) | 85TH PER EYE HEIGHT (m) | STOPPING DISTANCE (m) | LENGTH OF VERTICAL CURVE (m) |
|---|---|---|---|---|
| Bicycle | 6.1 | 1.5 | 25.2 | 20.4 |
| Hand cycle | 5.2 | 0.8 | 19.2 | 21.7 |
| Inline skates | 6.4 | 1.6 | 35.6 | 38.5 |
| Kick scooter | 4.1 | 1.3 | 19.9 | 13.0 |
| Manual wheelchair | 2.3 | 1.2 | 8.5 | 0 |
| Power wheelchair | 3.1 | 1.2 | 10.2 | 0 |
| Recumbent bicycle | 8.2 | 1.2 | 33.2 | 46.7 |
| Segway | 4.6 | 1.8 | 16.1 | 0 |
| AASHTO bicycle | 8.9 | 1.5 | 38.7 | 49.8 |
The recumbent bicyclist would be the critical user for determining the minimum length of a crest vertical curve. For example, using the 85th percentile stopping distance and height of eye, the minimum length of a crest vertical curve with an algebraic difference in percent grade of 10 would be 46.7 m (153 ft).
In contrast, the AASHTO minimum length of a crest vertical curve for a bicycle with its presumed 38.6-m (127-ft) stopping sight distance is 49.8 m (163 ft). However, the FHWA study's observed stopping sight distances for bicyclists yields a required length of a crest vertical curve of only 20.4 m (67 ft) (on wet pavement).
Horizontal Alignment
The minimum clearance to an obstruction that should be provided along a horizontal curve is a function of the stopping sight distance and radius of the curve. The critical user for this dimension would be the inline skater. For example, using the 85th percentile stopping distance, the minimum offset required for a 15.8-m (50-ft) radius curve would be 3.4 m (11 ft).
In contrast, the AASHTO minimum offset for a bicyclist with its presumed 38.7-m (127-ft) stopping sight distance is 10.7 m (35 ft). However, using the observed 85th percentile stopping sight distance for bicyclists, 12.4 m (41 ft), yields a required length offset of only 1.3 m (4.1 ft).
Refuge Islands
When designing a path crossing of a roadway, refuge islands are frequently provided between opposing motor vehicle traffic flows to allow pathway users to cross only one direction of traffic at a time. AASHTO (p. 52) currently states that, with respect to this refuge, 2.0 m (6 ft) is "poor," 2.5 m (8 ft) is "satisfactory," and 3.0 m (10 ft) is "good."(29) However, recumbent bicycles, bicycles with trailers, and hand cycles all have 85th percentile lengths greater than 1.8 m (6 ft). The longest likely users, bicycles with trailers, exceeded 2.4 m (8 ft) in length and should be considered the critical users (figure 48).
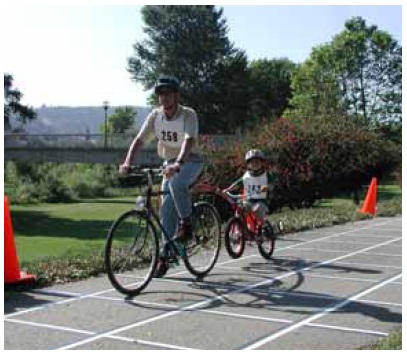
a. Adult bicyclist and child on trailer
Figure 48. The longest users observed in this study exceeded 2.4 m (8 ft) in length and should be considered the critical users.
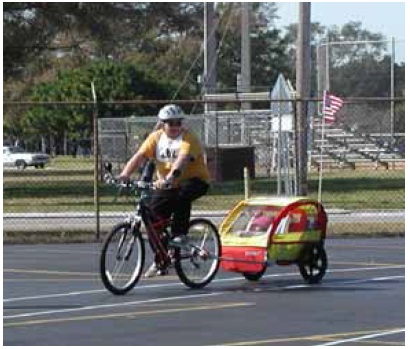
b. Adult bicyclist and covered trailer. bicycle.
Figure 48. The longest users observed in this study exceeded 2.4 m (8 ft) in length and should be considered the critical users.
29. American Association of State Highway and Transportation Officials. A Policy on Geometric Design of Highways and Streets. (commonly referred to as “Green Book”) American Association of State Highway and Transportation Officials, Washington, DC, 2001.
Signal Clearance Intervals
Signal clearance intervals are intended to allow those roadway users who are approaching a traffic signal that changes to yellow, and cannot stop before the signal turns red, time to enter and clear the intersection before the cross-street traffic is given a green light. Signal clearance intervals include both the yellow interval and any all-red interval. For motor vehicles, clearance intervals are typically a maximum of five seconds. Table 21 shows the number of seconds required for the 85th percentile user for various vehicular types to clear roadways of a given width. Additionally, the AASHTO calculated values (assuming acceleration rates of 1.2 m/sec2 (4 ft/sec2)) are shown. Manual wheelchair users had the longest 85th percentile clearance intervals (greater than those provided by the AASHTO assumptions), indicating that they would need the most time to clear the intersection.
Table 21. 85th percentile clearance intervals (sec).
| USER TYPE | WIDTH OF DEVICE PLUS WIDTH OF ROADWAY | |||
|---|---|---|---|---|
| 6.1 m | 12.2 m | 18.3 m | 24.4 m | |
| Bicycle | 4.85 | 5.53 | 6.21 | 6.89 |
| Hand cycle | 5.09 | 5.88 | 6.67 | 7.46 |
| Inline skates | 7.97 | 8.62 | 9.27 | 9.92 |
| Kick scooter | 7.53 | 8.55 | 9.56 | 10.58 |
| Manual wheelchair | 8.29 | 10.12 | 11.95 | 13.77 |
| Power wheelchair | 4.55 | 5.87 | 7.19 | 8.51 |
| Recumbent bicycle | 3.41 | 3.92 | 4.42 | 4.93 |
| Segway | 5.50 | 6.40 | 7.31 | 8.21 |
| AASHTO signal | 5.50 | 5.50 | 6.50 | 7.50 |
| Pedestrian clearance | 5.00 | 10.00 | 15.00 | 20.00 |
The kick scooter is the critical user with respect to clearance intervals for traffic signals if it is legal for kick scooters to operate on the street.
Pedestrian Clearance Intervals
Pedestrian clearance intervals are intended to allow pedestrians who begin crossing a signalized intersection before the beginning of the flashing DON'T WALK phase to completely cross the street before crossing traffic enters the intersection. Typically, pedestrian signals are timed for walking speeds of 1.2 m/sec (4 ft/sec). Manual wheelchair users are the critical users for pedestrian clearance intervals (table 21). A walking speed of less than 1.2 m/sec (4 ft/sec) should be considered in determining the pedestrian clearance time at crosswalks that are routinely used by slower pedestrians, including those who use wheelchairs.
Minimum Green Times
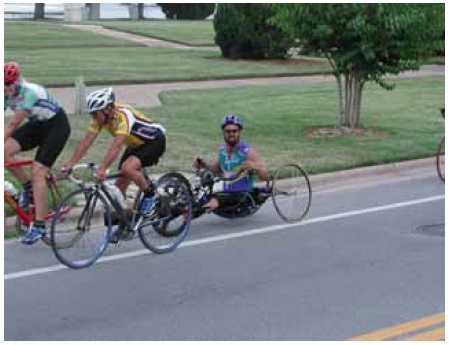
Figure 49. A hand cyclist.
The AASHTO equation addresses three factors in its calculation of minimum green time for signalized intersections: perception-reaction time, acceleration time, and travel time at the design speed. Perception-reaction time is assumed to be 2.5 seconds. The AASHTO equation assumes a constant acceleration rate; however, this research shows that the assumption is not accurate. After an initial increase to the acceleration rate, the rate decreases with increasing speed. Rather than produce an equation that compensates for the change in acceleration as speed increases, a table format has been used to represent the distance traveled as a function of time. Further, as many users were on "long" devices (for example, recumbent bicycles had an 85th percentile length of 208 cm (82 inches)), the length of the device is included in the travel distances in table 21 so that the times shown include the time that it takes for the user to accelerate from a stop and completely clear the length of his/her device from the intersection.
Hand cycles are the critical users to consider when determining the appropriate minimum green times for vehicular devices (table 11, figure 49).
Table 11. 85th percentile elapsed time (sec).
| USER TYPE | N | DISTANCE TRAVELED | |||
|---|---|---|---|---|---|
| 12.2 m | 24.4 m | 36.6 m | 48.8 m | ||
| Bicycle | 122 | 4.8 | 7.7 | 10.3 | 12.7 |
| Hand cycle | 33 | 6.6 | 10.6 | 14.6 | 17.9 |
| Inline skates | 21 | 4.7 | 7.6 | 10.4 | 12.8 |
| Kick scooter | 11 | 4.7 | 8.0 | 11.4 | 14.8 |
| Manual wheelchair | 9 | 8.1 | 15.4 | 22.8 | 30.0 |
| Recumbent bicycle | 6 | 3.3 | 6.1 | 8.5 | 9.7 |
| Segway | 4 | 4.5 | 7.8 | 10.7 | 13.9 |
| AASHTO calculation | 5.2 | 9.8 | 11.4 | 12.8 | |
| Pedestrian clearance | 10.0 | 20.0 | 30.0 | 40.0 | |
Segway Human Transporter
FHWA recently purchased a Segway device, and it was used on the Paint Branch Trail in Maryland. Several other Segway owners brought theirs out, as well (figures 50-52). The physical dimensions and operational characteristics of Segway device users were measured and collected along with all the other trail users. Table 22 shows how the Segway characteristics compare with those values of the design vehicle, the bicycle, in the AASHTO Guide for the Development of Bicycle Facilities.(2)
2. American Association of State Highway and Transportation Officials. Guide for the Development of Bicycle Facilities. American Association of State Highway and Transportation Officials, Washington, DC, 1999.
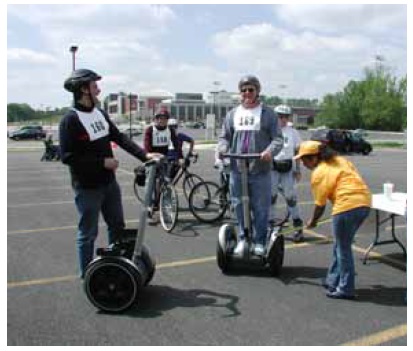
Figure 50. Segway users at the physical measurements station.
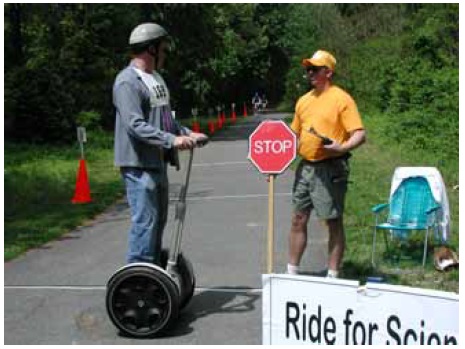
Figure 51. A Segway user on the Paint Brance Trail in Maryland.
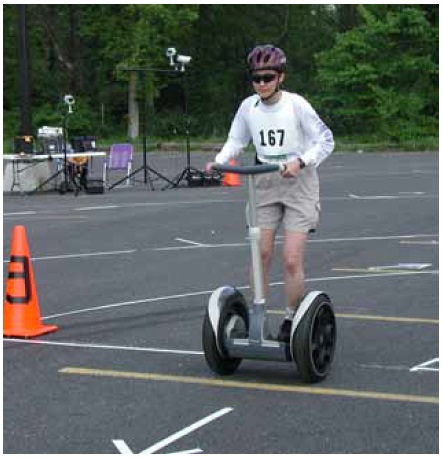
Figure 52. Segway in the turning radius station.
Figure 52. Segway in the turning radius station.
Table 22. Physical dimensions and operational characteristics of Segway users vs. AASHTO (bicycle) values.
| CHARACTERISTIC | SEGWAY (MIN-MAX VALUES) | AASHTO (BICYCLE) VALUE | COMMENT |
|---|---|---|---|
| Eye height (cm) (N=4) | 175-204 | 140 | |
| Length (cm) (N=4) | 56 | 180 | |
| Width (cm) (N=4) | 64 | 120 | |
| Acceleration rate from 0 to 12.2 m (m/sec2) (N=4) | 0.29-0.36 | 0.46-0.92 | |
| Acceleration rate from 12.2 to 24.4m (m/sec2) (N=4) | 0.49-0.98 | 0.46-0.92 | |
| Acceleration rate from 24.4 to 36.6 m (m/sec2) (N=4) | 0.05-0.12 | 0.46-0.92 | |
| Acceleration rate from 36.6 to 48.8 m (m/sec2) (N=4) | 0.03-0.95 | 0.46-0.92 | |
| Time to travel 12.2 m (sec) (N=4) | 4.1-4.6 | 5.2 | AASHTO value calculated with acc. rate of 1.5 ft/sec2 |
| Time to travel 24.4 m (sec) (N=4) | 6.6-7.8 | 9.8 | AASHTO value calculated with acc. rate of 1.5 ft/sec2 |
| Time to travel 36.6 m (sec) (N=4) | 8.7-11.1 | 11.4 | AASHTO value calculated with acc. rate of 1.5 ft/sec2 |
| Time to travel 48.8 m (sec) (N=4) | 10.9-14.7 | 12.8 | AASHTO value calculated with acc. rate of 1.5 ft/sec2 |
| Speed (km/h) (N=4) | 14-18 | 30 | |
| Perception-reaction time (sec) (N=5) | 0.6-2.0 | 1.5 | Research cited in AASHTO Green Book |
| Sweep width (m) (N=8) | 0.9-1.7 | 1.0 | AASHTO assumed bicycle operating space |
| Three-point turn (cm) (N=3) | 97-102 | 300 | AASHTO value is for two-directional trail |
| Friction factor, 3.1-m radius (N=5) | 0.27-0.31 | 0.32 | |
| Friction factor, 6.1-m radius (N=5) | 0.17-0.58 | 0.30 | |
| Friction factor, 9.2-m radius (N=5) | 0.11-0.31 | 0.29 | |
| Friction factor, 15.3-m radius (N=5) radius (N=5) | 0.09-0.17 | 0.26 | |
| Friction factor, 22.9-m radius (N=5) | 0.05-0.10 | 0.24 | |
| Friction factor, 27.5-m radius (N=5) | 0.04-0.10 | 0.23 |
1 cm = 0.39 inches
1 m = 3.28 ft
1 km = 0.621 mi
Many characteristics of the Segway are comparable to those of other emerging trail devices. Segways stand out with regard to a few characteristics, however. The following list gives 85th percentile values.
1. Segway users had higher eye heights (179 cm (71 inches)) than other user types. This is not surprising: Users are standing on the Segway itself while traveling. Inline skaters had the second highest eye height, 164 cm (65 inches) (table 7).
2. All four observed Segways had a length of 56 cm (22 inches). Compared to other devices, only inline skates had a shorter length (while at rest) (table 8).
3. All four observed Segways had a width of 64 cm (25 inches). This width is comparable to other devices (table 9).
4. The highest acceleration rates for Segways were measured between 12.2 and 24.4 m (40 and 80 ft); the value of 0.94 m/sec2 (3.09 ft/sec2) was at the high end of the 0.5 to 1.0 m/sec2 (1.5 to 3 ft/sec2) that AASHTO uses to calculate the minimum green time for bicyclists. For distances between 0 and 12.2 m (0 and 40 ft), and between 24.4 and 48.8 m (80 and 160 ft), Segways accelerated more slowly than the AASHTO values (table 10).
5. Segway users were most comparable to inline skaters and bicyclists in terms of the time required to travel distances of 12.2, 24.4 m, 36.6 m, and 48.8 m (40 ft, 80 ft, 120 ft, and 160 ft). They took roughly half the time of manual wheelchair users, but up to 43 percent more time than recumbent bicyclists (table 11).
6. The observed speed of 17 km/h (10 mi/h) was somewhat faster than kick scooters (15 km/h (9 mi/h)) and somewhat slower than golf carts (19 km/h (12 mi/h). It is also about half that of the 30 km/h (20 mi/h) design speed recommended by AASHTO (table 12).
7. The observed perception-reaction time was 1.5 seconds. This value is within 0.1 sec of the perception-reaction times for manual wheelchair users and inline skaters (table 14).
8. The Segway's braking distance of 3.1 m (10 ft) was the second shortest among devices; only manual wheelchairs had a shorter braking distance (1.7 m (6 ft)). It was also about half that of bicycles and hand cycles (table 15).
9. Segways were observed to decelerate faster (4.7 m/sec2 (16 ft/sec2)) than other user types. This is perhaps surprising, considering that Segways are not equipped with brakes; to stop the device, the user straightens up from the leaning position. Recumbent bicycles had the second fastest deceleration rate, 4.0 m/sec2 (13 ft/sec2) (table 16).
10. Sweep width (1.1 m (3.5 ft)) was most comparable to recumbent bicycles (1.1 m (3.5 ft)) and adult tricycles (1.0 m (3.4 ft)). It is less than half of AASHTO's recommended width of 3 m (10 ft) for a two-way shared use path, which means that a 3-m (10-ft path) is wide enough for two Segway users (or most other users) to pass each other in opposing directions (table 17).
11. The Segway required the least space to make a three-point turn (100 cm (39 inches)). The second narrowest was manual wheelchairs (146 cm (58 in)) (table 18).
12. For 6.1-m (20-ft) turning radii, Segways had the highest calculated tolerance for lateral acceleration (friction factor = 0.58), compared to other devices. This friction factor was also nearly double that recommended by AASHTO. For other turning radii, the friction factors for Segways were lower than those for bicycles and recumbent bicycles. The lowest friction factor (0.09) was associated with a 27.5-m (90-ft) turning radius, a value less than half of that recommended by AASHTO (table 19).
Time will tell whether the Segway catches on and becomes a common mode in transportation networks. The data from this study provide information into the performance and maneuverability of the Segway and how it might function within shared use paths, sidewalks, and streets.
User Comments/Questions
Add Comment/Question