Segway Human Transporter
FHWA recently purchased a Segway device, and it was used on the Paint Branch Trail in Maryland. Several other Segway owners brought theirs out, as well (figures 50-52). The physical dimensions and operational characteristics of Segway device users were measured and collected along with all the other trail users. Table 22 shows how the Segway characteristics compare with those values of the design vehicle, the bicycle, in the AASHTO Guide for the Development of Bicycle Facilities.(2)
2. American Association of State Highway and Transportation Officials. Guide for the Development of Bicycle Facilities. American Association of State Highway and Transportation Officials, Washington, DC, 1999.
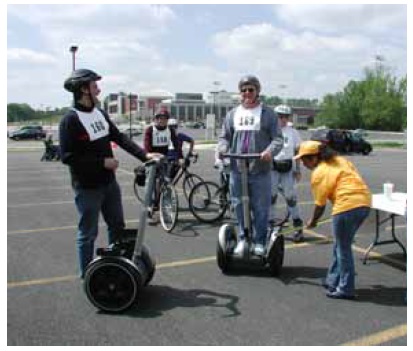
Figure 50. Segway users at the physical measurements station.
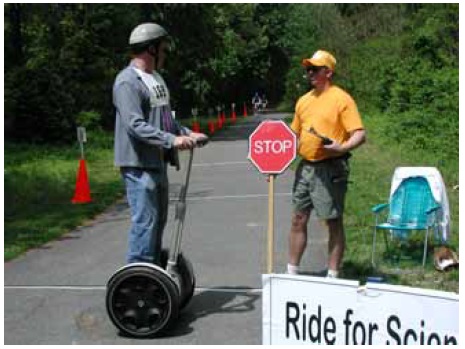
Figure 51. A Segway user on the Paint Brance Trail in Maryland.
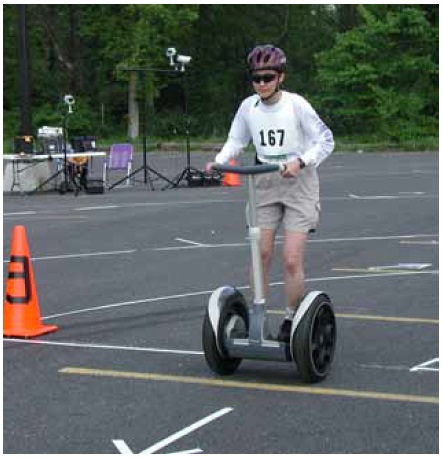
Figure 52. Segway in the turning radius station.
Figure 52. Segway in the turning radius station.
Table 22. Physical dimensions and operational characteristics of Segway users vs. AASHTO (bicycle) values.
| CHARACTERISTIC | SEGWAY (MIN-MAX VALUES) | AASHTO (BICYCLE) VALUE | COMMENT |
|---|---|---|---|
| Eye height (cm) (N=4) | 175-204 | 140 | |
| Length (cm) (N=4) | 56 | 180 | |
| Width (cm) (N=4) | 64 | 120 | |
| Acceleration rate from 0 to 12.2 m (m/sec2) (N=4) | 0.29-0.36 | 0.46-0.92 | |
| Acceleration rate from 12.2 to 24.4m (m/sec2) (N=4) | 0.49-0.98 | 0.46-0.92 | |
| Acceleration rate from 24.4 to 36.6 m (m/sec2) (N=4) | 0.05-0.12 | 0.46-0.92 | |
| Acceleration rate from 36.6 to 48.8 m (m/sec2) (N=4) | 0.03-0.95 | 0.46-0.92 | |
| Time to travel 12.2 m (sec) (N=4) | 4.1-4.6 | 5.2 | AASHTO value calculated with acc. rate of 1.5 ft/sec2 |
| Time to travel 24.4 m (sec) (N=4) | 6.6-7.8 | 9.8 | AASHTO value calculated with acc. rate of 1.5 ft/sec2 |
| Time to travel 36.6 m (sec) (N=4) | 8.7-11.1 | 11.4 | AASHTO value calculated with acc. rate of 1.5 ft/sec2 |
| Time to travel 48.8 m (sec) (N=4) | 10.9-14.7 | 12.8 | AASHTO value calculated with acc. rate of 1.5 ft/sec2 |
| Speed (km/h) (N=4) | 14-18 | 30 | |
| Perception-reaction time (sec) (N=5) | 0.6-2.0 | 1.5 | Research cited in AASHTO Green Book |
| Sweep width (m) (N=8) | 0.9-1.7 | 1.0 | AASHTO assumed bicycle operating space |
| Three-point turn (cm) (N=3) | 97-102 | 300 | AASHTO value is for two-directional trail |
| Friction factor, 3.1-m radius (N=5) | 0.27-0.31 | 0.32 | |
| Friction factor, 6.1-m radius (N=5) | 0.17-0.58 | 0.30 | |
| Friction factor, 9.2-m radius (N=5) | 0.11-0.31 | 0.29 | |
| Friction factor, 15.3-m radius (N=5) radius (N=5) | 0.09-0.17 | 0.26 | |
| Friction factor, 22.9-m radius (N=5) | 0.05-0.10 | 0.24 | |
| Friction factor, 27.5-m radius (N=5) | 0.04-0.10 | 0.23 |
1 cm = 0.39 inches
1 m = 3.28 ft
1 km = 0.621 mi
Many characteristics of the Segway are comparable to those of other emerging trail devices. Segways stand out with regard to a few characteristics, however. The following list gives 85th percentile values.
1. Segway users had higher eye heights (179 cm (71 inches)) than other user types. This is not surprising: Users are standing on the Segway itself while traveling. Inline skaters had the second highest eye height, 164 cm (65 inches) (table 7).
2. All four observed Segways had a length of 56 cm (22 inches). Compared to other devices, only inline skates had a shorter length (while at rest) (table 8).
3. All four observed Segways had a width of 64 cm (25 inches). This width is comparable to other devices (table 9).
4. The highest acceleration rates for Segways were measured between 12.2 and 24.4 m (40 and 80 ft); the value of 0.94 m/sec2 (3.09 ft/sec2) was at the high end of the 0.5 to 1.0 m/sec2 (1.5 to 3 ft/sec2) that AASHTO uses to calculate the minimum green time for bicyclists. For distances between 0 and 12.2 m (0 and 40 ft), and between 24.4 and 48.8 m (80 and 160 ft), Segways accelerated more slowly than the AASHTO values (table 10).
5. Segway users were most comparable to inline skaters and bicyclists in terms of the time required to travel distances of 12.2, 24.4 m, 36.6 m, and 48.8 m (40 ft, 80 ft, 120 ft, and 160 ft). They took roughly half the time of manual wheelchair users, but up to 43 percent more time than recumbent bicyclists (table 11).
6. The observed speed of 17 km/h (10 mi/h) was somewhat faster than kick scooters (15 km/h (9 mi/h)) and somewhat slower than golf carts (19 km/h (12 mi/h). It is also about half that of the 30 km/h (20 mi/h) design speed recommended by AASHTO (table 12).
7. The observed perception-reaction time was 1.5 seconds. This value is within 0.1 sec of the perception-reaction times for manual wheelchair users and inline skaters (table 14).
8. The Segway's braking distance of 3.1 m (10 ft) was the second shortest among devices; only manual wheelchairs had a shorter braking distance (1.7 m (6 ft)). It was also about half that of bicycles and hand cycles (table 15).
9. Segways were observed to decelerate faster (4.7 m/sec2 (16 ft/sec2)) than other user types. This is perhaps surprising, considering that Segways are not equipped with brakes; to stop the device, the user straightens up from the leaning position. Recumbent bicycles had the second fastest deceleration rate, 4.0 m/sec2 (13 ft/sec2) (table 16).
10. Sweep width (1.1 m (3.5 ft)) was most comparable to recumbent bicycles (1.1 m (3.5 ft)) and adult tricycles (1.0 m (3.4 ft)). It is less than half of AASHTO's recommended width of 3 m (10 ft) for a two-way shared use path, which means that a 3-m (10-ft path) is wide enough for two Segway users (or most other users) to pass each other in opposing directions (table 17).
11. The Segway required the least space to make a three-point turn (100 cm (39 inches)). The second narrowest was manual wheelchairs (146 cm (58 in)) (table 18).
12. For 6.1-m (20-ft) turning radii, Segways had the highest calculated tolerance for lateral acceleration (friction factor = 0.58), compared to other devices. This friction factor was also nearly double that recommended by AASHTO. For other turning radii, the friction factors for Segways were lower than those for bicycles and recumbent bicycles. The lowest friction factor (0.09) was associated with a 27.5-m (90-ft) turning radius, a value less than half of that recommended by AASHTO (table 19).
Time will tell whether the Segway catches on and becomes a common mode in transportation networks. The data from this study provide information into the performance and maneuverability of the Segway and how it might function within shared use paths, sidewalks, and streets.
User Comments/Questions
Add Comment/Question