Turning Radius
According to the AASHTO Guide for the Development of Bicycle Facilities (p. 37), the minimum design curve radius can be calculated by using the following formula:
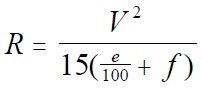
(6)
where: R = Curve radius (ft)
V = Design speed (mi/h)
e = Rate of superelevation (percent)
f = Coefficient of friction
In this study, the trails were flat, so the rate of superelevation was zero, and the formula simplifies to:
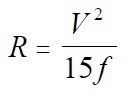
(7)
This formula can be rearranged as
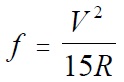
(8)
to calculate friction factors given the speed of each user as he or she traverses curves with specified radii.
It should be noted that what AASHTO refers to as a friction factor is not an actual measurement of the sliding friction of the pavement surface. What it truly represents is the amount of lateral acceleration a user is willing to accept before slowing to a more comfortable speed.
Table 19 of this report shows the friction factors based on 85th percentile speeds. Additionally, the friction factors suggested by AASHTO are provided for comparison. There is a general downward trend in friction factors with increasing curve radii. However, for larger radii the friction factors may level off or even increase. This represents the fact that, at higher radii, users are not slowing substantially from their tangent travel speeds to negotiate the curves (figure 45). Thus, most users could comfortably travel around the larger curves at speeds higher than what was observed in this study. The implications of these results on horizontal alignment are given in the "Discussion" section.
Table 19. Friction factors for different radii, based on 85th percentile speeds.
| USER TYPE | N | 3.1 m RADIUS | 6.1 m RADIUS | 9.2 m RADIUS | 15.3 m RADIUS | 25.4 m RADIUS | 27.5 m RADIUS |
|---|---|---|---|---|---|---|---|
| Bicycle | 142 | 0.61 | 0.52 | 0.36 | 0.26 | 0.18 | 0.20 |
| Hand cycle | 31 | 0.19 | 0.21 | 0.18 | 0.15 | 0.15 | 0.15 |
| Inline skates | 25 | 0.42 | 0.46 | 0.32 | 0.23 | 0.11 | 0.12 |
| Kick scooter | 13 | 0.27 | 0.21 | 0.16 | 0.12 | 0.07 | 0.08 |
| Manual wheelchair | 7 | 0.05 | 0.07 | 0.05 | 0.03 | 0.02 | 0.04 |
| Motorized wheelchair | 4 | 0.12 | 0.09 | 0.07 | 0.12 | 0.06 | 0.07 |
| Recumbent bicycle | 6 | 0.64 | 0.52 | 0.37 | 0.25 | 0.15 | 0.16 |
| Segway | 4 | 0.29 | 0.58 | 0.29 | 0.17 | 0.10 | 0.09 |
| AASHTO values | 0.32 | 0.30 | 0.29 | 0.26 | 0.24 | 0.23 |
NOTE: This table includes only active participants.
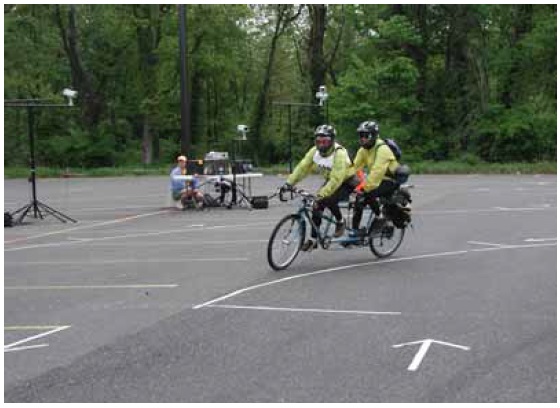
Figure 45. Two tandem riders negotiating a curve at the turning radius station.
User Comments/Questions
Add Comment/Question