Station 7-Stopping Sight Distance (Deceleration)
Stopping sight distance is the total distance traversed by a user between the point where he/she recognizes the existence of an object or situation that requires a stop and the point where he/she has come to a safe stop. This is perhaps one of the most widely used user characteristics in the design of transportation facilities. Stopping distance is based on two components: the distance traveled by the user during his/her perception and reaction time plus the distance required to physically brake to a stop. Accordingly, the stopping distance station was designed to capture both characteristics. The first, the distance traveled during the users' perception and reaction time, was captured with a digital video log similar to the physical setup of the speed studies. Subjects were videoed (from multiple camera positions, see figure 40) within a segment of the shared path. The duration (using a synchronized time display on the video frames) and distance traveled from the "stop" signaling for our downstream-positioned staff to the users' physical commencement of braking was captured on synchronized videos and later reduced by analysis of the video logs. This approach was different from that used by Birriel et al.(8) and Brown,(28) who documented only the braking component of the stopping distance action.
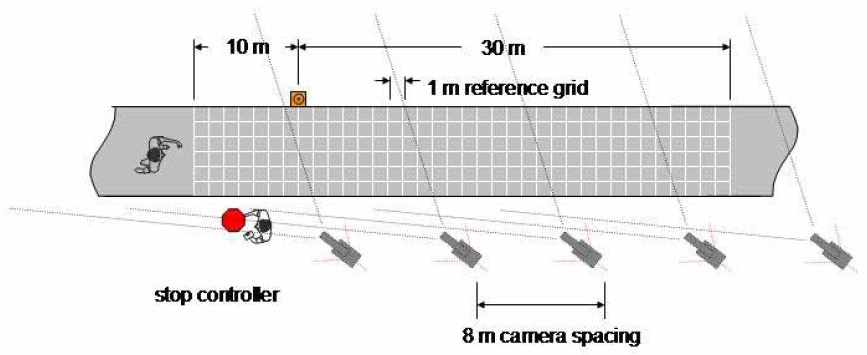
Figure 40: Graphic. Stopping sight distance.
The research team surveyed the second component of stopping sight distance, the actual braking distance, in the following manner. As shown in figure 41, several video cameras were positioned at strategic points around the braking test area. This portion of the camera setup was similar to the methods pioneered by Birriel et al.(8) Data reduction and calculations were done in a similar fashion to that for the perception-reaction component.
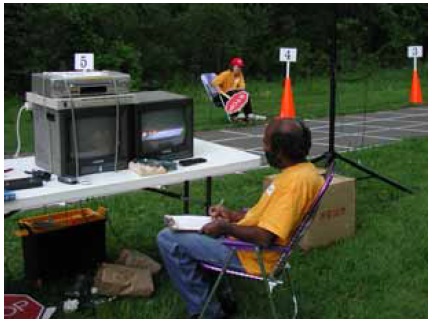
Figure 41. Several video cameras were positioned at strategic points around the braking area.
AASHTO defines stopping sight distance as:
where: d = stopping sight distance
t = brake reaction time, seconds
V = design speed, km/h
a = deceleration rate, m/sec2 (29)
The first term in the above equation is the distance traveled during the user's brake reaction time.
AASHTO uses a brake reaction time of 2.5 seconds for bicyclists.(2) It is entirely possible that other user groups have different brake reaction times. Of course some variation in brake reaction times is likely among the individuals within each user group. The second term in the equation is the braking distance, defined as the distance traveled once the user applies the brakes and before he/she comes to a stop.
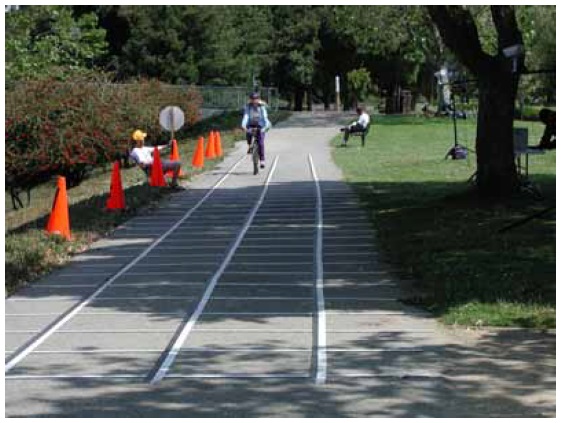
Figure 42: Photo. STOP sign controller signaling a bicyclist to stop.
Only active participants were used for stopping sight distance. During the registration briefing, participants were told that at some point along the course they may be presented with a STOP sign, and if so, they were to stop as "quickly as is comfortable." There were several points along the shared use path where the pavement was marked with a 1 m reference grid on the approach to a "dummy" STOP sign controller. This was done to minimize the participants' anticipation of where the stopping maneuver was to occur. The layout of the actual stopping station is shown in figure 40. An orange cone was placed 30 m (100 ft) in advance of the STOP sign controller to mark the AASHTO stopping sight distance for a bicyclist traveling at 30 km/h (20 mi/h). At various points before the participant reached the cone, the STOP sign controller signaled for the participants to initiate their stop (figure 42).
2. American Association of State Highway and Transportation Officials. Guide for the Development of Bicycle Facilities. American Association of State Highway and Transportation Officials, Washington, DC, 1999.
8. Birriel, E., J.C. Pernia, J.J. Lu, and T.A. Petritsch. The Operational Characteristics of Inline Skaters. University of South Florida, Tampa, FL, January 2001.
28. Brown, D.J. Testing and Analysis of In-line Skating in Relation to Motor Vehicular Traffic. Accident Reconstruction Journal, Vol. 11, No. 1, 2000, pp. 18-22.
29. American Association of State Highway and Transportation Officials. A Policy on Geometric Design of Highways and Streets. (commonly referred to as "Green Book") American Association of State Highway and Transportation Officials, Washington, DC, 2001.
User Comments/Questions
Add Comment/Question