Stopping Distance
The AASHTO Green Book (pp. 111-113) recommends a perception-reaction time of 2.5 seconds for motorists.(29) It cites research by Johansson and Rumar, who found a mean reaction time of 0.66 seconds, after collecting data from 321 drivers who expected to apply their brakes.(30) About 10 percent of drivers had reaction times of 1.5 seconds or longer. Also in that study, when drivers did not expect to apply their brakes, their reaction times increased by approximately 1.0 second. Based on that study and other research, the AASHTO Green Book concluded that a value of 2.5 seconds exceeds the 90th percentile perception-reaction time of all drivers and takes into account the additional time required for unexpected braking vs. expected braking.(29) The AASHTO Guide for the Development of Bicycle Facilities (pp. 40-42) uses a perception-reaction time of 2.5 seconds.(2)
For this study, the perception-reaction time was measured from when the STOP sign was displayed to when the participant started braking. At the upstream acceleration station, participants were told in advance that at some point along the course they might be presented with a STOP sign, and if so, they were to stop as quickly as is comfortable. (In fact, all participants were asked to stop.) In addition, "dummy" stop stations were set up to reduce the anticipation at a particular location.
Table 14 shows that the mean perception-reaction time for bicyclists was 0.9 seconds. This is consistent with the mean reaction time of 0.66 seconds for motorists, as reported by Johansson and Rumar.(30)
2. American Association of State Highway and Transportation Officials. Guide for the Development of Bicycle Facilities. American Association of State Highway and Transportation Officials, Washington, DC, 1999.
29. American Association of State Highway and Transportation Officials. A Policy on Geometric Design of Highways and Streets. (commonly referred to as “Green Book”) American Association of State Highway and Transportation Officials, Washington, DC, 2001.
30. Johansson, G. and Rumar, K. Driver’s Brake Reaction Times. Human Factors, Vol. 13, No. 1, 1971, pp. 23-27.
Table 14. Perception-reaction time.
| USER TYPE | N | MEAN (sec) | STD DEV (sec) | 85TH PER (sec) |
|---|---|---|---|---|
| Bicycle | 130 | 0.9 | 0.7 | 1.3 |
| Hand cycle | 32 | 0.9 | 0.6 | 1.2 |
| Inline skates | 20 | 1.2 | 0.5 | 1.4 |
| Kick scooter | 14 | 1.2 | 0.8 | 2.3 |
| Manual wheelchair | 8 | 1.1 | 0.3 | 1.5 |
| Power wheelchair | 6 | 0.8 | 0.5 | 1.3 |
| Recumbent bicycle | 6 | 0.8 | 0.3 | 1.0 |
| Segway | 5 | 1.1 | 0.6 | 1.5 |
| Other | 24 | 1.3 | 0.2 | 1.5 |
NOTES:
1.This table includes only active participants.
2.AASHTO value = 2.5 sec
The 85th percentile for bicyclists was 1.3 seconds. Adding 1.0 second to this value results in a value of 2.3 seconds for bicyclists who do not expect to stop. Consequently, the AASHTO value of 2.5 seconds seems adequate for the majority of bicyclists, including those who are not expecting to stop. In fact, with the possible exception of kick scooters (whose riders had an 85th percentile perception-reaction time of 2.3 seconds), the AASHTO value of 2.5 seconds seems appropriate for the majority of other users, including those who are not expecting to stop.
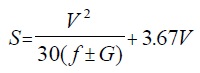
Table 15 shows the braking distance, i.e. the distance traveled from the time that the user initiated braking to the time that the user came to a complete stop, for user groups with five or more users. The calculated friction factor is also shown, using the following equation from the AASHTO Guide to the Development of Bicycle Facilities (p. 42):(2)
(2)
where: S = stopping sight distance, ft
V = speed, mi/h
f = coefficient of friction
G = grade
V2
The first term 
In this analysis, G has a value of zero because data were collected on level trail sections. The second term, 3.67V, is not part of the braking distance.
Therefore, the preceding equation simplifies to a braking distance equation:

(3)
where: d = braking distance, ft
Rearranging the preceding equation gives:

(4)
The friction factor shown in table 15 is that associated with the act of braking. It was calculated by using these values of V and S:
V = 85th percentile speed for that user type, from when the user entered the stopping sight distance station to when the STOP sign was displayed.
S = 85th percentile braking distance for that user type, as observed at the stopping sight distance station
The deceleration rate was calculated as follows:

(5)
where: a = acceleration, ft/sec2
d = braking distance, ft
t = braking time, sec and the negative sign denotes deceleration
For each individual participant, his/her braking distance and braking time were used to calculate his/her deceleration rate. The aggregated deceleration rate for each user type is shown in table 16.
Table 15. Braking distance and friction factor.
| USER TYPE | N | MEAN (m) | 85TH PER (m) | FRICTION FACTOR |
|---|---|---|---|---|
| Bicycle | 130 | 4.8 | 7.0 | 0.32 |
| Hand cycle | 32 | 3.9 | 7.1 | 0.24 |
| Inline skates | 20 | 8.4 | 10.8 | 0.20 |
| Kick scooter | 14 | 4.9 | 8.9 | 0.09 |
| Manual wheelchair | 9 | 1.0 | 1.7 | 0.23 |
| Power wheelchair | 6 | 2.3 | 4.6 | 0.13 |
| Recumbent bicycle | 6 | 3.9 | 5.3 | 0.30 |
| Segway | 5 | 2.7 | 3.1 | 0.49 |
| Other | 24 | 3.7 | 6.6 |
0.28 |
Table 16. Deceleration rate.
| USER TYPE | N | MEAN (m/sec2) | 85TH PER (m/sec2) |
|---|---|---|---|
| Bicycle | 130 | 2.3 | 3.3 |
| Hand cycle | 32 | 2.3 | 3.6 |
| Inline skates | 20 | 1.5 | 2.0 |
| Kick scooter | 14 | 2.4 | 2.6 |
| Manual wheelchair | 8 | 1.0 | 1.8 |
| Power wheelchair | 6 | 2.2 | 3.2 |
| Recumbent bicycle | 6 | 2.9 | 4.0 |
| Segway | 5 | 3.1 | 4.7 |
| Other | 24 | 1.9 | 2.4 |
NOTE: This table includes only active participants.
The implications of these findings are covered in the "Discussion" section below, under the heading "Sight Distance."
User Comments/Questions
Add Comment/Question