Recommendations on Standards for the Design of Medical Diagnostic Equipment for Adults with Disabilities, Advisory Committee Final Report
2. Shoulder Breadth
Shoulder breadth tends to be slightly greater than hip or thigh breadth and hence was used as an estimate for the width of an examination table when in a reclined position. Shoulder breadth was computed as the horizontal distance between the lateral (outer) aspects of the deltoids. Figure 2 provides a box-plot showing the distribution for shoulder breadth stratified by gender and mobility device type.
Inadequate seat width can be more problematic for individuals that have broader shoulders and/or are obese. As such, the width dimension should be based on the higher end of the sample distribution to provide a sufficient base of support for as large a proportion of the user population as possible (e.g. 95th or 99th percentile). The 95th percentile values across the 6 sub-groups ranged from 23-27.5 in., and the maximum values ranged from 25-34 in. A minimum width of 30in. would ensure that all individuals of our sample would be accommodated in terms of static body width. However, space for tasks such as turning over to the side when reclining is not being considered.
A wider examination table (i.e., greater than 30in.) may be needed if accommodating individuals that are morbidly obese and/or use bariatric wheelchairs is also a priority. Our study sample is not representative in terms of the bariatric wheelchair user population – i.e., we had only one bariatric wheelchair user in the sample although we did have many people who were quite obese. The outlier values across thigh breadth and shoulder breadth might serve as a reference for determining the needs of morbidly obese individuals who use wheeled mobility devices (e.g., 34 in.).
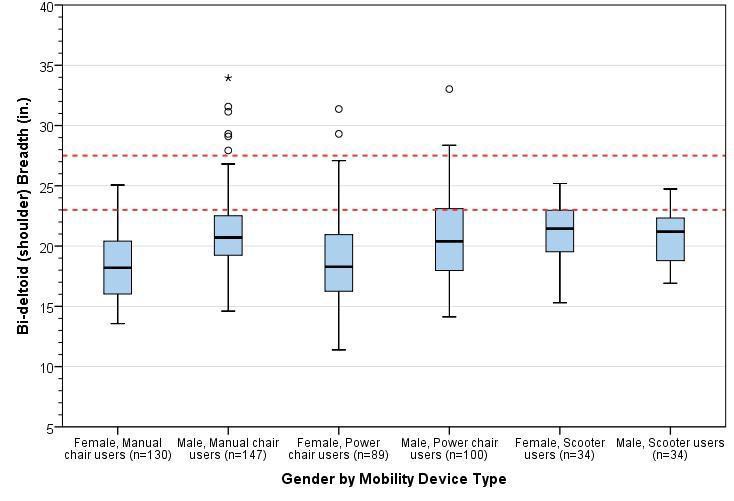
Figure 2: Box-plot showing the distribution for shoulder breadth stratified by gender and mobility device type. The horizontal line splitting the box depicts the median, the box length represents the inter-quartile (25th – 75th percentile) range, and the whiskers represent the minimum and maximum values. Extreme values are shown as dots and asterisks. The red dotted lines depict the observed range of 95th percentile values across sub-groups.
User Comments/Questions
Add Comment/Question