Recommendations on Standards for the Design of Medical Diagnostic Equipment for Adults with Disabilities, Advisory Committee Final Report
1. Thigh Breadth
Thigh breadth was used to provide an estimate of the width of the seating surface. Thigh breadth for this analysis was computed as the larger of two dimensions, the horizontal distance between the lateral (outer) aspect of the hips, and the horizontal distance between the lateral aspects of the thighs, when seated in the wheelchair and not considering any wheelchair hardware. Figure 1 provides a box-plot showing the distribution for thigh breadth stratified by gender and mobility device type. It should be noted that the thigh breadth dimension for manual and power wheelchair users may be underestimated due to lateral posture support features (such as double-post armrest, wheelchair side guard). Scooters generally have single post armrests and hence the occupants’ thighs are laterally “unsupported” and tend to be wider reflecting a more natural posture. In wheelchairs, the armrests and side guards could compress overall breadth of the thighs to a certain extent.
Inadequate seat width can be more problematic for individuals that have broader hips and/or thighs. As such, the width dimension should be based on the higher end of the sample distribution to provide a sufficient base of support for as large a proportion of the user population as possible (e.g., 95th or 99th percentile). The 95th percentile and maximum values across the 6 sub-groups were within a range of 22in-28in, and the maximum values were within the 26in-30in. range. A minimum width of 30in would therefore ensure that all individuals of our sample would be accommodated in terms of the width of a static seating surface. If the minimum width were reduced to 28 in. only three individuals in our sample would not be accommodated.
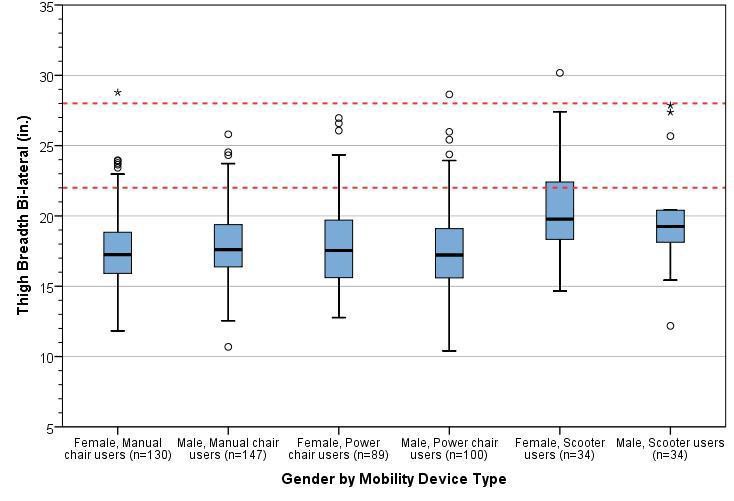
Figure 1: Box-plot showing the distribution for thigh breadth stratified by gender and mobility device type. The horizontal line splitting the box depicts the median, the box length represents the inter-quartile (25th – 75th percentile) range, and the whiskers represent the minimum and maximum values. Extreme values are shown as dots and asterisks. The red dotted lines depict the observed range of 95th percentile values across sub-groups.
User Comments/Questions
Add Comment/Question