Recommendations on Standards for the Design of Medical Diagnostic Equipment for Adults with Disabilities, Advisory Committee Final Report
IDeA Center, University at Buffalo
Memorandum:
Date: 10/23/2012
From: Clive D’Souza and Edward Steinfeld, IDeA Center, University at Buffalo
To: Rex Pace, Technical Assistance Coordinator, U.S. Access Board
RE: Analysis of Transfer Surface Dimensions Based on Wheeled Mobility User Anthropometry
Summary
The following report provides a brief analysis of four anthropometric dimensions which were considered relevant to the width and depth dimensions of a seating surface for wheeled mobility device users. The data are based on findings from the Anthropometry of Wheeled Mobility (AWM) Project, and comprises of detailed static measurements collected from 500 users of manual wheelchairs, power wheelchairs and scooters.
This analysis focuses only on the adequacy of the proposed transfer surface dimensions as a static seating surface – i.e., no measurements of transfers were recorded. The proposed dimensions for transfer surface 30in. wide and 15in. deep is estimated to be adequate as minimum criteria for a static seating surface. Our
research findings demonstrate that the minimum width of the surface could be as small as 28 in. and still accommodate 95% of our sample. It should be noted that Additional width may be required for accommodating users that are morbidly obese or use bariatric wheelchairs. Furthermore, additional space may be needed to accommodate the task of transferring, depending on the additional features provided, e.g. armrests or railings. User testing is recommended for arriving at more accurate transfer surface dimensions and design features to insure usability for a broad diversity of users, including individuals with mobility impairments.
Introduction
The proposed guidelines for medical diagnostic equipment recommends a minimum transfer surface 30 in. (760mm) wide and 15 in. (381mm) deep. At the request of the U.S. Access Board staff, a brief analysis was performed based on static anthropometry measurements previously collected to evaluate the adequacy of these transfer surface dimensions.
The Center for Inclusive Design and Environmental Access (IDeA) at the University at Buffalo conducted an anthropometric study of 500 individuals who use wheeled mobility devices (WMD)1. The research included the collection of demographic information and WMD characteristics, and the measurement of structural and functional anthropometry. Data collection included 3 dimensional measurements of approximately 90 points located on the body and device. Linear distances between pairs of measured points can be computed to provide dimensional estimates of body and mobility device sizes.
Four static body dimensions considered relevant to the width and depth dimensions of a seating surface were computed and analyzed to serve as a reference. These dimensions include: thigh breadth, shoulder breadth, buttock-popliteal length, and wheelchair seat depth. Dimension values are stratified by gender and mobility device type since significant differences in size and space requirements exist across these sub-groups. All dimensions are based on occupant static postures while seated in their own mobility device. As such, the analysis focuses only on the adequacy of the proposed transfer surface dimensions for a static seating surface. No measurements of transferring to or from the mobility device were recorded. Hence, the dimensions discussed in this report should only be considered as a starting point for accessible design of a seating surface. When determining space requirements for dynamic transfer tasks, there are additional space needs and functional abilities of the user population which must be considered. For example, individuals may need additional space to position their hands when conducting a side transfer. Issues of comfort and security need to be considered. Tasks that are performed on the table, like rolling over, need to be accommodated. Furthermore, the question of how to accommodate morbidly obese individuals still needs to be addressed.
The charts below were developed using a statistical analysis package with some built-in features. The reader will notice data points noted as “extreme values.” The statistical package analyses the data to identify “outliers,” or values that exceed expected values in data with a normal distribution. It then includes those values in the graphics as outside the range of maximum and minimum values in each distribution. The charts serve as a visual aid for understanding how the diversity or spread in measurement values within and between each of the six sub-groups of device users that were studied.
However, the “extreme values” are included in our assessment and recommendations on accommodating 95% of the sample, since these “extreme values” represent genuine cases of individuals (as opposed to errors in measurement) that need to be accommodated by design and hence should not be excluded from the analysis, and, the dimensions that we analyzed were not normal distributed due to a broad diversity in the observed measurements. Hence the percentiles were computed separately based on the observed data and not an implied normal distribution. Readers can assume that these “extreme values” represent unusually large or small dimensions for the population studied that might need special accommodation through design and/or some type of personal assistance.
1. Thigh Breadth
Thigh breadth was used to provide an estimate of the width of the seating surface. Thigh breadth for this analysis was computed as the larger of two dimensions, the horizontal distance between the lateral (outer) aspect of the hips, and the horizontal distance between the lateral aspects of the thighs, when seated in the wheelchair and not considering any wheelchair hardware. Figure 1 provides a box-plot showing the distribution for thigh breadth stratified by gender and mobility device type. It should be noted that the thigh breadth dimension for manual and power wheelchair users may be underestimated due to lateral posture support features (such as double-post armrest, wheelchair side guard). Scooters generally have single post armrests and hence the occupants’ thighs are laterally “unsupported” and tend to be wider reflecting a more natural posture. In wheelchairs, the armrests and side guards could compress overall breadth of the thighs to a certain extent.
Inadequate seat width can be more problematic for individuals that have broader hips and/or thighs. As such, the width dimension should be based on the higher end of the sample distribution to provide a sufficient base of support for as large a proportion of the user population as possible (e.g., 95th or 99th percentile). The 95th percentile and maximum values across the 6 sub-groups were within a range of 22in-28in, and the maximum values were within the 26in-30in. range. A minimum width of 30in would therefore ensure that all individuals of our sample would be accommodated in terms of the width of a static seating surface. If the minimum width were reduced to 28 in. only three individuals in our sample would not be accommodated.
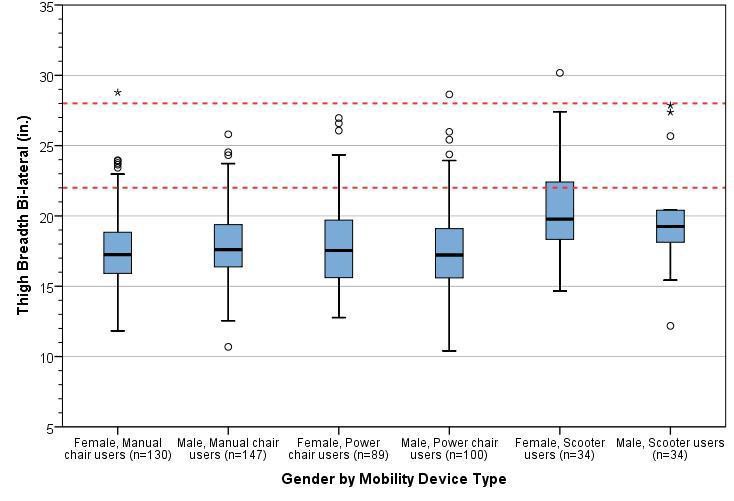
Figure 1: Box-plot showing the distribution for thigh breadth stratified by gender and mobility device type. The horizontal line splitting the box depicts the median, the box length represents the inter-quartile (25th – 75th percentile) range, and the whiskers represent the minimum and maximum values. Extreme values are shown as dots and asterisks. The red dotted lines depict the observed range of 95th percentile values across sub-groups.
2. Shoulder Breadth
Shoulder breadth tends to be slightly greater than hip or thigh breadth and hence was used as an estimate for the width of an examination table when in a reclined position. Shoulder breadth was computed as the horizontal distance between the lateral (outer) aspects of the deltoids. Figure 2 provides a box-plot showing the distribution for shoulder breadth stratified by gender and mobility device type.
Inadequate seat width can be more problematic for individuals that have broader shoulders and/or are obese. As such, the width dimension should be based on the higher end of the sample distribution to provide a sufficient base of support for as large a proportion of the user population as possible (e.g. 95th or 99th percentile). The 95th percentile values across the 6 sub-groups ranged from 23-27.5 in., and the maximum values ranged from 25-34 in. A minimum width of 30in. would ensure that all individuals of our sample would be accommodated in terms of static body width. However, space for tasks such as turning over to the side when reclining is not being considered.
A wider examination table (i.e., greater than 30in.) may be needed if accommodating individuals that are morbidly obese and/or use bariatric wheelchairs is also a priority. Our study sample is not representative in terms of the bariatric wheelchair user population – i.e., we had only one bariatric wheelchair user in the sample although we did have many people who were quite obese. The outlier values across thigh breadth and shoulder breadth might serve as a reference for determining the needs of morbidly obese individuals who use wheeled mobility devices (e.g., 34 in.).
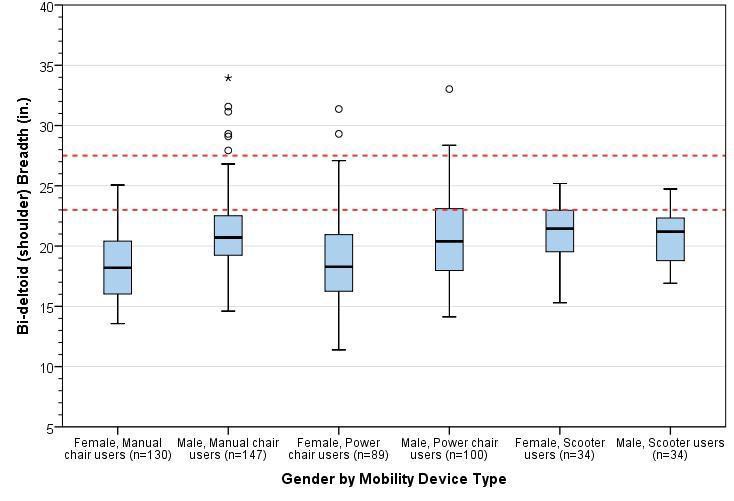
Figure 2: Box-plot showing the distribution for shoulder breadth stratified by gender and mobility device type. The horizontal line splitting the box depicts the median, the box length represents the inter-quartile (25th – 75th percentile) range, and the whiskers represent the minimum and maximum values. Extreme values are shown as dots and asterisks. The red dotted lines depict the observed range of 95th percentile values across sub-groups.
3. Buttock-Popliteal Length
For this study, an estimate of buttock-popliteal length was calculated as the horizontal distance from the proximal (rear) edge of the wheelchair seat cushion to the popliteal fossa (i.e., crease at the back of the knee) of the right leg. The median buttock-popliteal length provides an upper bound for the depth of a seating surface. If seat depth is increased beyond this length, it becomes difficult to engage the backrest as well as exerting pressure to the back of the knees. Figure 3 provides a box-plot showing the distribution for shoulder breadth stratified by gender and mobility device type. The median (50th percentile) values for buttock-popliteal length across the 6 sub-groups ranged from 18.5-19.5 in. Seat depths should preferably not exceed these values (see next section for more information).
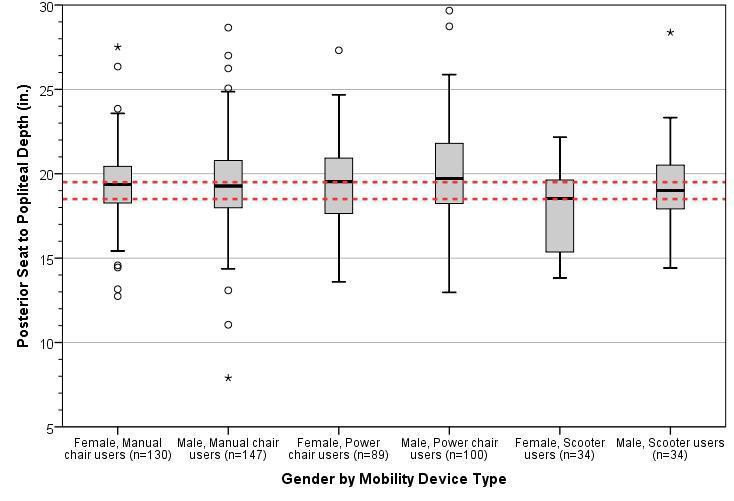
Figure 3: Box-plot showing the distribution for approximate buttock-popliteal length stratified by gender and mobility device type. The horizontal line splitting the box depicts the median, the box length represents the inter-quartile (25th – 75th percentile) range, and the whiskers represent the minimum and maximum values. Extreme values are shown as dots and asterisks. The red dotted lines depict the observed range of 95th percentile values across sub-groups.
4. Wheelchair seat depth
For this study, wheelchair seat depth was calculated as the horizontal distance from the proximal (i.e., towards the rear) edge to the distal (i.e., towards the forward) edge of the wheelchair seat cushion. Individual wheelchair seat depths are generally about 2 in. less than buttock-popliteal length in most case – this is a rough guideline and is quite similar to deciding seat depths for ambulatory individuals e.g., for office chairs. The median seat depth across different wheeled mobility devices would provide a reference value for the depth of other common seating surfaces. Figure 4 provides a box-plot showing the distribution for wheelchair seat depth stratified by gender and mobility device type.
The median (50th percentile) values for wheelchair seat depth across the 6 sub-groups ranged from 14-17 in. The proposed guidelines recommend a transfer surface depth of 15in. which is at about the middle of this range and may be appropriate.
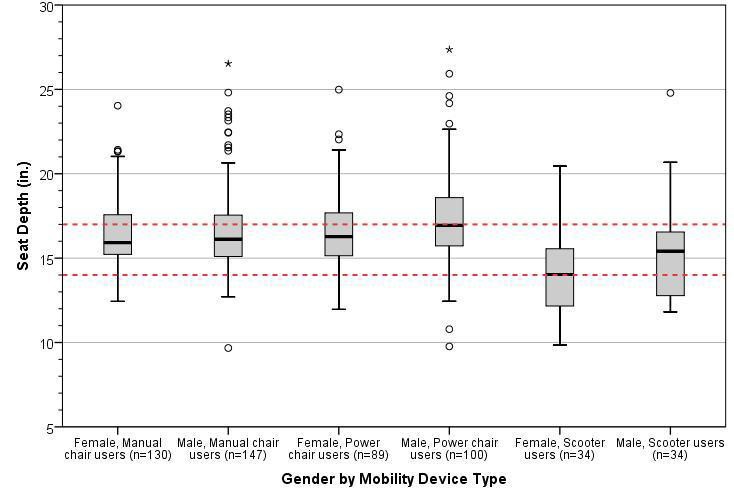
Figure 4: Box-plot showing the distribution for approximate wheelchair seat depth stratified by gender and mobility device type. The horizontal line splitting the box depicts the median, the box length represents the inter-quartile (25th – 75th percentile) range, and the whiskers represent the minimum and maximum values. Extreme values are shown as dots and asterisks. The red dotted lines depict the observed range of 95th percentile values across sub-groups.
Conclusions
The proposed guidelines for medical diagnostic equipment currently recommend a minimum transfer surface
30 in. (760mm) wide and 15 in. (381mm) deep. Our findings support those dimensions but also suggest that
the width could be reduced to 28 in. Our analysis based on static anthropometry measurements. It focuses solely on the adequacy of these transfer surface dimensions for a static seating surface. No studies or measurement of transfers were recorded nor did we collect information on the space needs of other tasks on exam tables like repositioning the body for exams.
Based on an anthropometric analysis of four relevant dimensions, we have the following observations and recommendations:
-
The proposed minimum transfer surface width of 30 in. provides sufficient space as a static seating surface for almost all individuals in our sample of wheeled mobility users based on static measurements of hip and thigh breadth. This width could be reduced to 28 in. and still accommodate 95% of our sample.
-
A width of 30 in. would also accommodate the shoulder breadth of most individuals should this be required, e.g., when the table is in a reclined position. Reducing this width to 28 in. would still accommodate 95% of our sample.
-
Increasing the minimum width is recommended if accommodating individuals that are morbidly obese and/or use bariatric wheelchairs is also a priority. The maximum values recorded for thigh breadth and shoulder breadth serves as a reference value should accommodations for these users be necessary.
-
A depth of 15in. for a seating surface was found to be suitable based on median values of buttock-popliteal length and wheelchair seat depths.
-
These results reflect static anthropometry measurements and should be considered as a starting point for accessible design of a seating surface. User testing is recommended for arriving at more accurate transfer surface dimensions and design features to insure usability for a broad diversity of users and the full range of tasks that might take place on an exam table.
Notes:
1. Steinfeld, E., Paquet, V., D'Souza, C., Joseph, C., Maisel, J., 2010. Final Report: Anthropometry of Wheeled Mobility Project. Prepared for the U.S. Access Board. IDeA Center, Buffalo, NY.
User Comments/Questions
Add Comment/Question