Visual Detection of Detectable Warning Materials by Pedestrians with Visual Impairments - Final Report
2 Method
Systematic outdoor evaluations were performed on 13 different detectable warning colors/patterns on 4 different simulated sidewalk surfaces by 50 visually impaired participants who have visual impairments. The two main dependent measures were:
-
Whether the detectable warnings could be seen from distances between 2.44 m (8ft) and 7.92 m (26 ft).
-
Participants’ subjective ratings of the likelihood that the detectable warnings would attract their attention (conspicuity).
1.4 Participants
Fifty adults with low vision were recruited through contacts with local organizations for people who are blind or visually impaired. Information about the study was also distributed through email lists, flyers in medical offices and retirement communities, and through personal contacts of orientation and mobility specialists in the Washington, DC, area. Some participants were referred by other participants. Individuals were invited to participate based on their responses to a screener questionnaire. When people called to inquire about the study they were asked about the nature and severity of their visual impairments, their frequency of travel and difficulties experienced while walking, and the travel aids they use. Self-reported difficulty in detecting streets and curb ramps was a major criterion used to select participants for the study. Participants were compensated with $75 for their time and were reimbursed for local travel expenses.
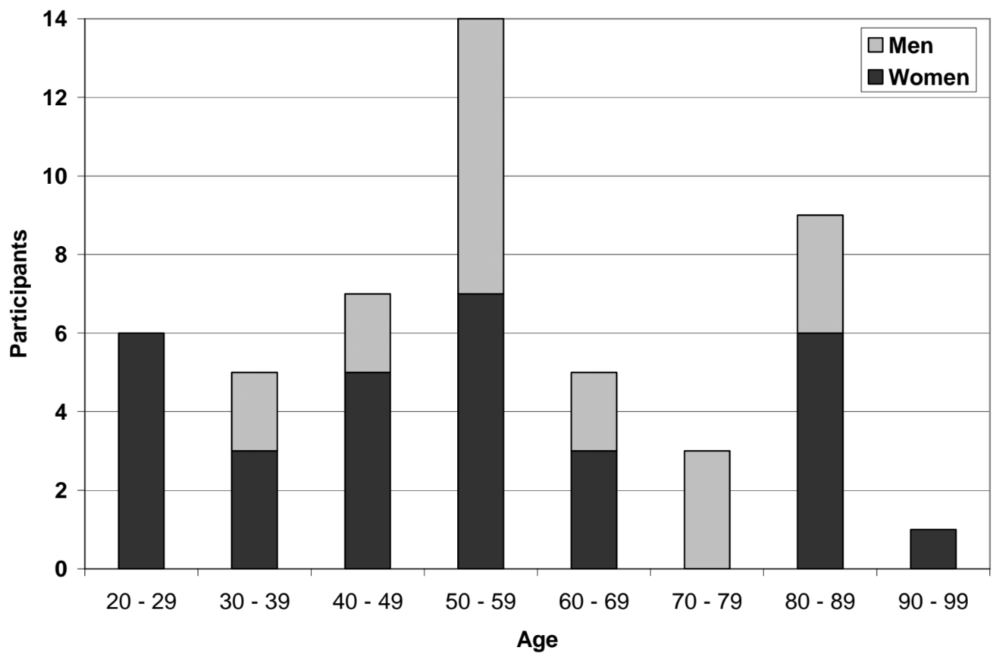
Participants ranged in age from 24 to 92 years old, with a median age of 54. The distribution of participants’ ages by gender is shown in Figure 1. There were 31 women and 19 men in the sample. Each age group contained both men and women except for the youngest age group (20 – 29 years) and oldest age group (90-99) which each consisted of women only and the 70-79 years-old group which consisted of men only.
Participants ranged in age from 24 to 92 years old, with a median age of 54. The distribution of participants’ ages by gender is shown in Figure 1. There were 31 women and 19 men in the sample. Each age group contained both men and women except for the youngest age group (20 to 29) and oldest age group (90 to 99) which each consisted of women only and the 70 to 79 years-old group which consisted of men only. The most frequently reported travel aid was a long cane, which was used by 36 participants. Some participants reported that they use more than one kind of travel aid, choosing what they need based on the duration of the planned trip, their familiarity with the area where they will be traveling, and the anticipated lighting conditions. The use of travel aids during the study was permitted. Mobility aids such as support canes and walkers were also allowed. Eyeglasses and sunglasses were allowed, though viewing scopes such as monoculars were not allowed.
Nearly all of the selected participants were legally blind as a result of limited visual acuity, limited field of vision, or a combination of the two, but all participants had some useful vision (more than light perception). None of the participants had a driver’s license and all reported walking on sidewalks occasionally or frequently, either with or without travel aids. The number of participants who reported using travel aids at least occasionally is shown in Table 1. The most frequently re ported travel aid was a long cane, which was used by 36 participants. Some participants reported that they use more than one kind of travel aid, choosing what they need based on the duration of the planned trip, their familiarity with the area where they will be traveling and the anticipated lighting conditions. The use of travel aids during the study was permitted. Mobility aids such as support canes and walkers were also allowed. Eyeglasses and sunglasses were allowed, though viewing scopes such as monoculars were not allowed.
Figure 1. Chart. Distribution of Participants’ Ages by Gender
| Travel Aid |
Participants Reporting Use |
|---|---|
| Long cane | 36 |
| Dog guide | 4 |
| Monocular/ telescope/ magnifying glasses | 3 |
| Short cane / support cane | 6 |
| Walker | 2 |
| Wheel chair | 1 |
| No travel aids used | 10 |
Participants’ visual impairments were diverse and in several cases vision was affected by multiple medical conditions. The complete list of participants’ self-reported conditions affecting their vision is given below in Table 2. The most commonly reported conditions were glaucoma, cataract, and macular degeneration.
| Medical Condition | Participants Reporting Condition |
|---|---|
| Glaucoma | 13 |
| Cataract | 12 |
| Macular degeneration/ macular dystrophy | 10 |
| Retinitis pigmentosa | 6 |
| Optic neuritis / optic nerve atrophy | 6 |
| Brain injury | 5 |
| Diabetic retinopathy | 5 |
| Retinopathy of prematurity | 4 |
| Retinal detachment | 3 |
| Albinism | 2 |
| Corneal dystrophy/ other corneal disease | 2 |
| Myopic degeneration | 1 |
| Inverse retinitis pigmentosa | 1 |
| Uveitis | 1 |
| Stargardt's disease | 1 |
| Giant cell arthritis | 1 |
1.5 Materials
Sidewalks. Four different colors of simulated sidewalk surfaces were used in this study. These included white (simulating new concrete), brown (simulating aged, dirty concrete), dark gray (simulating asphalt), and red (actual paving bricks). The four simulated sidewalk sections were constructed on low wooden platforms; each covered a 1.22 m (4 ft) wide x 2.44 m (8 ft) long level area on the ground. The white and brown “concrete” surfaces were simulated by applying several coats of paint and sand mixture to a sheet of OSB plywood (oriented strand board). The surface texture provided by the OSB plywood and paint/sand mixture approximated the surface texture of brushed concrete. Dark gray asphalt rolled roofing material was glued on OSB plywood to simulate dark gray asphalt pavement, and red colored concrete paving bricks were laid (without mortar joints) to simulate the brick sidewalk. The surface of each simulated sidewalk section was raised approximately 76 mm (3 in.) above the ground level. Chromaticity and luminous reflectance measurements of the simulated sidewalk surfaces used in this study are given in Table 3.
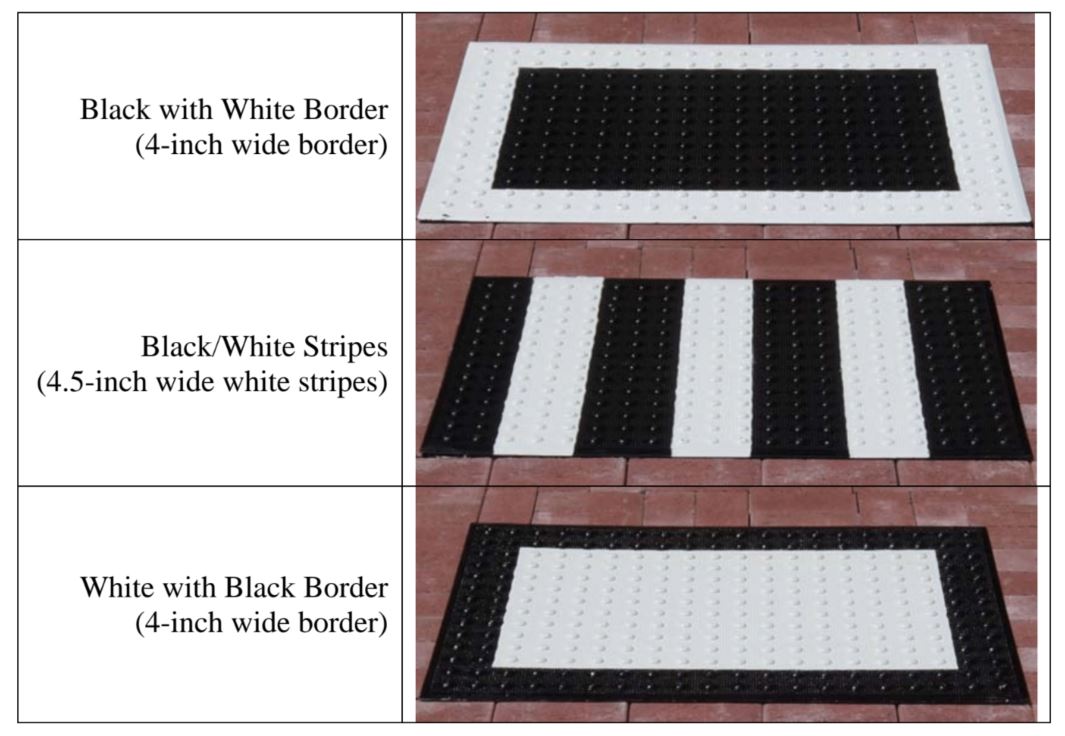
Detectable Warnings. Thirteen different detectable warnings were tested in this study. Ten were uniformly colored and three others had black-and-white patterns. Although two-color detectable warnings are not comm only used, we included a few high contrast patterns in this study to determine if patterns might be more effective than uniformly colored detectable warnings. Other colored patterns might have been tested but we chose to limit the number of detectable warnings used in the study to 13 so a participant could complete a full set of trials in a single two-hour session. The 10 uniformly colored detectable warnings are shown in Figure 2 with color samples. The three black-and- white patterned detectable warnings are shown in Figure 3, photographed against the red brick sidewalk.
Figure 2. Photo. Uniformly Colored Detectable Warnings (Color Samples)
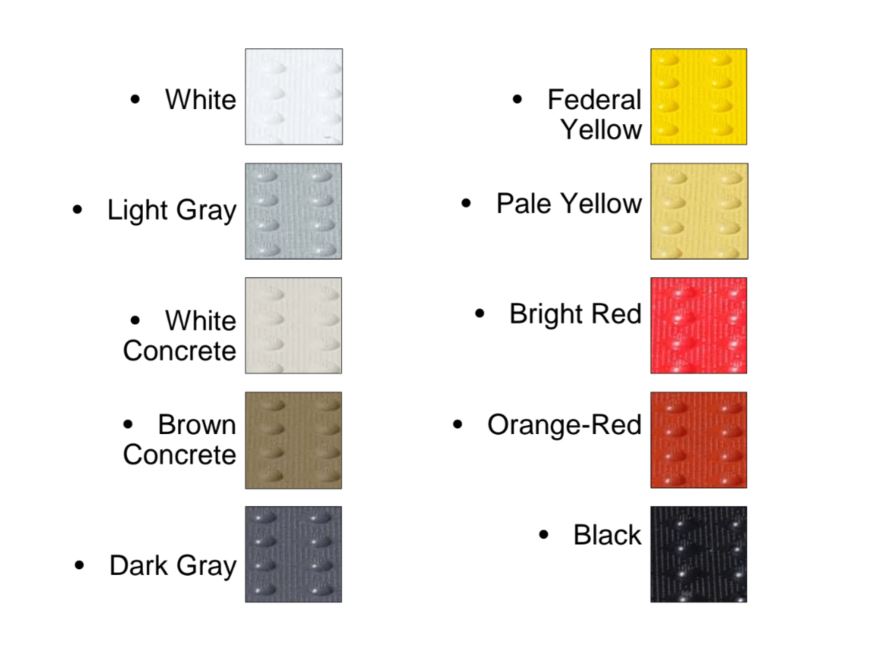
Figure 3. Photo. Black-and-white Patterned Detectable Warnings
The detectable warnings were surface-mounted composite panels provided by ADA Armor-Tile. The panels were .89 m (35 in.)x .65 m (25.5 in.) including a 13 mm (0.5 in.) smooth tapered edge on all sides. The spacing and size of the truncated domes were compliant with Federal geometric specifications (see Appendix B). The detectable warnings also had very small bumps located between and on the truncated domes to provide texture for traction. Because this study was designed to examine the relative visibility of different detectable warning colors, materials from a single manufacturer were used so that the geometric characteristics of the truncated dome pattern would be constant for all of the different colors tested. Some of the colors selected for inclusion in the study were standard colors provided by the manufacturer, and some of the colors were created by painting the detectable warning panels. The relatively thin surface-mounted detectable warnings were chosen for use in this study because they could be lifted easily by a single experimenter. However, because they were not permanently mounted according to the manufacturer’s specifications, the detectable warnings had a tendency not to lie completely flat on the sidewalk. To overcome this problem, several thin metal plates were glued to the bottom of each detectable warning and magnets were embedded in the sidewalks, flush with the surface. This system served to hold the detectable warning panels flat against the sidewalk but allowed them to be quickly removed and replaced between different trials during the course of the study. When in place, the front edge of each detectable warning was positioned 1.22 m (4 ft) behind the front edge of the sidewalk and was centered horizontally on the sidewalk section.
Blanks. Blank panels were also created for this study. Blanks were made from thin sheets of painted plastic or asphalt roofing material approximately the same size as the detectable warnings. These blanks were the same color as the sidewalks and had no truncated domes. Blanks provided very little visual contrast against the sidewalk and were included in the study to ensure that participants could not simply assume that a detectable warning was present on every trial. Like the detectable warnings, the blanks cast small shadows along their front edges which ensured that participants could not simply use the presence of a thin shadow as a cue to determine that a detectable warning was present on the sidewalk. Blank panels were used with the white, brown, and asphalt sidewalks, but not with the brick sidewalk.
Chromaticity and Reflectance of Materials. Chromaticity and reflectance are physically measurable qualities that are related to the perceived color and lightness of surfaces. The chromaticity and reflectance of detectable warnings, sidewalks, and blank panel surfaces were measured in place (horizontal) at the testing site. Table 3 shows the chromaticity coordinates and reflectance factors of the materials used in this study. This set of chromaticity measurements was made between 10:00 a.m. and 11:00 a.m. under natural illumination (20% cloud cover) using a SpectraScan PR650 (PhotoResearch) spectrophotometer. The reflectance factors were measured on a different day using a Minolta CS-100 Chroma Meter. All measurements were made from the same direction that the surfaces were viewed by participants: at a downward angle of 45 degrees. Other details about the measurement procedures are given in Appendix D. Additional photometric measurements of real sidewalks at various locations in Rockville, Maryland confirmed that our simulated sidewalks had chromaticities and luminance reflectances that are plausible for actual paving materials.
Chromaticity and reflectance of the actual concrete sidewalks measured varied considerably depending on their age and dirtiness. For example, a new-looking, clean concrete sidewalk had a luminance reflectance of r = 0.49, while an older, much darker concrete sidewalk had a luminance reflectance of r = .09. Three asphalt sidewalks measured had luminance reflectance ranging from r = .06 to r = .10. Thus, from our limited measurements of real sidewalks, we conclude that the white simulated concrete sidewalk section used in the present study is similar to very light new concrete, and the simulated asphalt sidewalk is similar to new dark asphalt. The luminance reflectance of the brown simulated sidewalk is consistent with medium gray concrete sidewalks that we observed, although its appearance is more brownish. The red bricks used in the present study had similar luminance reflectance as bricks measured in existing sidewalks.
| Material |
CIE1931 Chromaticity Coordinates |
Reflectance Factor |
|---|---|---|
| White detectable warning | x = .333, y = .347 | .74 |
| Light Gray detectable warning | x = .326, y = .341 | .24 |
| White "concrete" detectable warning | x = .352, y = .364 | .64 |
| Brown " concrete" detectable warning | x = .390, y = .386 | .17 |
| Dark Gray detectable warning | x = .320, y = .331 | .09 |
| Federal Yellow detectable warning | x = .511, y = .454 | .46 |
| Pale Yellow detectable warning | x = .412, y = .414 | .47 |
| Bright Red detectable warning | x = .587, y = .323 | .11 |
| Orange-Red detectable warning | x = .533, y = .356 | .13 |
| Black detectable warning | x = .324, y = .338 | .02 |
| White paint (used for border & stripe patterns) | x = .330, y = .344 | .82 |
|
Black paint (used for border pattern) |
x = .326, y = .340 | .02 |
| Brick sidewalk (for a typical brick) | x = .417, y = .358 | .15 |
| Asphalt sidewalk | x = .332, y = .346 | .06 |
| Asphalt "blank" panel | x = .335, y = .349 | .05 |
| White sidewalk | x = .351, y = .363 | .57 |
| White "blank" panel | x = .351, y = .363 | .60 |
| Brown sidewalk | x = .385, y = .381 | .17 |
| Brown "blank" panel | x = .384, y = .381 | .17 |
1.6 Testing Site and Conditions
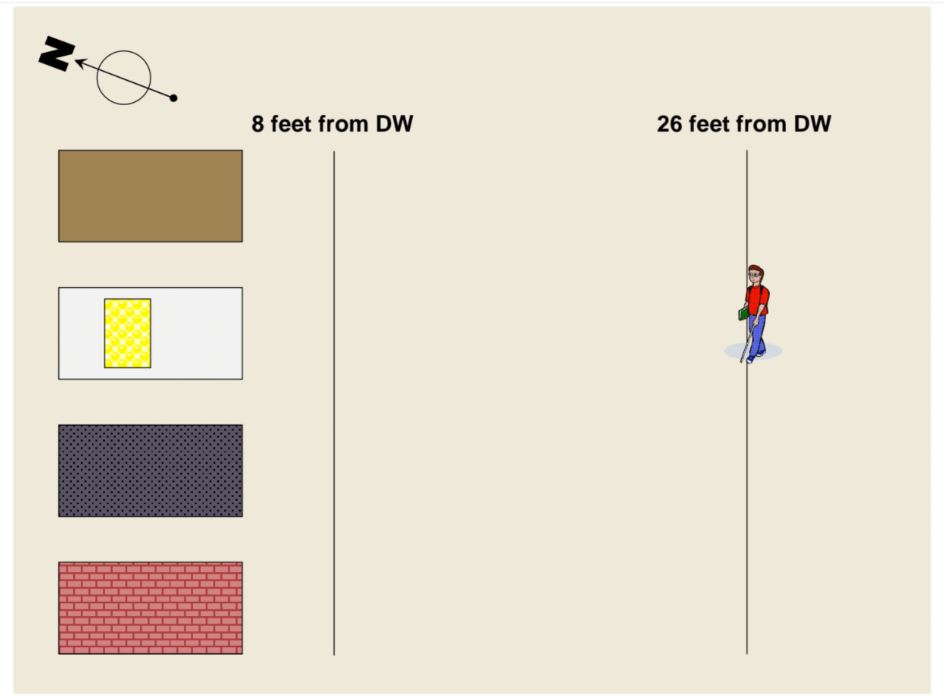
The study was conducted on a flat, outdoor patio adjacent to Westat’s conference center in Rockville, MD. The area was clear of obstructions and was situated so that no shadows fell on the four sidewalk sections during the hours when testing was conducted. The four sidewalk sections were arranged side-by-side and a straight, unobstructed walking path was provided to each sidewalk. A scale drawing of the site is presented in Figure 4. Study sessions began between 10:00 a.m. and 1:30 p.m. to ensure consistent lighting. Sessions were conducted regardless of cloud conditions, but were canceled in the event of rain. Testing sessions took place between May and August 2005. When not in use, the sidewalk sections were covered to prevent damage from exposure to sunlight and precipitation, and detectable warning panels were stored indoors.
Figure 4. Diagram. Schematic View of Testing Site
1.7 Procedure
The study utilized a full factorial, repeated-measures design in which participants viewed each of the 13 detectable warnings against each of the 4 sidewalks for a total of 52 trials. Two “blank” trials were also inserted for each of the sidewalks (except the brick sidewalk) for a grand total of 58 trials. Participants completed all trials on a particular sidewalk before moving on to the next side walk. The order in which sidewalks were viewed was randomized for each participant, as was the order of the detectable warnings (and blank trials) viewed on each sidewalk. Participants were tested individually in sessions lasting 1.5 to 2.5 hours.
The purpose and general activities involved in the study were explained to participants during initial telephone screening. Consent forms were printed in a large font size and sent to participants via mail or e-mail (whichever was preferred).
1.7.1 Introduction and Vision Testing
Upon arrival at Westat, participants were guided to the vision testing room. Participants were escorted at all times by an experimenter who had received training from an orientation and mobility specialist. The experimenter first read the consent form aloud to participants who had not had the opportunity to read it themselves and then collected signed consent forms. Next, participants were asked to describe their visual condition, the functionality of their vision, and their use of mobility aids. Three separate vision tests were performed to assess participants’ visual acuity, contrast sensitivity, and color vision. For these tests, participants were allowed to view the charts binocularly and to use head or eye movements necessary to read as many letters or symbols as possible. Details on the vision testing procedures are given in Appendix E. No formal assessments of each participant’s visual fields were conducted due to time constrains, however based on self- reports, the study sample included participants with small, medium, and large visual field losses.
The experimenter guided participants to the outdoor testing site and familiarized them with the site layout. Participants were given a small sample piece of detectable warning material to see and feel, then were shown examples of a detectable warning and a blank on a sidewalk. The experimenter then described the study procedures and guided participants through a practice trial before beginning the study trials.
1.7.2 Visual Detection Distance
Each trial began with the participant standing 7.9 m (26 ft) from the front edge of the detectable warning. The 7.9 m (26 ft) viewing distance was chosen to approximate the width of a residential street. Participants began facing away from the sidewalk to allow a second experimenter to lay down a detectable warning (or blank). When the detectable warning was in place, the participant turned around and reported to the experimenter whether he/she was confident that there was a detectable warning on the target sidewalk. If the detectable warning was not seen from 7.9 m (26 ft) away, the participant was instructed to walk slowly toward the sidewalk and to stop immediately if he/she became confident that there was a detectable warning (and not a blank) present. If the participant came within 2.4 m (8 ft) of the detectable warning and could not confidently say that a detectable warning was present, the trial was ended.
1.7.3 Color Naming, Conspicuity Rating, and Other Comments
If the participant was able to see the detectable warning from at least 2.4 m (8 ft) away, the experimenter guided the participant to the 8-foot line to ask two more questions. First, the participant was asked what color or pattern they saw on the detectable warning. Second, the participant was asked to rate the likelihood that the detectable warning would attract his/her attention on that particular sidewalk (conspicuity). A rating scale of 1 to 5 was used where 1 meant (the detectable warning is very unlikely to attract my attention on this type of sidewalk) and 5 meant (the detectable warning is very likely to attract my attention on this type of sidewalk).
If the participant did not see the detectable warning from 2.4 m (8 ft), a conspicuity rating of zero was assigned by the experimenter. Although additional comments were not solicited, the experimenter also recorded any relevant comments that the participant provided about the detectable warnings, such as, “looks like a cement patch.”
User Comments/Questions
Add Comment/Question