Visual Detection of Detectable Warning Materials by Pedestrians with Visual Impairments - Final Report
Appendix D: Photometric Measurements
The purpose of this appendix is to provide essential details about the measurement procedures and definitions of luminance, reflectance, luminance contrast and illuminance that were used in this study and to provide guidance for those who wish to make similar field measurements of detectable warnings.
Measuring light requires some basic understanding of the terminology, technology, and methods of photometry. Photometry is the measurement and specification of light (visible radiant energy) based on the standardized spectral sensitivity of the human visual system. Modern photometers contain a detector which has been calibrated so that its relative sensitivity to different wavelengths of light matches the sensitivity of the visual system. Illuminance and luminance are two photometric quantities that can be measured easily with photometers. Illuminance is a measure of light falling on a surface (per unit area), and luminance is a measure of light coming from an object (per unit area). Luminance is related to the perceptual qualities of lightness (of a reflective surface) or brightness (of a light source).
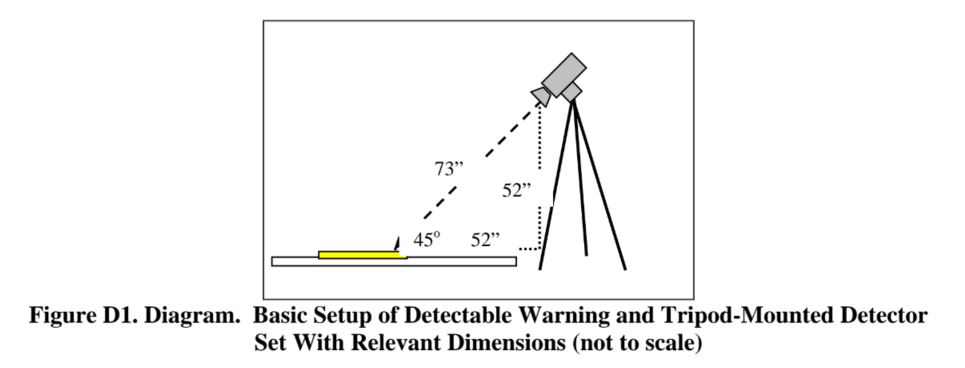
Luminous reflectance (reflectance factor) is a photometric measurement of the proportion of light that is reflected from a surface in a particular direction relative to the amount of light that would be reflected from a perfectly diffusely reflecting surface. In the field it is possible to calculate reflectance factor of a detectable warning (RDW) by measuring the luminance of the detectable warning (LDW) and the luminance of a standard white plate (Lstandard) that has a known reflectance (Rstandard). Note that when making photometric measurements it is important to specify the geometry of the surfaces relative to the photometer and the light source. Figure D1 shows the measurement geometry used in the present study.
Once the luminance of the detectable warning and the luminance of the reflectance standard have been measured, the reflectance factor for the detectable warning is calculated by:
RDW = LDW / (Lstandard / Rstandard)
The same procedure can be used to calculate the reflectance factor of a sidewalk surface.
Natural illumination changes constantly (especially on partly cloudy days), therefore, when comparing two adjacent surfaces or obtaining measurements of a surface and a reflectance standard (white plate) in the field, it is necessary to make measurements in quick succession so that illumination changes will not affect the results. Averaging measurements can mitigate the effects of changing illumination. One technique is to make a measurement of Surface 1 then make a measurement of Surface 2 and then make a second measurement of Surface 1. The two measurements of Surface 1 should be averaged and compared to the measurement of Surface 2. This method substantially reduces the effects of changing illumination.
Once reflectance factors have been obtained for two adjacent surfaces (R1, R2), these may be used to calculate the luminance contrast between the two surfaces:
Luminance contrast (%) = [(R1 - R2) / R1] x 100.
Where: R1 is the reflectance factor of the lighter area and R2 is the reflectance factor of the darker area.
In the present study, we used this definition for luminance contrast (given above) which is consistent with the 2002 version of Draft Guidelines for Accessible Public Rights-of-Way.
If a calibrated reflectance standard is not available, practical field measurements of luminance contrast may be obtained by directly comparing the luminance of the detectable warning with the luminance of the adjacent sidewalk. To reduce the effects of changing illumination, several measurements should be taken by quickly alternating between detectable warning and adjacent sidewalk surfaces. Luminance contrast can be calculated as follows:
Luminance contrast (%) = [(L1 – L2) / L1] x 100.
Where: L1 is the luminance of the lighter area and L2 is the luminance of the darker area.
It should be noted that the two definitions of luminance contrast given above differ from the commonly used Weber contrast statistic (NASA, 2004). Weber contrast is normally used to characterize visual stimuli in well-defined viewing situations where a small area of particular interest is surrounded by a larger (uniform) background area. The Weber formula for luminance contrast is:
Luminance contrast (%) = [(L1 – L2) / L2] x 100.
Where: L1 is the luminance of the small target areas and L2 is the luminance of the large background area.
Luminance contrast also may be defined in several other ways depending on the application (NASA, 2004). Therefore, when comparing luminance contrast values, it is essential to know how luminance contrast has been calculated and how the measurements were obtained.
In the present study, all chromaticity and luminance measurements of the simulated sidewalk sections and detectable warnings were obtained during the middle of the day under natural illumination. Chromaticity measurements were made using a Photo Research (SpectraScan PR650) spectrophotometer with a one degree measurement area. Luminance contrast measurements and reflectance measurements were repeated on several different days using either a Minolta CS-100 Chroma Meter or a Minolta LS-100 Luminance meter. These devices also have a one degree measurement area. All measurements were made at an angle of 45 degrees relative to the horizontal test surface looking in the same direction that the participants viewed the detectable warnings during their testing sessions. The 45 degree measurement angle was chosen because it is commonly used in photometric work. Measurements were made with a circular one-degree field of view with the tripod-mounted detector set approximately 52 inches higher than the measured surface and at a horizontal distance of approximately 52 inches from the measured area. As a result, the detector was approximately 73 inches from the measured area. This geometry avoided the problem of shadows cast on the surface by the detector and approximated viewing conditions for a pedestrian standing a few feet away from the warning surface. Figure D1 outlines the setup of the detectable warning and the tripod-mounted detector.
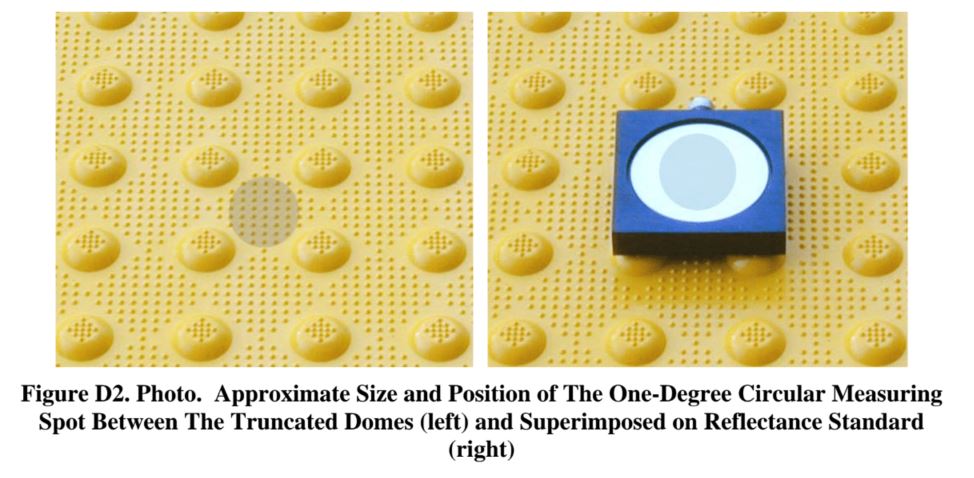
In Figure D2, the left and right photographs show the detectable warning surface viewed from an angle of 45 degrees. In each photograph, a faint gray (transparent) circular spot has been superimposed on the photograph to illustrate the approximate size and position of the one-degree area measured. Note in the left photograph that the measuring spot is centered between truncated domes. This standard position was chosen to avoid the shadows and specular reflections (highlights) on the sides of the domes. In the photograph on the right, the measured area was centered on the white reflectance standard.
All of the detectable warning surfaces used in this study were new or freshly painted and very uniform. Therefore it was deemed unnecessary to make a large number of measurements from different areas. Measurements were taken from detectable warning panels of typical areas between the raised truncated domes. This was done to avoid shadows and areas of strong specular reflectance on the truncated domes. The composite detectable warning materials were fairly glossy, however no measurements of gloss were obtained. The white, black, and bright red paints used on some of the detectable warnings also had a glossy finish that closely resembled the gloss of the unpainted detectable warnings. Both the brown and white “concrete” detectable warnings (and corresponding sidewalks) had a matte surface created from flat-finish paint and sand mixtures.
A Minolta (model T-1) Illuminance Meter was used to measure ambient light (in lux) during study sessions. The analog voltage output signal from the illuminance meter was transmitted to a Fluke (model 123 ScopeMeter) digital voltmeter connected to a tablet PC. The time and horizontal illuminance readings were manually recorded on each trial, however, a simple software program running on the tablet PC also recorded horizontal illuminance readings and times at a rate of one reading per two seconds for the duration of each experimental session. The illuminance meter was positioned on a table immediately adjacent to the testing area where it was not affected by shadows cast by the participants.
User Comments/Questions
Add Comment/Question