Visual Detection of Detectable Warning Materials by Pedestrians with Visual Impairments - Final Report
2.8 Effects of Luminance Contrast on Visual Detection and Conspicuity of Detectable Warnings
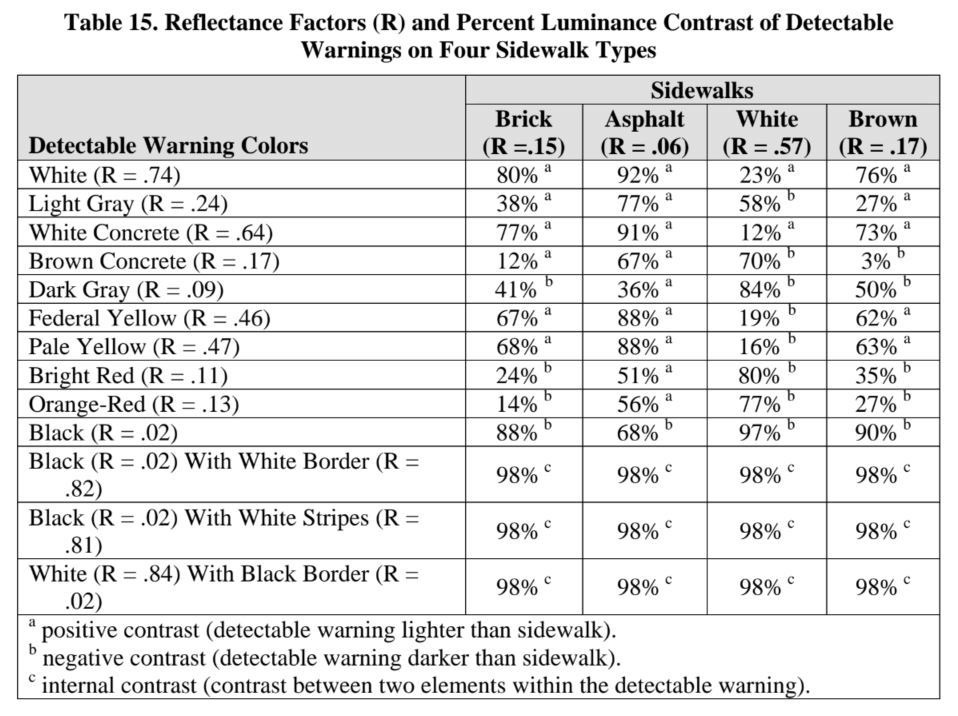
Reflectance factors for each detectable warning and sidewalk were measured with a Minolta CS-100 Chroma meter and a calibrated white reflectance standard. Horizontal surfaces were measured at an angle of 45 degrees under midday natural illumination. Details on the measurement procedures and calculation of reflectance factors are provided in Appendix D. Contrast was calculated for each combination of detectable warning and sidewalk using the following formula:
Contrast = (R1 - R2) / R2 X 100%
Where:
R1 is the reflectance factor of the darker surface to be compared
R2 is the reflectance factor of the lighter surface to be compared
For the three black-and-white patterned detectable warnings contrast values were computed for the black versus white areas of the detectable warnings themselves (internal contrast). This was done because it was assumed that participants would respond primarily to the high contrast black-and-white elements of the detectable warnings whenever the contrast between the edge of the detectable warning and the sidewalk was lower. Table 15 shows the reflectance and contrast values of the detectable warnings on each of the four sidewalks studied. The superscript letter following each percent luminance contrast value indicates whether the contrast was positive, negative, or internal. All of the values shown for the three patterned detectable warnings represent the internal contrast between the black-and-white pattern elements. Note that the internal contrast of the detectable warning patterns does not depend on the sidewalk on which it is placed.
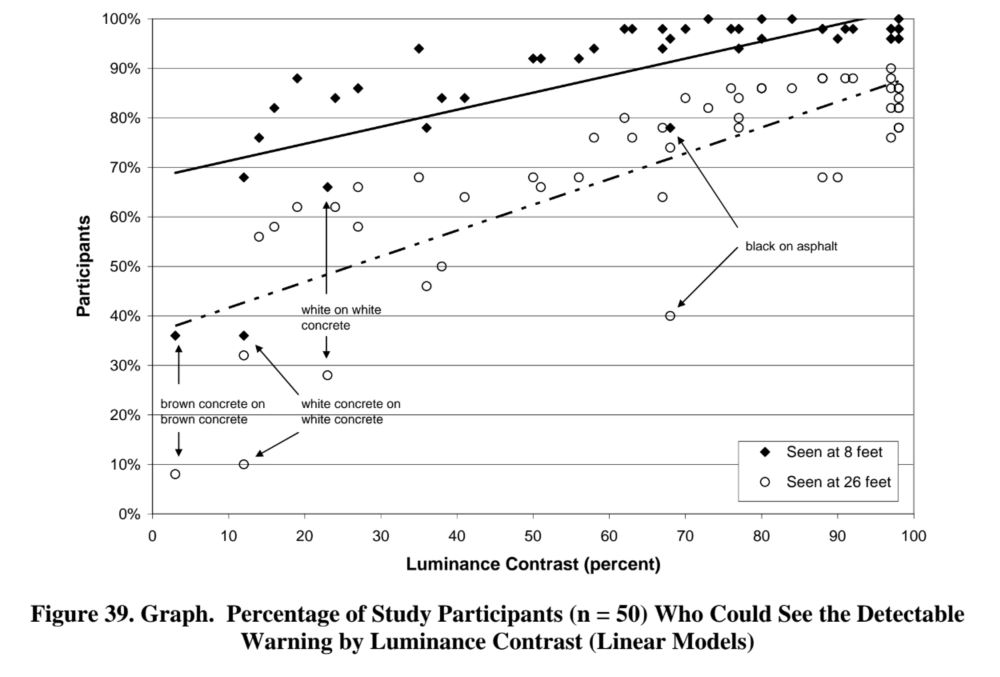
Data were analyzed to determine how luminance contrast was related to the number of participants who were able to see the detectable warning and to the number of participants who rated the detectable warning as having high conspicuity. Figure 39 shows the percentage of participants who saw each combination of detectable warning and sidewalk as a function of luminance contrast. At a viewing distance of 2.44m (8 ft) from the detectable warning, there is a positive correlation (r = .75) between luminance contrast and the number of participants who saw each detectable warning. These data are shown on the figure by the filled diamond symbols and a solid trend line. Data obtained from a distance of 7.92 m (26 ft) are shown by the open symbols and dashed trend line. At 7.92 m (26 ft), there is also a positive correlation (r = .80) between contrast and number of participants who were able to see the detectable warning.
Higher luminance contrast is associated with improved rates of visual detection at close range and from longer distances. Note that as contrast increases above 70 percent, the data for the 8-foot viewing distance reach a plateau with approximately 95 percent of participants seeing the detectable warning. At 7.92 m (26 ft), no more than 80 to 90 percent of the participants were able to see the detectable warnings, even at the highest contrast levels of 98 percent.
Contrast may be used to predict the number of participants who are able to see detectable warnings at a distance of 2.44 m (8 ft) and 7.92 m (26 ft). At 2.44 m (8 ft), the percentage of participants who are able to see the detectable warnings (PS8) is given by the following equation:
PS8 = .34* (percent contrast) + 67.89.
From 7.92 m (26 ft), the percentage of participants who are able to see the detectable warnings (PS26) is given by the following equation:
PS26 = .52* (percent contrast) + 36.42.
Note that the trend lines shown in Figure 39 do not provide very good fits to the data. There are several “outliers” for which these equations do not provide accurate predictions. Some of these outliers have been labeled. In particular, the simple linear models do not account for the very low rates of detection at the lowest contrast levels.
The goodness-of-fit for the linear models may be evaluated by the coefficient of determination, which for the 2.44 m (8 ft) distance is r2 = .56. For the 7.92 m (26 ft) distance, this value is r2 = .65. If the natural logarithm of luminance contrast is used to predict detection, the fit of the models improves substantially. In Figure 40, two logarithmic models have been fit to the data. The coefficients of determination (“r-square”) for these models are r2 = .76 for the 2.44 m (8 ft) data, and r2 = .73 for the 7.92 m (26 ft) data.
The model for predicting the percentage of participants seeing the detectable warning from a distance of 2.44 m (8-ft) (PS8) is:
PS8 = 16.18* Ln(percent contrast) + 25.77.
The model for predicting the percentage of participants seeing the detectable warning from a distance of 26 ft (PS26) is:
PS26 = 22.39* Ln(percent contrast) - 18.94
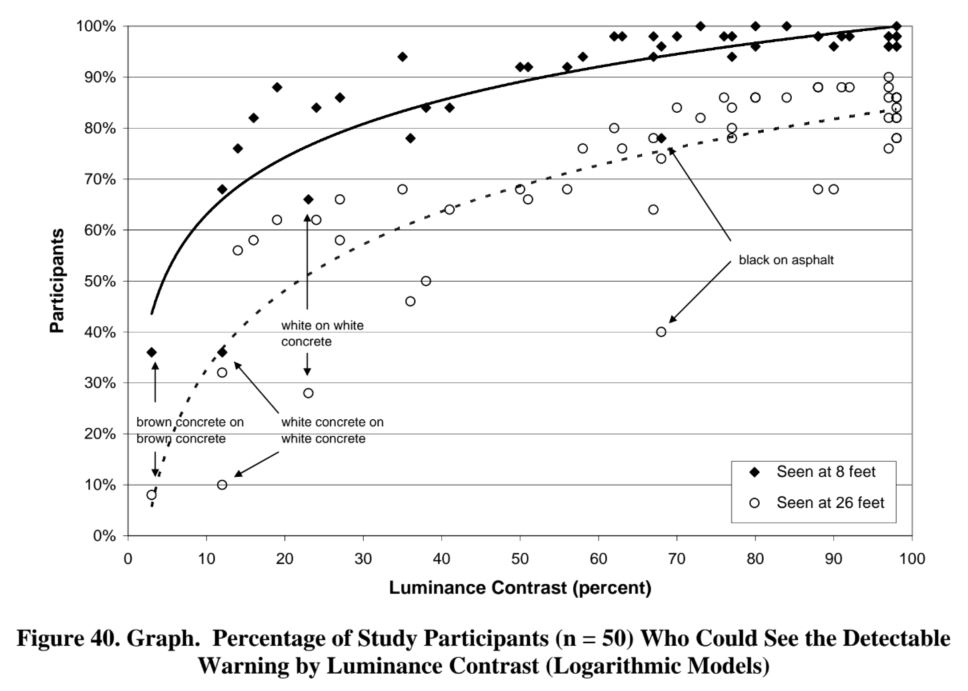
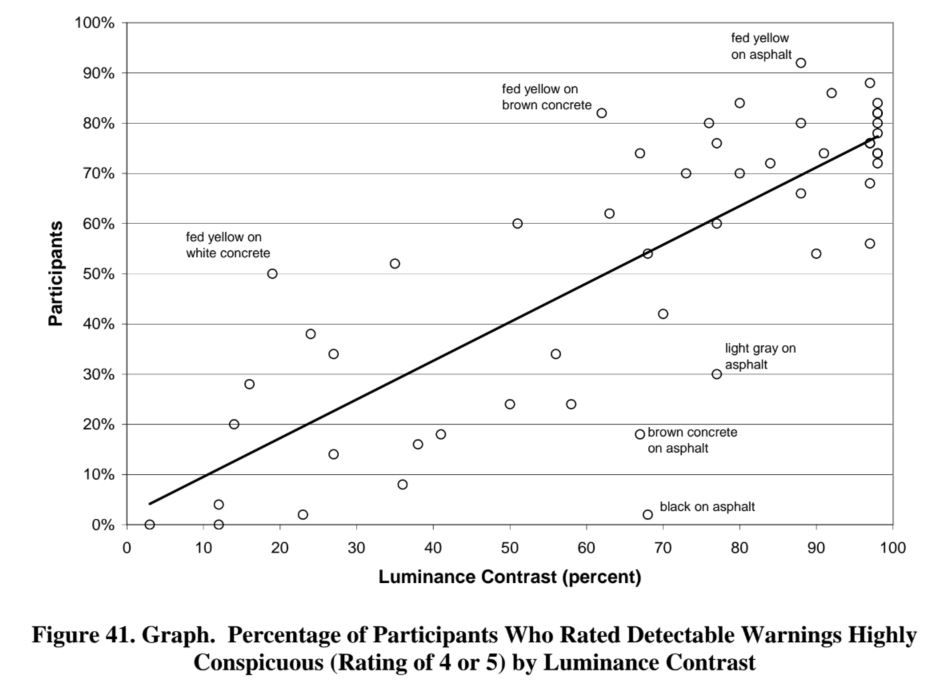
Figure 41 shows the percentage of participants who rated each combination of detectable warning and sidewalk highly conspicuous (rating of 4 or 5) as a function of luminance contrast. The figure shows a positive correlation (r = .80) between perceived conspicuity and luminance contrast. The figure also draws attention to some combinations of detectable warning and sidewalk that were rated either more or less conspicuous than others with similar luminance contrasts. The three most obvious “overachievers” include the federal yellow detectable warning on the white, brown, and asphalt sidewalks. On these sidewalks the federal yellow detectable warning received high conspicuity ratings from more participants than would be expected based on the contrast alone. The three most obvious “underachievers” include the asphalt sidewalk with the black, brown, and light gray detectable warnings. These three detectable warnings on the asphalt sidewalk were rated highly in conspicuity by fewer participants than would be expected based on their contrast.
The linear model used to fit the data for the percentage of participants giving high conspicuity ratings (PHC) is:
PHC = .77* (percent contrast) + 1.84.
This model has a coefficient of determination equal to r2 = .64. A logarithmic model (not shown here) did not fit these data as well as the linear model (r2 = .55), so for all subsequent analyses, contrast was used instead of log contrast to predict high conspicuity ratings.
User Comments/Questions
Add Comment/Question