Visual Detection of Detectable Warning Materials by Pedestrians with Visual Impairments - Final Report
2.7 Comparing Visual Detection Rates and High Conspicuity Ratings for Detectable Warnings
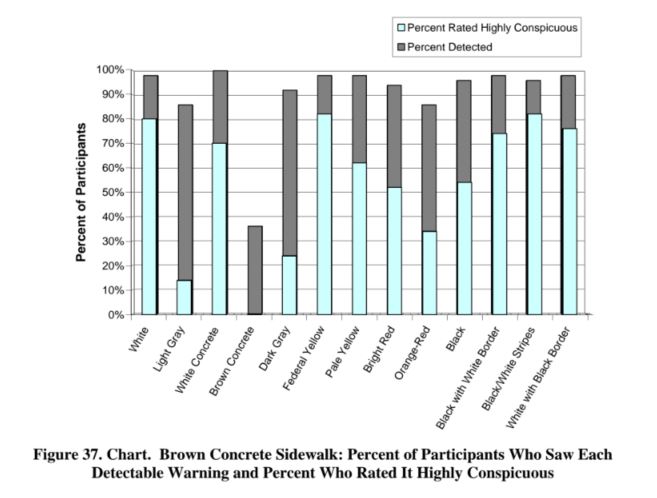
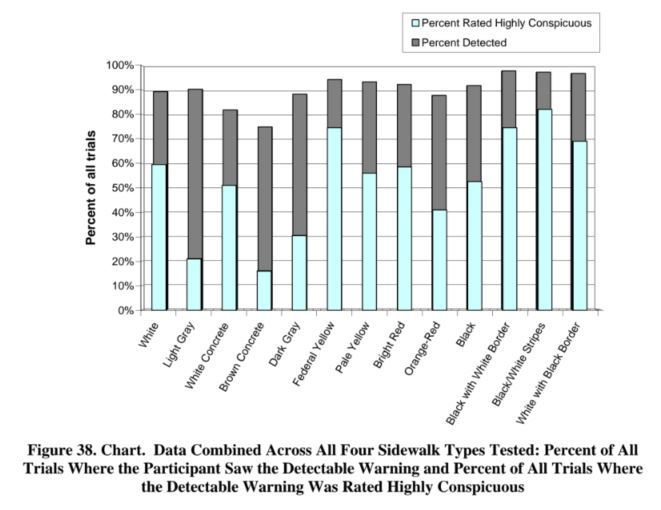
The percentages of participants giving high conspicuity ratings for each detectable warning by sidewalk combination are shown in Table 14. These data, together with data on percentages of participants who saw each detectable warning (from Table 4) are compared in Figure 34 through Figure 38.
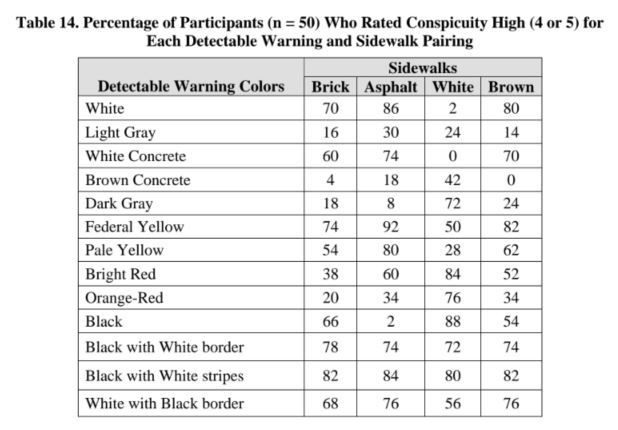
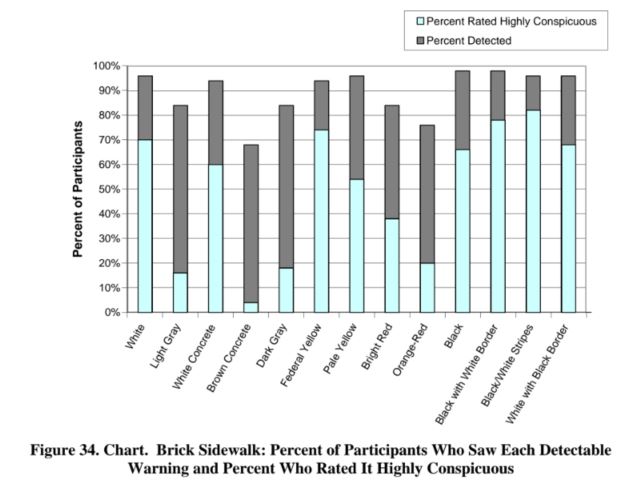
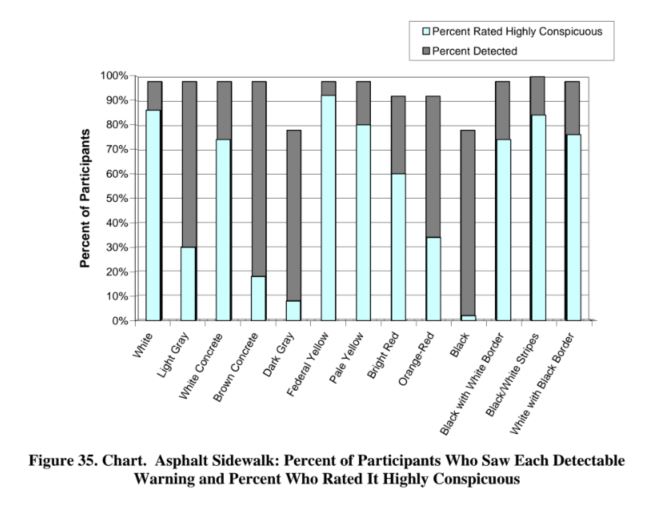
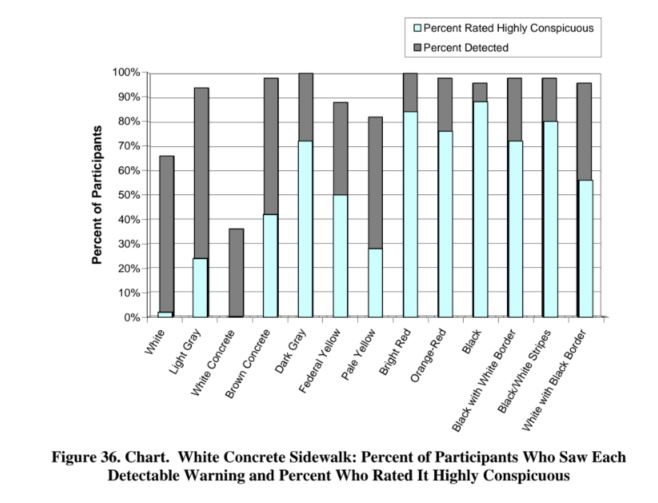
Figure 34 through Figure 37 show the percentage of participants who were able to see each detectable warning from 2.44 m (8 ft) and the percentage of participants who rated the detectable warning as having high conspicuity (giving a rating of 4 or 5). Figure 38 shows the data combined across all participants and all trials for the four sidewalk types. To the extent that the sample of participants in this study is representative of pedestrians with visual impairments, the data shown in Figure 34 through Figure 37 may be used to choose detectable warning colors that are most likely to be highly visually detectable for a particular sidewalk type. Note that when detectable warning color was similar to the side walk color, the number of people who would be served by the visual properties of the detectable warning decreased markedly. The black-and-white stripe pattern was seen by nearly all participants and was highly conspicuous on all four sidewalks tested.
User Comments/Questions
Add Comment/Question