Independent Wheelchair Transfers in the Built Environment: How Transfer Setup Impacts Performance Phase 2: Final Report
Addendum D: Comparison of demographics and transfer height between Phase 1 and Phase 2 of the study
Participants
In the last transfer study a total of 120 participants were enrolled consisting of 95 men and 25 women with an average age of 47.7 ± 15.3 years, body weight of 171.5 ± 48.0 lbs, and height of 67 ± 6 in. At the time this addendum was composed, 63 participants had been enrolled in the Phase II study consisting of 50 men and 13 women, with an average age of 45 ± 15 years, body weight of 172 ± 53lbs and a height of 67±6in. Further details of the demographics from the two studies can be seen in Table D1, including hours using a wheelchair per day, years using a wheelchair and number of level and non-level transfers. The percentages of males and females were the same for both phases of the study with 21% of the participants being female and 79% of the participants being male.
Table D1. Detailed demographics of the study participants from phase 1 and phase 2.
|
|
Average (Std) |
Median |
Min |
Max |
||||
|
|
P1 |
P2 |
P1 |
P2 |
P1 |
P2 |
P1 |
P2 |
|
Age (years) |
48 (15) |
45 (15) |
52 |
49 |
18 |
18 |
85 |
78 |
|
Height (in) |
67 (6) |
67 (6) |
68.5 |
68 |
50 |
46 |
77 |
80 |
|
Weight (lbs) |
172 (48) |
172 ( 53) |
165 |
170 |
90 |
49 |
332 |
300 |
|
Hour using wheel-chair (per day) |
11 (4) |
12 (4) |
12 |
12 |
2 |
3 |
18 |
18 |
|
Years using wheel-chair |
15 (12) |
13 (9) |
13.5 |
11 |
1 |
1 |
59 |
37 |
|
Number of level transfer |
10 (8) |
12 (12) |
7 |
8 |
0 |
0 |
50 |
100 |
|
Number of non-level transfers |
6 (6) |
9 (15) |
4 |
5 |
0 |
0 |
50 |
100 |
Note. P1-Phase 1 P2-Phase 2
Detailed Age Demographics
For phase 1 there were more people clustered around the 45-65 age range, skewing the histogram slightly to the right (Figure D1). For phase 2 there is a small gap in the distribution around 25-35 years old causing the distribution on either side to be greater (Figure D2).
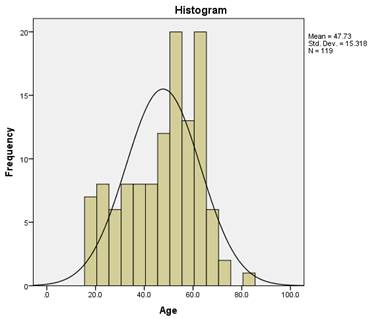
Figure D1. Age histogram phase 1
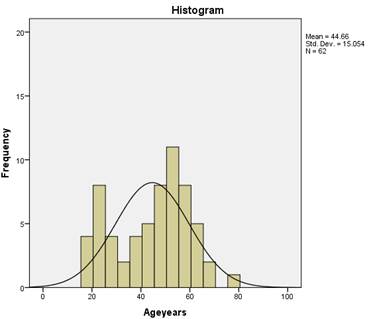
Figure D2. Age histogram for phase 2
Table D2. Percentage of participants in each age category
| Age Bin |
P1 (%) |
P2 (%) |
|
18-24 |
12 |
14 |
|
25-34 |
10 |
14 |
|
35-44 |
15 |
13 |
|
45-54 |
22 |
32 |
|
55-64 |
27 |
21 |
|
65-74 |
13 |
5 |
|
75-84 |
1 |
1 |
Self-Reported Disability Types Demographics
A wide variety of disability types were reported in both of the study samples (Table D3).
Table D3. Participants type of self-reported disability for phase 1 and phase 2
| Disability |
Number of participants |
|||
|
|
Phase 1 (n = 120) |
Phase 2 (n=63) |
||
|
Spinal cord injury |
54 (45%) |
29 (46%) |
||
|
Multiple sclerosis |
10 (8%) |
2 (3%) |
||
|
Cerebral palsy |
11 (9%) |
3 (4%) |
||
|
Lower extremity amputation |
9 (7%) |
8 (12%) |
||
|
Spina bifida |
6 (5%) |
4 (6%) |
||
|
Multiple sclerosis and spinal cord injury |
3 (2%) |
2 (3%) |
||
|
Osteogenesis imperfecta |
2 (1%) |
2 (3%) |
||
|
Post-polio |
2 (1%) |
0 (0%) |
||
|
Traumatic brain injury and spinal cord injury |
2 (1%) |
0 (0%) |
||
|
Muscular dystrophy |
2 (1%) |
1 (1%) |
||
|
Rheumatoid arthritis |
2 (1%) |
1 (1%) |
||
|
Traumatic brain injury |
2 (1%) |
3 (4%) |
||
|
Other Category |
|
|
||
|
Phase 1 (n=15) |
Phase 2 (n=9) |
|
||
|
Traumatic brain injury and lower extremity amputation (n=1) |
Stroke (n=2) |
|
||
|
Spinal cord injury and lower extremity amputation (n=1) |
Ambulatory Dysfunction (n=1) |
|
||
|
Osteoporosis (n=1) |
Double lower extremity amputation and stroke (n=1) |
|
||
|
Stroke (n=1) |
Adrenolukodystrophy (n=1) |
|
||
|
Adams-Oliver syndrome (n=1) |
Cardiac complications (n=1) |
|
||
|
Ambulatory Dysfunction (n=1) |
Guillian-Barre Syndrom (GBS) (n=1) |
|
||
|
Reflex sympathetic dystrophy (n=1) |
Side effect of liver disease (n=1) |
|
||
|
Spinal stenosis (n=1) |
Thrombocytopenia with absent radius (TAR Syndrome) (n=1) |
|
||
|
Epidemiral cyst (n=1) |
|
|
||
|
Double lower extremity amputation and stroke (n=1) |
|
|
||
|
Amyotrophic lateral sclerosis (n=1) |
|
|
||
|
Respiratory problems (n=1) |
|
|
||
|
Sarcoidosis (n=1) |
|
|
||
|
Knee replacement complications (n=1) |
|
|
||
|
Hip injury (n=1) |
|
|
||
Mobility Use Demographics
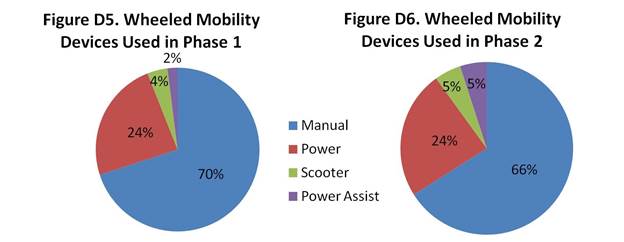
There were 84 manual wheelchair, 29 power wheelchairs, 5 scooter, and 2 power assist users in phase 1 of the study. In comparison, in phase 2 of the study there were 42 manual wheelchairs users, 15 power wheelchairs, 3 scooters and 3 power assist users. The percentages of the total for each type of mobility device for both phases is shown in figures D5 and D6.
Tables D4 and D5 show the breakdown of gender and mobility type by self-reported disability for phase 1 and phase 2.
Table D4. Number of participants by self-reported disability type and WMD type for males study participants for both phases
|
|
Male Participants |
|||||||
|
|
Phase 1 |
Phase 2 |
Phase 1 |
Phase 2 |
Phase 1 |
Phase 2 |
Phase 1 |
Phase 2 |
|
Disability |
Manual WC |
Manual WC |
Power WC |
Power WC |
Scooter |
Scooter |
MPA |
MPA |
|
Spinal Cord Injury |
39 (32.5%) |
19 (30%) |
9 (7.5%) |
4 (6%) |
0(0%) |
0 (0%) |
0 (0%) |
0 (0%) |
|
CP |
1 (1%) |
0 (0%) |
4 (3%) |
0 (0%) |
2 (1%) |
2 (3%) |
0 (0%) |
0 (0%) |
|
MS |
4 (3%) |
1 (1.5%) |
2 (2%) |
1 (1.5%) |
1 (1%) |
1 (1.5%) |
1 (1%) |
0 (0%) |
|
Amputee |
7 (6%) |
8 (12.5%) |
3 (2.5%) |
1 (1.5%) |
0 (0%) |
0 (0%) |
0 (0%) |
0 (0%) |
|
Spina Bifida |
3 (2.5%) |
3 (5%) |
0 (0%) |
1 (1.5%) |
0 (0%) |
0 (0%) |
0 (0%) |
0 (0%) |
|
Other |
11 (9%) |
4 (6%) |
8 (7%) |
4 (6%) |
1 (1%) |
1 (1.5%) |
0 (0%) |
2 (3%) |
|
Total |
65 (54%) |
35 (56%) |
26 (22%) |
11 (17%) |
4 (3%) |
2 (3%) |
1 (1%)_ |
2 (3%) |
Table D5. Number of participants by self-reported disability type and WMD type for females for both phases.
|
|
Female Participants |
|||||||
|
|
Phase 1 |
Phase 2 |
Phase 1 |
Phase 2 |
Phase 1 |
Phase 2 |
Phase 1 |
Phase 2 |
|
Disability |
Manual WC |
Manual WC |
Power WC |
Power WC |
Scooter |
Scooter |
MPA |
MPA |
|
Spinal Cord Injury |
6 (5%) |
6 (9.5%) |
1 (1%) |
0 (0%) |
0 (0%) |
0 (0%) |
0 (0%) |
1 (1.5%) |
|
CP |
1 (1%) |
0 (0%) |
2 (2%) |
2 (3%) |
0 (0%) |
0 (0%) |
1 (1%) |
0 (0%) |
|
MS |
2 (2%) |
0 (0%) |
0 (0%) |
0 (0%) |
0 (0%) |
0 (0%) |
0 (0%) |
0 (0%) |
|
Amputee |
0 (0%) |
0 (0%) |
0 (0%) |
0 (0%) |
0 (0%) |
0 (0%) |
0 (0%) |
0 (0%) |
|
Spina Bifida |
3 (2.5%) |
0 (0%) |
0 (0%) |
0 (0%) |
0 (0%) |
0 (0%) |
0 (0%) |
0 (0%) |
|
Other |
6 (5%) |
1 (1.5%) |
2 (2%) |
2 (3%) |
0 (0%) |
1 (1.5%) |
0 (0%) |
0 (0%) |
|
Total |
18 (15%) |
7 (11%) |
5 (4%) |
4 (6%) |
0 (0%) |
1 (2%) |
1 (1%) |
1 (2%) |
Note. MPA= Manual Power Assist Wheelchair
Comparison of Transfer Protocols
A comparison of the 5th, 25th, 50th, 75th and 95th percentiles between the first transfer study and this study are shown in Tables D6 and D7. This comparison is looking at the level transfer for both of the studies.
Table D6. Highest Transfer Height Obtained
|
|
Percentiles |
|||||
|
|
5th |
25th |
50th |
75th |
95th |
End Ranges |
|
Phase 1 (n=111) |
22.3 |
25.0 |
27.0 |
29.0 |
29.0 |
20-29 |
|
Phase 2 (n=62) |
22.1 |
26.4 |
28.4 |
30.2 |
36.2 |
22-43 |
Table D7. Lowest Transfer Height Obtained
|
|
Percentiles |
|||||
|
|
5th |
25th |
50th |
75th |
95th |
End Ranges |
|
Phase 1 (n=111) |
22 |
18 |
15 |
10 |
10 |
10-23 |
|
Phase 2 (n=62) |
22.9 |
21.9 |
14.4 |
10 |
10 |
10-25 |
The percentiles for the highest transfer height obtained are higher for phase 2 of the study. This is due to the limitations of the transfer station used in phase 1. The station used in phase 1 has a maximum height of 29 inches whereas the station used in phase 2 has a maximum of 43 inches. In phase 1 there were many people that reached the maximum, where as in phase 2 only a couple people reached the maximum.
User Comments/Questions
Add Comment/Question