Independent Wheelchair Transfers in the Built Environment: How Transfer Setup Impacts Performance Phase 2: Final Report
Mobility Use Demographics
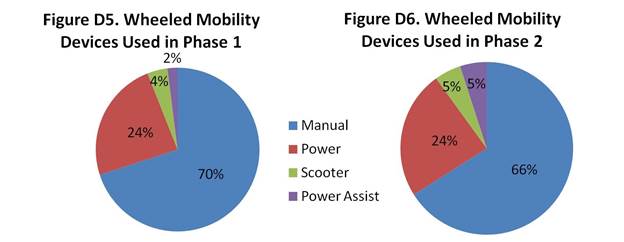
There were 84 manual wheelchair, 29 power wheelchairs, 5 scooter, and 2 power assist users in phase 1 of the study. In comparison, in phase 2 of the study there were 42 manual wheelchairs users, 15 power wheelchairs, 3 scooters and 3 power assist users. The percentages of the total for each type of mobility device for both phases is shown in figures D5 and D6.
Tables D4 and D5 show the breakdown of gender and mobility type by self-reported disability for phase 1 and phase 2.
Table D4. Number of participants by self-reported disability type and WMD type for males study participants for both phases
|
|
Male Participants |
|||||||
|
|
Phase 1 |
Phase 2 |
Phase 1 |
Phase 2 |
Phase 1 |
Phase 2 |
Phase 1 |
Phase 2 |
|
Disability |
Manual WC |
Manual WC |
Power WC |
Power WC |
Scooter |
Scooter |
MPA |
MPA |
|
Spinal Cord Injury |
39 (32.5%) |
19 (30%) |
9 (7.5%) |
4 (6%) |
0(0%) |
0 (0%) |
0 (0%) |
0 (0%) |
|
CP |
1 (1%) |
0 (0%) |
4 (3%) |
0 (0%) |
2 (1%) |
2 (3%) |
0 (0%) |
0 (0%) |
|
MS |
4 (3%) |
1 (1.5%) |
2 (2%) |
1 (1.5%) |
1 (1%) |
1 (1.5%) |
1 (1%) |
0 (0%) |
|
Amputee |
7 (6%) |
8 (12.5%) |
3 (2.5%) |
1 (1.5%) |
0 (0%) |
0 (0%) |
0 (0%) |
0 (0%) |
|
Spina Bifida |
3 (2.5%) |
3 (5%) |
0 (0%) |
1 (1.5%) |
0 (0%) |
0 (0%) |
0 (0%) |
0 (0%) |
|
Other |
11 (9%) |
4 (6%) |
8 (7%) |
4 (6%) |
1 (1%) |
1 (1.5%) |
0 (0%) |
2 (3%) |
|
Total |
65 (54%) |
35 (56%) |
26 (22%) |
11 (17%) |
4 (3%) |
2 (3%) |
1 (1%)_ |
2 (3%) |
Table D5. Number of participants by self-reported disability type and WMD type for females for both phases.
|
|
Female Participants |
|||||||
|
|
Phase 1 |
Phase 2 |
Phase 1 |
Phase 2 |
Phase 1 |
Phase 2 |
Phase 1 |
Phase 2 |
|
Disability |
Manual WC |
Manual WC |
Power WC |
Power WC |
Scooter |
Scooter |
MPA |
MPA |
|
Spinal Cord Injury |
6 (5%) |
6 (9.5%) |
1 (1%) |
0 (0%) |
0 (0%) |
0 (0%) |
0 (0%) |
1 (1.5%) |
|
CP |
1 (1%) |
0 (0%) |
2 (2%) |
2 (3%) |
0 (0%) |
0 (0%) |
1 (1%) |
0 (0%) |
|
MS |
2 (2%) |
0 (0%) |
0 (0%) |
0 (0%) |
0 (0%) |
0 (0%) |
0 (0%) |
0 (0%) |
|
Amputee |
0 (0%) |
0 (0%) |
0 (0%) |
0 (0%) |
0 (0%) |
0 (0%) |
0 (0%) |
0 (0%) |
|
Spina Bifida |
3 (2.5%) |
0 (0%) |
0 (0%) |
0 (0%) |
0 (0%) |
0 (0%) |
0 (0%) |
0 (0%) |
|
Other |
6 (5%) |
1 (1.5%) |
2 (2%) |
2 (3%) |
0 (0%) |
1 (1.5%) |
0 (0%) |
0 (0%) |
|
Total |
18 (15%) |
7 (11%) |
5 (4%) |
4 (6%) |
0 (0%) |
1 (2%) |
1 (1%) |
1 (2%) |
Note. MPA= Manual Power Assist Wheelchair
User Comments/Questions
Add Comment/Question