Independent Wheelchair Transfers in the Built Environment: How Transfer Setup Impacts Performance Phase 2: Final Report
Detailed Age Demographics
For phase 1 there were more people clustered around the 45-65 age range, skewing the histogram slightly to the right (Figure D1). For phase 2 there is a small gap in the distribution around 25-35 years old causing the distribution on either side to be greater (Figure D2).
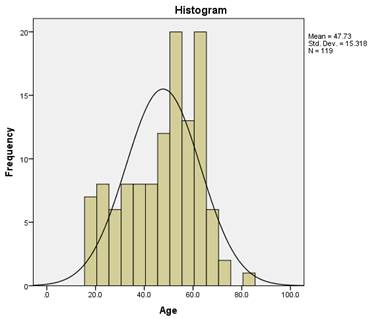
Figure D1. Age histogram phase 1
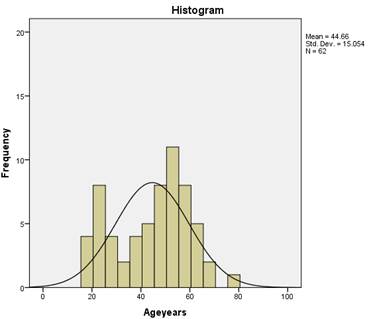
Figure D2. Age histogram for phase 2
Table D2. Percentage of participants in each age category
| Age Bin |
P1 (%) |
P2 (%) |
|
18-24 |
12 |
14 |
|
25-34 |
10 |
14 |
|
35-44 |
15 |
13 |
|
45-54 |
22 |
32 |
|
55-64 |
27 |
21 |
|
65-74 |
13 |
5 |
|
75-84 |
1 |
1 |
User Comments/Questions
Add Comment/Question