Visual Detection of Detectable Warning Materials by Pedestrians with Visual Impairments - Final Report
2.2 Lighting Conditions
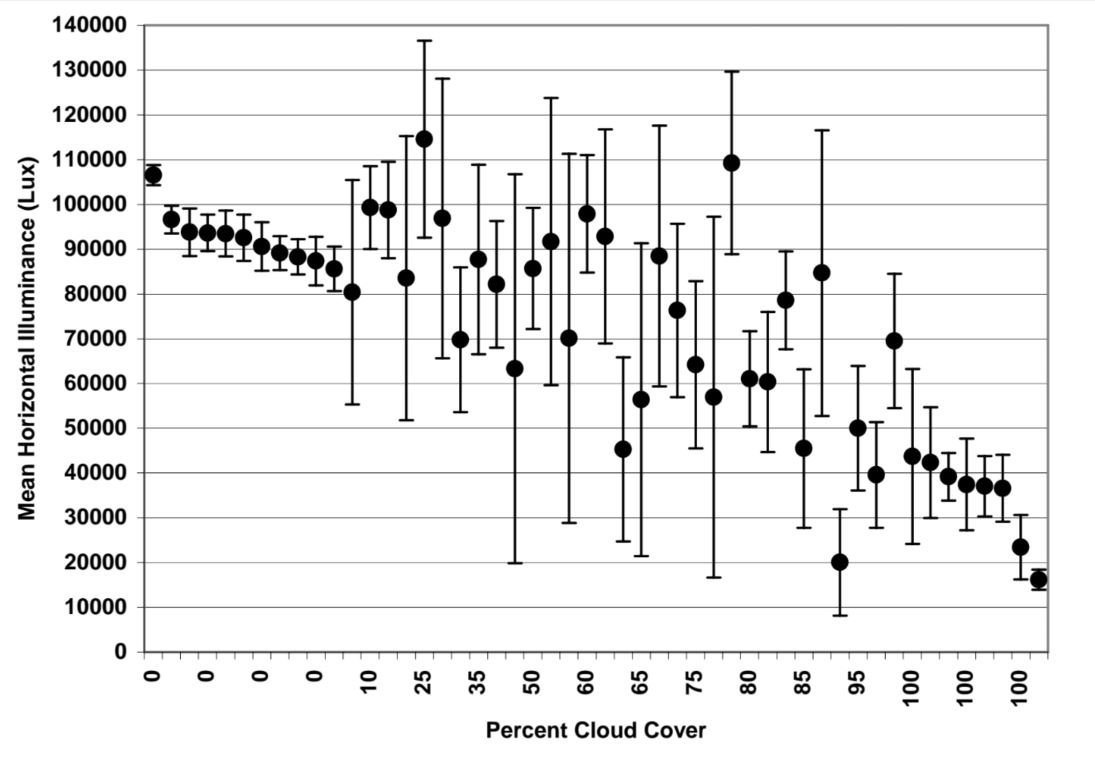
At the beginning of each testing session, experimenters visually assessed sky conditions and estimated the percent cloud cover. On each trial one measurement of horizontal illuminance was manually recorded from a Minolta T-1 Illuminance meter. The mean illuminance and standard deviation of illuminances for each participant’s trials are plotted in Figure 7. Data have been ordered from left to right by the estimated percent cloud cover that was present during the participant’s testing session. Note that the scale on the abscissa is categorical (not linear) to provide clear separation between data points. This figure shows that the fifty testing sessions varied in terms of percent cloud cover from 0 percent to 100 percent, and that mean illumination for different participants ranged from approximately 18,000 lux to 115,000 lux. Sessions with either no cloud cover (0%) or complete cloud cover (100%) tended to have low variability (smaller standard deviations) in illuminance across trials, while sessions with moderate cloud cover tended to have higher variability in horizontal illuminance across trials. As discussed below in the results section, neither illuminance level nor amount of cloud cover was significantly related to the probability of the participant seeing the detectable warning. Also, these two aspects of the lighting conditions were not significantly related to the probability of the participant giving a detectable warning a high conspicuity rating.
Figure 7. Graph. Horizontal Illuminance (Mean and Standard Deviation) for Each Participant’s Trials by the Estimated Percent Cloud Cover During the Testing Session
User Comments/Questions
Add Comment/Question