Visual Detection of Detectable Warning Materials by Pedestrians with Visual Impairments - Final Report
2.1 Participants’ Vision
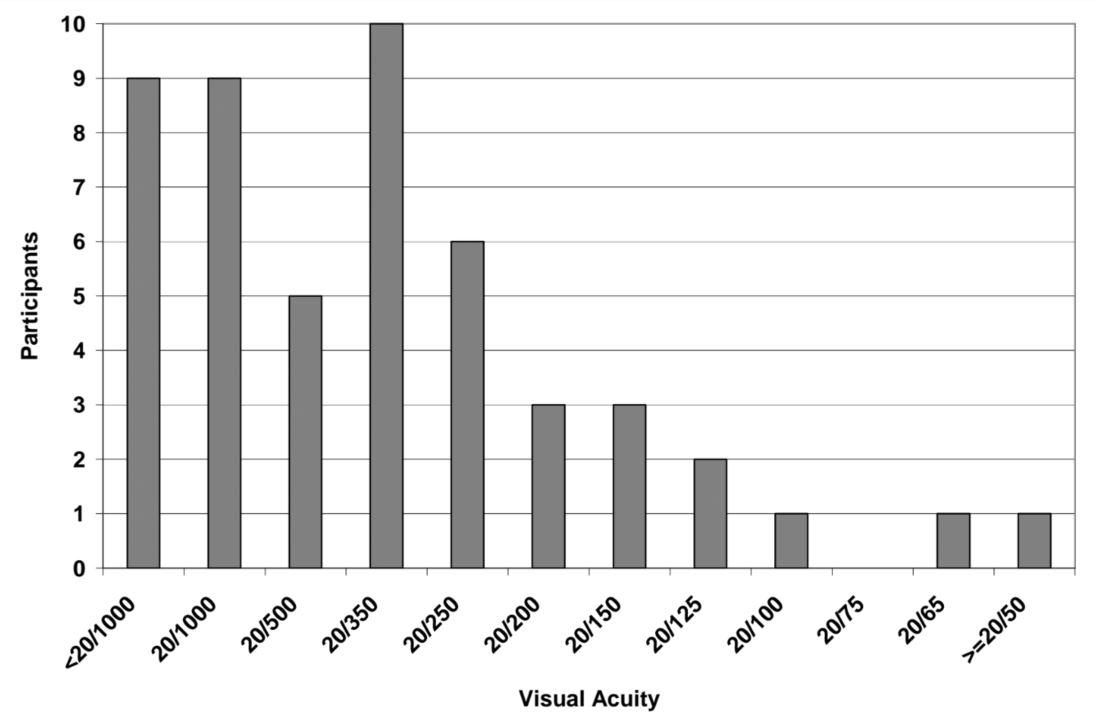
The distribution of acuity scores for participants in this study is shown in Figure 5. Normal visual acuity on this scale is 20/20, which is not shown because it would be plotted far to the right of the distribution. From the adjusted viewing distance of 1.22 m (4 ft), one participant was able to read the bottom line of the chart (smallest letters) which indicated that her acuity was 20/50 or better. Despite having relatively good acuity, this participant was retained in the study because she reported having a large visual field loss. Forty-two of the participants had visual acuities of 20/200 or less, including nine participants who were unable to read the top line (largest letter) of the acuity chart, indicating that their visual acuity was less than 20/1000.
Figure 5. Chart. Distribution of Participants’ Visual Acuity
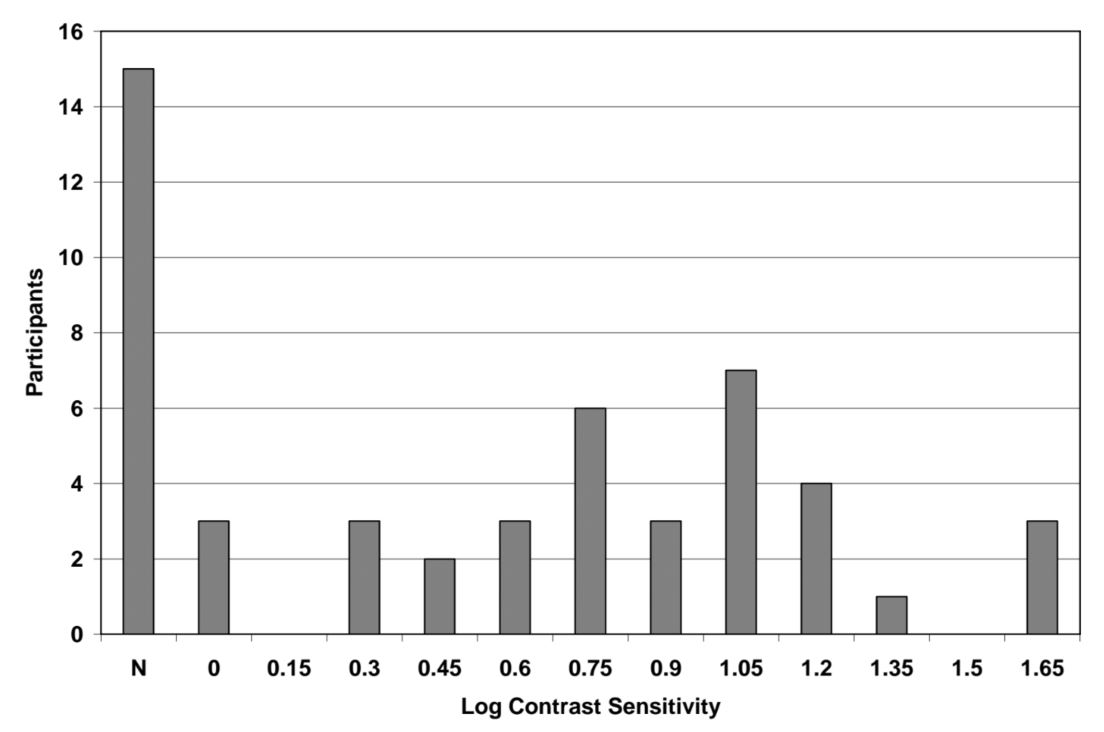
Participants’ contrast sensitivity was tested with a Pelli-Robson Contrast Sensitivity chart. The letters on this chart are all large, but the contrast of letters decreases from left to right and from the top of the chart to the bottom. Participants viewed this chart from a distance of one meter. The chart was illuminated uniformly according to the instructions provided by the manufacturer. Figure 6 shows the distribution of participants’ contrast sensitivity scores. Note that the common logarithm of contrast sensitivity is plotted along the abscissa. A log contrast sensitivity score of zero indicates that the participant was able to read only the black letters on a white background at the full level of 100 percent contrast. The nominal value for normal log contrast sensitivity is 2.0, which corresponds to the ability to distinguish letters having only 1 percent contrast. All of the participants in this study had reduced contrast sensitivity. There were 15 participants who were unable to read even the highest contrast letters on the Pelli-Robson chart from a distance of one meter. This group is shown by the “N” label on the left side of the abscissa to indicate that their contrast sensitivity was not measurable with this test.
Figure 6. Chart. Distribution of Participants’ Contrast Sensitivity Measured With the Pelli-Robson Chart
The recently revised (Fourth Edition) of the H.R.R. Pseudoisochromatic Plates test (Richmond Products, Boca Raton, FL) was used to screen participants for red-green and blue-yellow abnormalities in color vision. Because most participants in this study were not able to read any symbols on the H.R.R. Pseudoisochromatic Plates test, no results for this test are reported (see Appendix E for a description of vision testing procedures).
User Comments/Questions
Add Comment/Question