The Impact of Transfer Setup on the Performance of Independent Transfers: Phase I Final Report
Chapter 3: Study findings
Expert opinion on current literature
Nineteen articles met the relevancy criteria. The aspects of setup that experts felt were addressed to some degree included vertical transfer distance, transferring across a gap and position of the mobility device relative to target destination.
None of the 19 articles were scored as having strong to very strong resulting evidence. There is a consensus among studies that transferring to a higher surface implies greater exertion of the upper limb (3-6) . However, there were no studies that specifically investigated the range of heights feasibly attainable by subjects which is important for determining the suitability of existing accessibility guidelines concerning transfers (7). There was not enough evidence in any one study or combination thereof that would enable for determining how high or low, how close, and how much space is needed next to the target surface so it can be accessible by a majority of wheelchair users.
3. Nyland J, Quigley P, Huang C, Lloyed J, Harrow J, Nelson A. Preserving transfer independence among individuals with spinal cord injury. Spinal Cord. 2000;38(11):649-57.
4. Gagnon D, Nadeau S, Noreau L, Eng J, Gravel D. Trunk and upper extremity kinematics during pivot transfers performed by individuals with sipanl cord injury. Clinical Biomechanics (Bristol, Avon). 2008;23(3):279-90.
5. Gagnon D, Nadeau S, Noreau L, Eng J, Gravel D. Electromyographic patterns of upper extremity muscles during sitting pivot transfers performed by individuals with spinal cord injury. Journal of Electromyography and Kinesiology. 2009;19(3):509-20.
6. Gagnon D, Nadeau S, Gravel D, Noreau L, Lariviere C, McFadyen B. Movement patterns and muscular demands during posterior transfers toward an elevated surface in individuals with spinal cord injury. Spinal Cord. 2005;43(2):74-84.
7. Americans with Disabilities Act and Architectural Barriers Act Accessibility Guidelines. In: Board USA, editor. Washington DC 2004.
Subjects
The sample consisted of 95 men and 25 women with an average age of 47.7 ± 15.3 years, body weight of 77.8 ± 21.8 kg, and height of 1.70 ± 0.14 m. We enrolled subjects with a broad variety of disabilities ranging from spinal cord injury (SCI), multiple sclerosis (MS), cerebral palsy (CP), and post-polio among others.
Table 1 contains the self-reported type of disabilities and the number of subjects that reported them. We asked those with spinal cord injury to report their level of injury as well as type of injury (complete or incomplete). Table 2 contains the self-reported levels of spinal cord injuries (C-cervical, T-Thoracic, and L-Lumbar) for the subjects that reported only spinal cord injury as their type of disability; 59% of this group reported having incomplete spinal cord injuries.
Table 1 . Subjects’ self-reported type of disability (n=120).
| Disability |
Number of subjects |
|
Spinal cord injury |
54 |
|
Multiple sclerosis |
10 |
|
Cerebral palsy |
11 |
|
Lower extremity amputation |
9 |
|
Spina bifida |
6 |
|
Multiple sclerosis and spinal cord injury |
3 |
|
Osteogenesis imperfect |
2 |
|
Post-polio |
2 |
|
Traumatic brain injury and spinal cord injury |
2 |
|
Traumatic brain injury and lower extremity amputation |
1 |
|
Muscular dystrophy |
2 |
|
Rheumatoid arthritis |
2 |
|
Traumatic brain injury |
2 |
|
Spinal cord injury and lower extremity amputation |
1 |
|
Osteoporosis |
1 |
|
Stroke |
1 |
|
Adams-Oliver syndrome |
1 |
|
Ambulatory Dysfunction |
1 |
|
Reflex sympathetic dystrophy |
1 |
|
Spinal stenosis |
1 |
|
Epidemiral cyst |
1 |
|
Double lower extremity amputation and stroke |
1 |
|
Amyotrophic lateral sclerosis |
1 |
|
Respiratory problems |
1 |
|
Sarcoidosis |
1 |
|
Knee replacement complications |
1 |
|
Hip injury |
1 |
Table 1 Alternative Text Description: This table gives the Subjects’ self-reported type of disability. There are two columns; the left side lists the disability and the right side gives the number of subjects who reported having that disability. The total number of subjects adds up to 120.
Table 2 . Level of spinal cord injury for the subjects that only self-reported SCI as their disability (n=54).
| Level of injury |
Number of subjects |
|
C3 |
1 |
|
C4 |
2 |
|
C5 |
2 |
|
C6 |
4 |
|
C7 |
2 |
|
T2 |
1 |
|
T3 |
2 |
|
T4 |
2 |
|
T5 |
4 |
|
T6 |
3 |
|
T7 |
6 |
|
T8 |
2 |
|
T9 |
2 |
|
T10 |
1 |
|
T11 |
6 |
|
T12 |
5 |
|
L1 |
2 |
|
L2 |
1 |
|
L4 |
3 |
|
Not reported |
3 |
Abbreviation: C= Cervical, T=Thoracic, L=Lumbar
Table 2 Alternative Text Description: This table gives the level of spinal cord injury for the subjects that only self-reported SCI as their disability. There are two columns; the left side list the level of injury and the right side lists the number of subjects who reported having that level of spinal cord injury. The total number of subjects that reported SCI as their disability was 54.
The sample as a whole had been using a WMD for 14.9 ±12.1 years with a range from 1 to 59 years. Wheelchair seat plus the cushion height measured at the edge was 21.6 ± 1.4” (54.8 ± 3.4 cm) median was 22” (55.8 cm) and range: 17 – 25” (43.2 – 63.5 cm). There were 84 manual wheelchair, 29 power wheelchair, 5 scooter, and 2 power assist users. 18% (22/120) reported using assistive technology for transfers: 14 used transfer board, 3 lifts, 3 canes, and 2 walkers.
Four of the 120 subjects enrolled in the study met inclusion criteria for independent transfer but were unable to transfer to/from the station based on space constraints and their method of approach. All these subjects were power wheelchair users except for subject S4 who used a manual wheelchair. Subject S3 used a transfer board in his transfers. This group’s demographics are expanded in The remaining 116 subjects completed all or portions of the study. The reason for not completing all portions of the study was mainly due to time constraints, such as having to end participation in the study because the participants were short on time. Figure 8 summarizes the number of subjects for each protocol. A few subjects ended the study early due to experiencing fatigue or pain. The average number of transfers performed during the study was 22.9 ± 9.6 (range: 0-48). Moving from the WMD to the transfer station and from the transfer station to the WMD counted as two transfers.
Table 3. Demographics characteristics of the subjects who were not able to attain any transfers.
Subject ID |
Diagnosis |
Gender |
Age |
Weight |
Height |
Years using WMD |
|
S1 |
Cerebral palsy |
Male |
57 |
140lbs (63.5kg) |
68in (1.73m) |
52 |
|
S2 |
Cerebral palsy |
Male |
Unknown |
Unknown |
Unknown |
Unknown |
|
S3 |
Stroke and double above knee amputee |
Male |
55 |
250lbs(113.4kg) |
72in (1.83m) |
4 |
|
S4 |
Cerebral palsy |
Female |
41 |
160lbs(72.6kg) |
57in (1.45m) |
40 |
Table 3 Alternative Text Description: This table gives the demographic characteristics of the subjects who were not able to attain any transfers. The table lists four subjects (three male and one female). Three of the subjects had cerebral palsy and one had a stroke and double above knee amputation. The numbers of known years each of these subjects have been using a WMD ranges from 4-52 years.
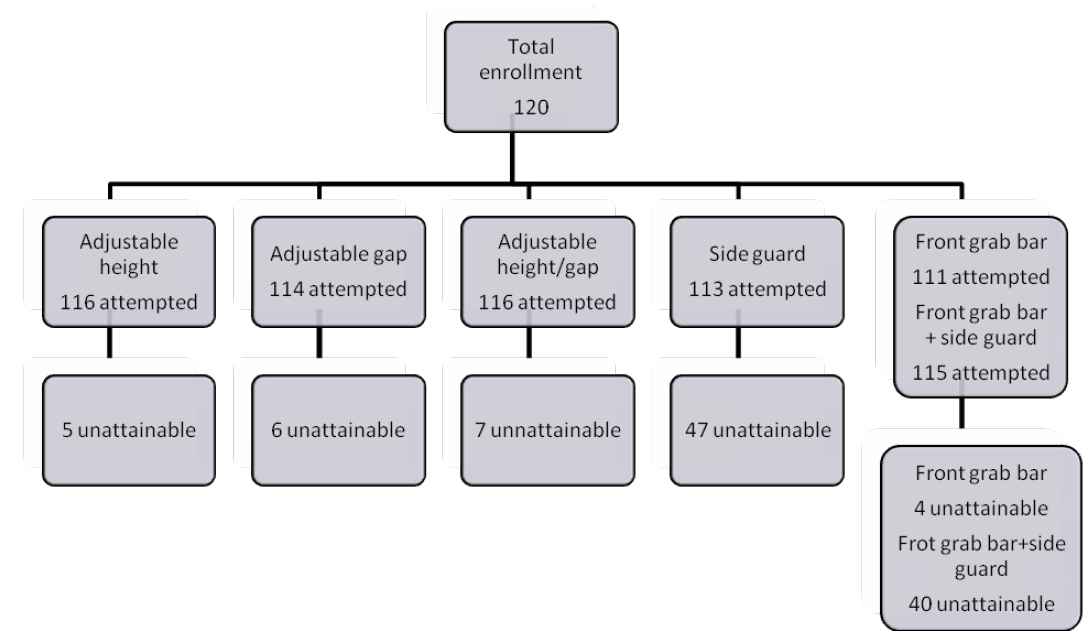
Figure 8 . Total number of subjects that attempted each protocol and that were unattainable.
Adjustable height protocol
One hundred and sixteen (116) subjects were tested under this protocol and five were unable to transfer to the platform at any height in the configuration shown in (Figure 3). 92%, CI[86%,96%] of the sample (107/116) could transfer at a height of 22” (50.8cm). Fewer numbers of subjects could transfer above and below this height (Figure 9 and Table 4).
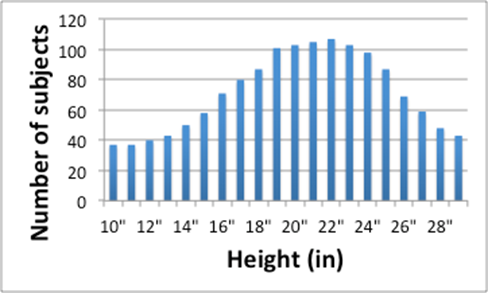
Figure 9 . Number of subjects (y-axis) able to transfer at each height increment (x-axis).
Table 4 . Percentage of subjects that were able to attain a transfer under adjustable height protocol
| Height (in) |
% Subjects Adjustable Height |
% Subjects Side guard |
|
10 |
28% |
24% |
|
11 |
28% |
25% |
|
12 |
34% |
26% |
|
13 |
37% |
27% |
|
14 |
43% |
27% |
|
15 |
49% |
31% |
|
16 |
62% |
35% |
|
17 |
69% |
40% |
|
18 |
75% |
41% |
|
19 |
88% |
43% |
|
20 |
89% |
48% |
|
21 |
91% |
51% |
|
22 |
92% |
52% |
|
23 |
90% |
51% |
|
24 |
85% |
46% |
|
25 |
73% |
46% |
|
26 |
60% |
41% |
|
27 |
50% |
38% |
|
28 |
42% |
27% |
|
29 |
37% |
22% |
Table 4 Alternative Text Description: This table gives the percentage of subjects that were able to attain a transfer under the adjustable height protocol compared to the percentage of subjects that were able to attain the transfer with the side guard in place. There are three columns; the left one lists the transfer height in inches, the middle one lists the percentage of subjects that attained the adjustable height transfer, the right one lists the percentage of subjects that attained the adjustable height transfer with the side guard.
Table 5 contains the height differentials that subjects were able to attain. For each participant, these height differentials were calculated as the relative height difference by subtracting the maximum attainable height (high and low) to the WMD seat height. The results suggest that 2” transfer heights above and below the WMD seat height are acceptable for at least 86% of the subjects that could attain the Adjustable Height protocol.
Table 5 . Percentage of subjects that were able to attain step heights.
| Relative Heights (in) |
Attainable (%) |
|
-6 |
57% |
|
-5 |
64% |
|
-4 |
69% |
|
-3 |
78% |
|
-2 |
86% |
|
-1 |
96% |
|
0 |
96% |
|
1 |
94% |
|
2 |
89% |
|
3 |
76% |
|
4 |
63% |
|
5 |
51% |
|
6 |
43% |
Table 5 Alternative Text Description: This table gives the percentage of subjects that were able to attain step heights. There are two columns; the left one lists the relative heights attained in inches, the right one lists the percentages of subjects that were able to attain that height.
Subjects that could not attain the protocol
In addition to the 4 subjects that could not attain any of the protocols, two additional subjects (1 woman, 1 man) could not attain the adjustable height protocol. The woman was 51 years old and had a an incomplete spinal cord injury at level L4, weighted 170 lbs, was 64” tall, and had been using a manual wheelchair for one year. The man was 68 years old and had a complete spinal cord injury at level T2, weighted 185 lbs, was 71” tall, had been using a manual wheelchair for 7 years, and used a walker to aid with his transfers.
Adjustable gap protocol
One hundred and fourteen (114) subjects were tested under this protocol and six could not transfer with a gap of any size added between their WMD and the platform in the configuration shown in (Figure 4). 95% (108/114) of the sample were able to safely attain a level transfer with a gap of 3.5” (8.9 cm). Around 81% (92/114), CI[72%,87%] of the sample were able to transfer with a gap of 7” (17.8 cm) or less (Figure 10 and Table 6).
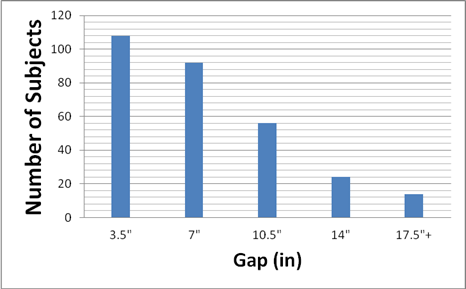
Figure 10 . Number of subjects (y-axis) able to transfer with a certain gap (x-axis).
Table 6 . Percentage of subjects that a transfer under adjustable gap protocol
| Gap |
% of subjects |
|
3.5" |
95% |
|
7" |
81% |
|
10.5" |
49% |
|
14" |
21% |
|
17.5"+ |
12% |
Table 6 Alternative Text Description: This table gives the percentages of subjects that attained a transfer under the adjustable gap protocol for different gap distances. There are two columns; the left one gives the gap distance range, the right one gives the percentage of subjects that were able attain that gap distance.
Subjects that could not attain the protocol
In addition to the 4 subjects that could not attain any of the protocols, two additional men could not attain the adjustable gap protocol. One was a 41 year old men that had a traumatic brain injury and double lower knee amputation, weighted 192 lbs, did not report his height, and had been using a manual wheelchair for twenty years. The second subject was 68 years old and had a complete spinal cord injury at level T2, weighted 185 lbs, was 71” tall, had been using a manual wheelchair for 7 years, and used a walker to aid with his transfers. This last subject could not attain the adjustable height protocol as mentioned above.
Adjustable height/gap protocol
One-hundred and sixteen (116) subjects were tested under this protocol, of which seven were unable to transfer with a height/gap combination in the configuration shown in (Figure 5). 86% (100/116), CI [79%, 91%] of the sample were able to attain a height of 22” (55.9 cm) with a gap of 3.5” ( 7.6 cm). The number of subjects who are able to achieve transfers for any height beyond a 7" (17.8 cm) gap distance dropped off dramatically (Figure 11 and Table 7).
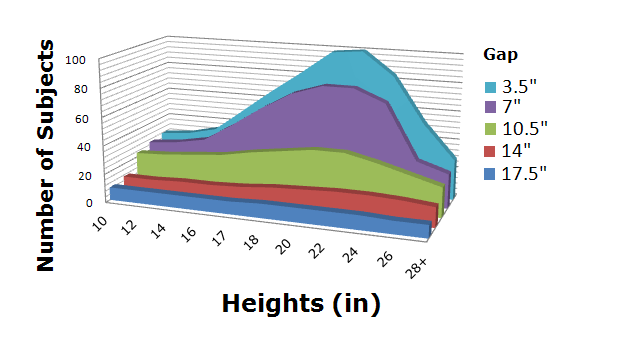
Figure 11 . Number of subjects (z-axis) able to attained a certain gap (y-axis) at a certain height (x-axis).
Table 7 . Number of subjects that were able to attain a certain gap at a certain height under adjustable height/gap protocol
| Height\Gap |
3.5" |
7" |
10.5" |
14" |
17.5"+ |
|
10" |
24% |
22% |
20% |
9% |
8% |
|
12" |
26% |
24% |
21% |
9% |
8% |
|
14" |
30% |
28% |
22% |
10% |
8% |
|
16" |
44% |
39% |
24% |
10% |
8% |
|
17" |
58% |
51% |
28% |
11% |
8% |
|
18" |
71% |
61% |
30% |
13% |
9% |
|
20" |
84% |
67% |
33% |
14% |
9% |
|
22" |
86% |
67% |
33% |
15% |
9% |
|
24" |
72% |
59% |
28% |
15% |
9% |
|
26" |
45% |
27% |
23% |
14% |
8% |
|
28"+ |
24% |
21% |
18% |
12% |
8% |
Table 7 Alternative Text Description: This table gives the number of subjects that were able to attain a certain gap at a certain height under the adjustable height/gap protocol. There are seven columns; the left one lists the height of the transfer in inches, the rest of the columns list the percentages of subjects that could attain the transfer at increasing gap distances. The number of subjects who were able to achieve transfers for any height beyond a 7” (17.9 cm) gap distance dropped off dramatically.
Subjects that could not attain the protocol
In addition to the 4 subjects that could not attain any of the protocols, three additional men could not attain the adjustable height/gap protocol. One had a complete spinal cord injury at level L4, weighted 145 lbs, 67” tall, and had been using a manual wheelchair for twenty years and used a transfer board during transfers. The second subject had a complete spinal cord injury at level T2, weighted 185 lbs, was 71” tall, had been using a manual wheelchair for 7 years, and used a walker to aid with his transfers. This subject could not attain the adjustable height protocol and adjustable gap as mentioned above. The last subject of this group was a 69 year old men who had amyotrophic lateral sclerosis, weighted 130 lbs, 67” tall, and had been using a power wheelchair for one year.
Side guard protocol
One-hundred and thirteen (113) subjects were tested under this protocol. As described above, side guard height was adjusted to be 6” higher than the WMD seat when the platform was level or lowered and 6” above the platform height when the platform was raised. 42% (47/113), CI[30%,47%] of the subjects could not achieve a transfer with the side guard in place and with the platform at level with the WMD. When the conditions were changed (height raised/lowered or gap introduced) the transfers were unattainable to up to 47% (53/113), CI[37%,55%] of the participants. Of the 60 subjects that were able to transfer to a higher level than their own WMD, 98% (59/60), CI[91%,99%] were able to transfer to height of 22” (55.9cm) (Figure 12 and Table 8). At the extreme ranges of platform heights 22% (25/113), CI[24%,31%] were able to transfer to the highest height of 29” (73.7 cm). 24% (27/113), CI[17%,32%] were able to transfer to the lowest height of 10” (25.4cm).
When a gap was introduced with the side guard 60 subjects were able to attain this transfer. 41% (46/113), CI[34%,52%] were able to transfer at a height level with their WMD and a gap of 7" (17.8 cm). Only6% (7/113), CI[4%,13%] could transfer with a 17.5” (40.6cm) or greater gap (Figure 13 and 9).
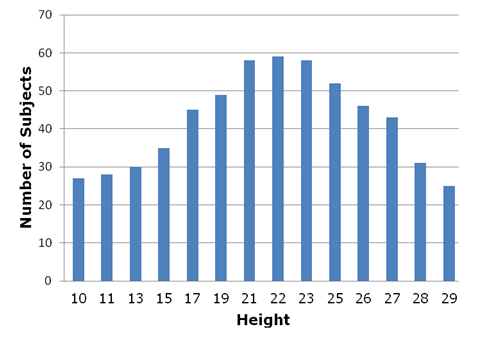
Figure 12. Number of subjects (y-axis) able to transfer at different heights (x-axis) with the side guard in place.
Table 8 . Percentage of subjects that were able to attain a certain height in the side guard protocol
|
Height (in) |
% Subjects Side guard |
|
10 |
24% |
|
11 |
25% |
|
12 |
26% |
|
13 |
27% |
|
14 |
27% |
|
15 |
31% |
|
16 |
35% |
|
17 |
40% |
|
18 |
41% |
|
19 |
43% |
|
20 |
48% |
|
21 |
51% |
|
22 |
52% |
|
23 |
51% |
|
24 |
46% |
|
25 |
46% |
|
26 |
41% |
|
27 |
38% |
|
28 |
27% |
|
29 |
22% |
Table 8 Alternative Text Description: This table gives the percentage of subjects that were able to attain a certain height during the side guard protocol. There are two columns; the left one lists the transfer height, the right one lists the percentage of subjects that were able to attain that height.
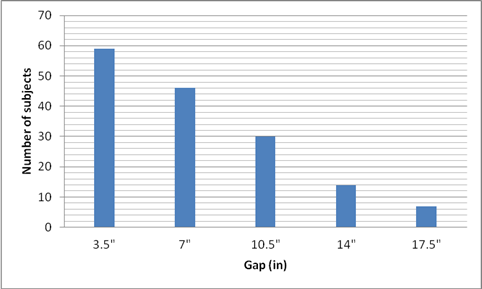
Figure 13. Number of subjects (y-axis) able to transfer with different gaps (x-axis) at a level transfer with the side guard in place
Table 9 . Percentage of subjects that were able to attain a certain gap in the side guard protocol
Gap |
% Subjects |
|
3.5" |
52% |
|
7" |
41% |
|
10.5" |
27% |
|
14" |
12% |
|
17.5" |
6% |
Table 9 Alternative Text Description: This table gives the percentage of subjects that were able to attain a transfer with a certain gap during the side guard protocol. There are two columns; the left one list the gap distances; the right one list the percentages of subjects that were able to attain the transfer at that gap distance. Forty-one percent of the subjects were able to transfer at a height level with their WMD and a gap of 7 inches. Only 6% could transfer with a 17.5 inch or greater gap.
Subjects that could not attain the protocol
In addition to the 4 subjects that could not attain any of the protocols, forty-three additional subjects could not attain the side guard protocol. Table 10 contains basic demographic characteristics of these 43 subjects.
Table 10 . Demographics of the subjects that could not attain protocol side guard.
| Diag-nosis |
Gender |
Age |
Weight (lbs) |
Height (lbs) |
Years using WMD |
Type of WMD |
AT for transfers |
|
SCI T7-C |
M |
40 |
142 |
67 |
15 |
M |
|
|
SCI T6-C |
M |
47 |
216 |
74 |
1 |
M |
|
|
SCI T11 –C |
M |
34 |
130 |
70 |
2 |
M |
|
|
MS |
M |
52 |
203 |
71 |
10 |
P |
Transfer board |
|
RSD |
F |
37 |
118 |
62 |
5 |
M |
Transfer board |
|
MS |
M |
62 |
180 |
60 |
37 |
S |
|
|
SCI |
M |
56 |
165 |
62 |
22 |
M |
|
|
SCI T5-I |
M |
57 |
160 |
72 |
16 |
M |
|
|
AK amputee |
M |
62 |
245 |
69 |
11 |
P |
|
|
SCI L1 –C |
M |
65 |
150 |
68 |
25 |
M |
|
|
SCI L3-I/LAKA |
M |
65 |
211 |
72 |
13 |
P |
|
|
SCI C5 –I |
M |
53 |
160 |
71 |
26 |
M |
Transfer board |
|
SCI L4 –I |
M |
71 |
228 |
70 |
10 |
P |
|
|
SCI T11-C |
M |
65 |
195 |
70 |
4 |
P |
Transfer board |
|
SCI T11- I |
M |
46 |
194 |
68 |
16 |
M |
|
|
MS |
M |
58 |
205 |
69 |
20 |
M |
Transfer board |
|
SCI T3 –I |
M |
55 |
225 |
56 |
10 |
M |
|
|
SCI T12 –C |
M |
61 |
150 |
70 |
4 |
M |
|
|
MS |
F |
61 |
125 |
69 |
N/A |
M |
|
|
CP |
M |
57 |
140 |
68 |
52 |
P |
|
|
SCI T12-I |
M |
54 |
190 |
72 |
30 |
M |
|
|
MS |
M |
36 |
160 |
63 |
9 |
M |
|
|
Post polio |
F |
66 |
250 |
62 |
56 |
M |
|
|
SCI C6 –I |
M |
29 |
120 |
70 |
5 |
M |
|
|
SCI T5 –I |
M |
31 |
170 |
73 |
10 |
S |
|
|
SCI L3 -I |
M |
39 |
287 |
69 |
15 |
M |
|
|
SCI T4- C |
M |
35 |
165 |
72 |
17 |
M |
|
|
CP |
F |
22 |
140 |
63 |
12 |
M |
|
|
Spina Bifida |
F |
20 |
110 |
60 |
20 |
M |
|
|
CP |
53 |
M |
190 |
72 |
24 |
P |
|
|
SCI T7 -C |
M |
63 |
115 |
63 |
24 |
M |
|
|
CP |
M |
46 |
158 |
69 |
16 |
S |
|
|
SCI T6-C |
M |
46 |
158 |
69 |
16 |
M |
|
|
Doble AKA-Stroke |
M |
55 |
250 |
72 |
4 |
P |
|
|
SCI T3-C |
M |
27 |
110 |
67 |
12 |
M |
|
|
SCI C7-I |
F |
48 |
170 |
65 |
3 |
M |
|
|
SCI L1- C |
F |
55 |
115 |
66 |
30 |
M |
|
|
SCI C6- I |
F |
33 |
180 |
77 |
5 |
M |
|
|
CP |
F |
41 |
160 |
57 |
40 |
M |
|
|
SCI T12-I |
M |
58 |
N/A |
74 |
28 |
M |
|
|
SCI C5 – I |
M |
49 |
161 |
70 |
25 |
M |
|
|
RA |
F |
44 |
230 |
64 |
18 |
M |
Transfer board |
|
SCI T7-C/TBI |
M |
29 |
200 |
70 |
6 |
M |
Transfer board |
|
TBI |
M |
43 |
180 |
70 |
28 |
P |
|
|
SCI T4-C |
M |
41 |
170 |
67 |
21 |
P |
Transfer board |
|
Spina Bifida |
F |
40 |
145 |
59 |
29 |
M |
|
|
SCI T11 -I |
F |
24 |
235 |
72 |
3 |
M |
Transfer board |
|
Total |
12 F |
47±13 |
175±42 |
68±5 |
18±12 |
34M |
10 used TB |
|
|
35 M |
3 S |
Abbreviation: SCI-spinal cord injury, C-complete, I-incompelte, MS- multiple sclerosis, RSD-reflex sympathetic dystrophy, CP-cerebral palsy, AK-above knee, RA- rheumatoid arthritis, N/A data not reported.
Table 10 Alternative Text Description: This table gives the demographics of the subjects that could not attain the side guard protocol. Forty-three subjects could not attain the side guard protocol.
Grab bar protocol
One hundred and fifteen (115) subjects were tested under this protocol and four were unable to perform any transfers because this particular configuration posed significant barriers to their transfer. These four subjects were the ones that could not attain any of the other protocols.
When transferring to a lower height, with the front grab bar available, and without side guard, 51% (59/115), CI[42%,60%] used the front bar, and 20% (23/111), CI[12%,25%] could transfer to a lower height when using the bar, and the bar height preference was 30 ± 3.9” (76.2±9.9cm) median 30” (76.2cm). When transferring to a higher height, with the front grab bar, and without side guard, 59% (68/115), CI[50%,68%] used the front bar, 17% (20/115), CI[12%,25%] could transfer to a higher height when using the bar, and the bar height preference was 33.4 ± 3.1” median 32” (84.8±7.8cm, median 81.3 cm).
One-hundred and fifteen subjects performed the part of the protocol that included the side guard. 65% (75/115), CI[56%,73%] attained the transfer at level with their WMD and 10% (11/115) , CI[5%,16%] of the subjects who could not transfer with the side guard in place in the previous protocol could transfer with the grab bar in front. When transferring to a lower height, with the front grab bar available and side guard in place 56% (64/115), CI[46%,64%] used the front bar and 19% (22/115), CI[13%,28%] could transfer to a lower height when using the front grab bar. When transferring to a higher height, with the front grab bar available, and the side guard, only 72 could transfer to a higher height and 51% (59/115), CI[42%,60%] used the front bar and 17% (20/115) , CI[12%,25%] could transfer to a higher height when using the bar. Although presented with the option to change the front grab bar height, subjects chose the same height for all the low height and high height transfers as they used when the side guard was not present.
Lateral grab bar use
The lateral grab bar was used least by subjects for the Adjustable gap protocol and most for the Side guard protocol. Lateral bar usage was not consistent for all transfers within a protocol ranging from 5% - 100% across all protocols and is likely influenced in part by alterations in the setup parameter (e.g. transferring higher may require usage while transferring lower may not).
Table 11 shows the number of subjects for each protocol who used the lateral grab bar for initial placement of their leading or trailing hands and in what percentage of their transfers. It can be noted that the lateral grab bar is used by more subjects when the transfer setup increases in level of difficulty (i.e. gap/height in combination or side guard).
Table 11 . Lateral grab bar use
| Protocol |
% Subjects |
% of Transfers used |
|
Height |
19% (25/116) |
32 ± 25% (5-100%) |
|
Gap |
11% (12/114) |
61 ± 32% (16-100%) |
|
Height/Gap |
41% (48/116) |
58 ± 32% (13-100%) |
|
Side guard |
37% (42/113) |
56 ± 34% (8-100%) |
|
Grab bar |
24% (28/115) |
37 ± 20% (8-100%) |
Table 11 Alternative Text Description: This table shows the number of subjects for each protocol who used the lateral grab bar for the initial placement of their leading or trailing hands and in what percentage of their transfers. The lateral grab bar was used by more subjects when the transfer setup increases in level of difficulty (i.e. gap/height in combination or side guard).
Table 12 summarizes the average clear space required for our subjects to position their WMD to perform a transfer in each protocol in terms of width, depth, and angle of approach (Figure 2). In the side guard protocol subjects tended to locate their wheelchair close to a perpendicular position with respect to the transfer station. The transfer setups that posed more barriers for our subjects such as height/gap, side guard, and side guard with front grab bar required more space for positioning the WMD.
Table 12 . Average clear space needed and WMD orientation for transfer for each protocol (mean ± standard deviation).
| Protocol |
Width |
Depth |
Angle (degrees) |
|
Height |
38.3 ± 11.6” |
40.7 ± 10.7” |
34±38 |
|
Gap |
39.9 ± 15.7” |
39.6 ± 12.2” |
34±38 |
|
Height/Gap |
39.8 ± 13.8 |
40.5 ± 11.3” |
29±31 |
|
Side guard |
38.7 ± 15.2” |
44.9 ± 18.1” |
37±35 |
|
Grab bar |
36.1 ± 13.0” |
47.9 ± 14.1” |
40±32 |
Table 12 Alternative Text Description: This table gives the average clear space needed and WMD orientation for transfer for each protocol (mean ± standard deviation). The transfer setups that posed more barriers such as height/gap, side guard, and side guard with front grab bar required more space for positioning the WMD.
Results comparison with current accessibility guidelines
Current accessibility guidelines for amusement park rides address recommendations for amusement ride seats designed for transfer in two places. First, it recommends a transfer height between 14 to 24” (35.6 to 61.0cm) and does not specify an allowable gap distance (2). Within this range, transfer surfaces are encouraged to be between 17 and 19” (43.2-48.3cm) high (2). Table 13 summarized the percentage of the subjects that could attain these heights for each protocol. Second, it requires that a minimum of 30” (width) by 48” (76.2x121.9cm) for a transfer with the WMD positioned parallel to the ride and assume a parallel approach for the transfer (0°) (2). Table 13 shows that the majority of WMDs (90%) could manage a 19” high surface with no gap and with or without the use of a front grab bar. Accessibility guidelines concerning handholds and grab bars where transfers are expected are not very detailed and are absent in the guidelines for amusement park rides. The height of a horizontal grab bar (parallel to the floor) is to be between 33”-36” (83.8 and 91.4cm) for water stalls, water closets, bathtubs, and bathrooms. Our subjects preferred the front grab bar height to be between 30-33” (76.2 and 83.8 cm).
Table 13 . Percentage of subjects in the sample that could attain the heights recommended in the ADA.
| Protocol |
14” high |
17” high |
19” high |
24” high |
|
Height |
43%(50/116) |
69%(80/116) |
90%(104/116) |
85%(99/116) |
|
Height/Gap (3.5” gap) |
30%(35/116) |
58%(67/116) |
76%(90/116) |
72%(84/116) |
|
Side guard |
27%(31/113) |
40%(45/113) |
43%(49/113) |
47%(53/113) |
|
Grab bar without side guard |
44%(54/115) |
71%(82/115) |
91%(105/115) |
88%(101/115) |
|
Grab bar with side guard |
29%(33/115) |
48%(55/115) |
57%(66/115) |
54%(62/115) |
Table 13 Alternative Text Description: This table gives the percentage of subjects in the sample that could attain the heights recommended in the ADA. The majority of WMDs (90%) could manage a 19” high surface with no gap and with or without the use of a front grab bar.
2. Accessible amusement rides - a summary of accessibility guidelines for recreation facilities. US Access Board; 2003.
User Comments/Questions
Add Comment/Question