3.0 Study Findings
3.1 Comparison of Our Sample to U.S. Population of WhMD Users
Our sample of WhMD users was younger in age, had a much higher percentage of powered wheelchair users and a somewhat larger sample of male WhMD users than the estimated U.S. population of WhMD users (Table 3‒1). As stated in the previous section, we deliberately over-sampled powered device users in order to be able to accurately describe the anthropometric characteristics of this group. The higher frequency of male WhMD users recruited for this study is not very surprising as two of our data collection sites (Buffalo and Pittsburgh) recruited some of their study participants through VA medical centers that had extremely high percentages of male patients. As a result, our overall sample, when compared to the overall population of WhMD users is likely to have lower upper extremity and torso function, and be somewhat larger (i.e., taller, longer arms, wider, etc.). As stated in the previous chapter, these sample differences can be accounted for by stratifying the data by WhMD and/or by gender, or through the use of statistical modeling methods (Paquet et al., in preparation).
In terms of the medical conditions, Kaye et al. (2000) reported orthopedic impairments of the lower extremity (17% when combined with arthritis and other polyarthritis to conform with the classification used in the current study), cerebral vascular diseases (e.g. stroke, 11%), and central nervous system disorders (8%, including multiple sclerosis and cerebral palsy) as being the most frequently reported conditions leading to the use of a WhMD in the U.S. population. The most frequently reported medical conditions in our study were found to be central nervous system disorders (32%, including multiple sclerosis and cerebral palsy), spinal cord injuries (20%), cerebral vascular diseases (16%), followed by orthopedic impairments of the lower extremity (12%). The higher prevalence of spinal cord injuries in our study sample is expected given that two of the study locations recruited substantially through local VA medical centers.
Table 3‒1. Comparison of the percentages of WhMD users by gender, device type and age based on the estimated U.S. population of non-institutionalized WhMD users (Kaye et al., 2000) and our sample of WhMD users (n=495).

[Click image above to view HTML version]
3.2 Comparison of Sub-samples across Data Collection Sites
The primary purpose of expanding data collection to different sites was to increase the diversity of the overall sample. The Buffalo site, having recruited participants for close to 10 years had a relatively diverse sample of individuals recruited through the local Independent Living Center, a local VA medical center, and local adult care facilities. The Pittsburgh site recruited primarily through a local VA medical center. The Ithaca site recruited through local adult care facilities.
Not unexpectedly, large differences in WhMD users in terms of gender, age, years with disability and device type used were found (Table 3‒2). Pittsburgh had a much higher percentage of men WhMD users (73%) as compared to Ithaca (57%) and Buffalo (46%). It has been our experience that men are more likely to participate in the study, and the Buffalo site specifically targeted female WhMD users in our last phase of data collection to improve the representativeness of the data set in terms of gender. The median age of WhMD users was highest for the Ithaca site (74 years) followed by Buffalo (57 years) and Pittsburgh (44 years). Ithaca, and Buffalo in the later stages of data collection, recruited primarily from adult care facilities in order ensure that older WhMD users were well represented in the sample.
The disparities in the time WhMD users had their disabilities can also be explained by the differences in sampling approaches across the sites. By concentrating on veterans, the Pittsburgh site recruited WhMD users with disabilities for the largest number of median years (20 years) as compared to Buffalo (15 years) and Ithaca (10 years). This illustrates that the WhMD users recruited by Pittsburgh were more likely to experience their disability at an earlier age than the other two sites, while the WhMD users recruited by Ithaca were likely to have first experienced their disabilities at a much older age.
Table 3‒2: Gender, age and number of years with disability across sites.

[Click image above to view HTML version]
There were also large differences in the medical condition reported as being responsible for the need to use a WhMD across data collection sites (Table 3‒3). Pittsburgh by far had the largest percentage of spinal cord injured WhMD users and lowest percentage of orthopedic injuries and deformities. The greater percentage of acute injury related mobility impairments such as spinal cord injuries for the Pittsburgh site is expected given that most of its sample was recruited through a VA medical center. The Buffalo and Pittsburgh sites each had sub-samples with a diverse set of medical conditions.
Table 3‒3: Reported primary medical conditions among WhMD users across sites.

[Click image above to view HTML version]
* “Other” includes amputations, traumatic brain injuries, respiratory diseases and diabetes.
The disparities across the three sites in terms of the percentages of WhMD technologies were largest between the Ithaca and the other two sites (Table 3‒4). The Ithaca site measured a much higher percentage of manual wheelchair users than Pittsburgh and Buffalo, which is not surprising given the distribution ages and reported medical conditions for the Ithaca site.
Table 3‒4. Primary mobility device used among WhMD users across sites.

[Click image above to view HTML version]
Some of the research participants could not complete all of the functional anthropometric tests (i.e. grip strength, reach and maneuvering). The participation rates in these tests were evaluated for each of the sites. The participation rates for the reach and grip tests are summarized in Table 3‒5. Participation rates for the reach tests were lowest in Ithaca where the WhMD users tended to be much older than those of the other sites. The participation rates for the power grips were lowest in Pittsburgh, where there was the highest percentage of WhMD users with spinal cord injury.
Table 3‒5: Participation rates in the functional anthropometric tests for each site.

[Click image above to view HTML version]
3.3 Comparison of Dimensions with Standards and other Anthropometric Studies
3.3.1 Unoccupied Device Width
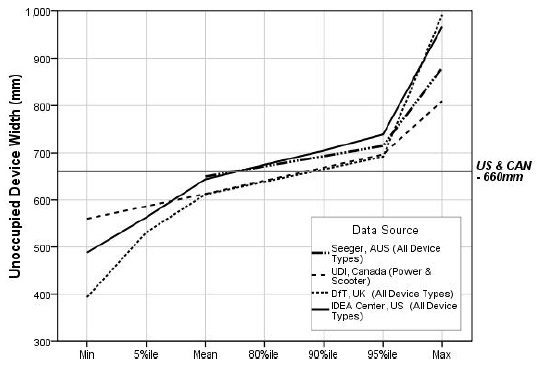
The unoccupied widths of devices were similar for the mean and 80th percentile values across research findings from different countries (Figure 3‒1). Our sample overall had, on average, larger mean and 80th percentile values for unoccupied device width than other countries. This was in part due to the larger percentage of powered wheelchair users and manual bariatric wheelchair users that were included in our study.
The unoccupied widths of devices used for the “reference wheelchair” described in the U.S. and Canadian standards are smaller than many of the WhMD users in our sample. For example, our results for mean unoccupied width are just under the U.S. standard reference wheelchair of 660 mm (26 in.). But, the widest device measured (a manual wheelchair) was over 300 mm (12 in.) wider than the U.S. standard’s reference wheelchair. The U.S. standards, generally accepted by the other countries, were derived from manufacturers’ data in the 1970’s and did not include many of WhMD technologies that are in use today.

[Click image above to view HTML version]
* Indicates data plotted in the graph.
Figure 3-1. Unoccupied WhMD width: research findings versus the standards.
3.3.2 Unoccupied Device Length
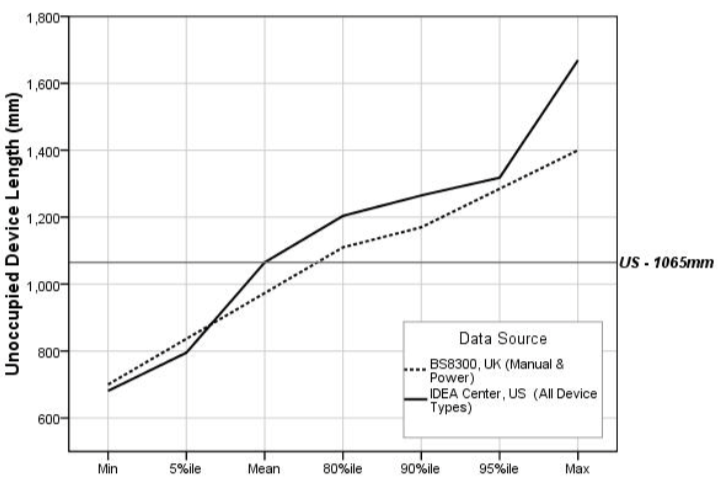
The unoccupied length of devices could be compared only between our study and the U.K. study (Stait et al., 2000). Our findings for mean, 80th percentile and 90th percentile values were somewhat larger than those of the comparison study (Figure 3‒2). This again was likely due to the larger percentage of powered wheelchairs and manual bariatric wheelchairs that were included in our study.
The unoccupied lengths of devices used for the “reference wheelchair” described in the U.S. standard equals the average value obtained from our overall sample. The mean unoccupied length for a powered wheelchair in our sample was 52 mm (2 in.) greater than the unoccupied length of the reference chair given in the standards, and the longest unoccupied length measured in our study was over 600 mm (23.6 in.) greater than the unoccupied length of the “reference wheelchair”!
There are a few reasons for the disparity in our unoccupied length data and the unoccupied length of the “reference wheelchair” currently provided in the standards. First, the available WhMD technologies of today are structurally different than those from which the standards were derived. For example, powered wheelchairs and scooters are generally longer than manual wheelchairs. Second, we measured the unoccupied length of the WhMD while it was in use; thus devices measured with elevated leg supports would be “lengthened.” Third, many of today’s mobility users attach accessories to the back of their device; we included the accessories in our length measurements.

[Click image above to view HTML version]
* Indicates data plotted in the graph.
Figure 3-2. Unoccupied WhMD length: research findings versus the U.S. standards.
3.3.3 Clear Floor Width
The findings on clear floor width are based on the findings on occupied width from anthropometric studies shown in Figure 3‒3. Neither the DfT or DETR studies collected data on occupied width but did measure the unoccupied device width. The authors argued that individuals can bring their arms and legs inboard when entering transportation vehicles and passing through doorways. We found, however, that many individuals do not have the physical ability to position their upper and lower extremities “inboard”. Moreover, in situations where an individual might remain stationery for a relatively long time, for example, at a concert or sporting event, it is unrealistic to assume that an individual would keep their upper and lower extremities in such a constraining position. The BS8300 research did not report occupied widths larger than 800 mm but the BS8300 standard, as we interpret it, requires an additional 100 mm (4 in.) more than that for the clear floor area width (900 mm). The BS8300 standard’s developers may have added 100 mm to provide additional maneuvering room at clear floor areas.
Due to recent revisions, the minimum required clear floor width standard in Australia and the U.K. now exceeds that in U.S. and Canada (Figure 3‒3). The U.K. standard accommodates the occupied widths of most everyone in all of the studies, except for a small sample of the largest widths measured in our study. Approximately 90% of manual wheelchair users, 85% of scooter users and 80% of powered chair users in our sample had occupied widths that were less than the U.S. clear floor width standard. Therefore, 10‒20% of individuals measured in our study have an occupied width that is greater than the U.S. standard of 760 mm (30 in.).
* Indicates data plotted in the graph.
Figure 3-3. Clear floor width (occupied width): research findings versus the standards.
3.3.4 Clear Floor Length
The mean value of clear floor length for our study (1250 mm or 49 in.) is above the clear floor length provided in the U.S. standards (1220 mm or 48 in.). Australian and U.K. have also recently increased the clear floor length standards (Figure 3‒4). The U.K. requirements for clear floor length exceed the U.S. by 130 mm (5 in.). The results of our study and other anthropometric studies support larger lengths to accommodate the vast majority of occupied WhMD lengths. The largest occupied lengths reported in all the anthropometric studies exceed the current standards, even the U.K. BS8300 standard of 1350 mm (53 in.). However, the results show that the 95th percentile values of occupied length are between 1250 mm. (49 in.) and 1480 mm (58 in.).
The difference between the maximum length in the UDI and Seeger studies and the others is so great that they are probably due to the presence of unusually large people and/or devices, or measurement error. The maximum length (occupied) recorded in the UDI study, for example, was over 2000 mm (6 ft.- 8 in.)! In the case of Seeger et al.’s work, we know that most of the sample was recruited from institutions and many may have had extended foot-rests or reclined backs on their chairs. No information was provided in the reports to assess whether individuals in either study could be considered outliers. For example, since the other studies together included over 1200 individuals and no other study reported a device as long as 2000 mm (78 in.), such a large value is likely a measurement error or a very rare occurrence. In fact, by coincidence, we met an individual who served as an advisor and participant in the UDI research. She recalled that there was one individual who had a “trailer” attached to her wheelchair that carried ventilator equipment which would not be required anymore due to advances in technology.
* Indicates data plotted in the graph.
Figure 3-4. Clear floor length (occupied length): research findings versus the standards.
3.3.5 Seat Height
Height dimension standards for seats prescribed in the Australian, Canadian and U.S. standards were very similar (480 mm or 18.9 in., 480 mm or 18.9 in. and 485 mm or 19 in., respectively). The values in the current standards for seat height are below the means for people we measured and those in the UDI study (Figure 3‒5). This is probably due to the increasing use of positioning systems, thick cushions and the availability of a wider range of wheel sizes since the 1970’s.
Comparisons of research findings on the seat heights for power chairs and scooters showed that mean seat heights measured in the UDI study were comparable to seat heights for the power chairs and scooters of our study; however, the differences grew larger toward the higher percentiles. Further, our study findings also revealed that occupied seat heights for manual chairs were much lower than seat heights for power chairs and scooters.
The reference points used for measurement can yield quite different results for seat height. The height of the seat can be measured at the edge and at the middle, under the cushion, on top of the cushion, etc. Thus, specifying exactly how it is measured is important for comparing results. We computed the occupied seat height by measuring a point underneath an individual’s buttocks using an extension of the electromechanical probe that we slipped in from the side between the occupant and seat interface. Our results would be different compared to other measurements not made in a similar manner.
* indicates data plotted in the graph
Figure 3-5. Seat height: research findings versus the standards.
3.3.6 Knee Clearance Height, minimum
Knee clearance heights for the four sets of standards range from 650 mm (25.6 in.) (Australia) to 700 mm (27.6 in.) (U.K.) (Figure 3‒6). The U.S. standard for knee clearance height is 685 mm (27 in.). The U.K. BS8300 results for knee clearance height suggest that current U.K. standard generally accommodates most wheelchair users in that country. In the case of the U.S. and Canadian standards, however, the level of accommodation drops to 80% in relation to measured knee heights among wheelchair users in their respective countries.
A review of photographs of participants in the IDeA sample indicated that the largest individuals are not always the ones who need the greatest knee clearances. Smaller individuals who have large thighs, those with high seats and scooter users also have high lap heights. Individuals with extended footrests and scooter users have deep knee clearances but not necessarily high knee clearances.
* Indicates data plotted in the graph.
** Does not include individuals with an above-knee right leg amputation (n=6) or with the right leg constrained in fully extended position (n=3) such as in an orthopedic cast.
Figure 3-6. Knee clearance height: research findings versus the standards.
3.3.7 Toe Clearance Height, minimum
There is relatively large disparity between the standards for toe clearance height, with the U.S. having the lowest (230 mm or 9 in.), followed by Australia (280 mm or 11 in.) and the U.K. (300 mm or 12 in.) (Figure 3‒7). Our study suggests that the standards required in each of the countries, do not accommodate the vast majority of WhMD users, especially in the U.S. The mean toe height for the overall sample of WhMD users in our study was 230 mm (9 in.).
In particular, the 80th percentile of toe clearance height for manual chairs (276 mm or 10 in.) suggests that over 20% of manual chair users exceed the minimum required toe clearance height of 230 mm (9 in.). Corresponding clearance heights for power chair users were typically greater than manual chair users, and with over half the sample exceeding the minimum toe clearance height requirement.
* indicates data plotted in the graph
** does not include individuals with a below-knee right leg amputation (n=10) or with the right leg constrained in fully extended position (n=3) such as in an orthopedic cast
Figure 3-7. Toe clearance height: research findings versus the standards.
3.3.8 Knee Clearance Depth, minimum
Knee clearance depths for the four sets of standards range from 200 mm (8 in.) in Canada to 280 mm (11 in.) in the U.S. (Figure 3‒8). None of the comparison studies used for this report provided anthropometric information about knee clearance depth. The results of our study suggest that a large percentage of WhMD users are not accommodated by the standards. The U.S. standard on knee clearance depth accommodated just over 50% of our overall sample, and was well below the 80th percentile values of maximum knee height for manual wheelchair users (369 mm or 14.5 in.) and power chair users (345 mm or 13.5 in.). Even fewer would be accommodated by the standards of the U.K., Australia and Canada. A knee clearance depth of over 400 mm (16 in.) is needed to accommodate close to 95% of our sample’s manual and powered wheelchair users.
* indicates data plotted in the graph
** does not include individuals with an above-knee right leg amputation (n=7) or with the right leg constrained in fully extended position (n=3) such as in an orthopedic cast.
Figure 3-8. Knee clearance depth: research findings versus the standards
3.3.9 Toe Clearance Depth, minimum
Toe clearance depths for the standards range from 150 mm (6 in.) in the U.S. to 230 mm (9 in.) in Canada (Figure 3‒9). None of the comparison studies used for this report provided anthropometric information about toe clearance depth. While the Canadian standard accommodates over 85% of our WhMD users, the U.S. standard accommodates fewer than 50% of our sample.
* Indicates data plotted in the graph.
** Does not include individuals with a below-knee right leg amputation (n=10) or with the right leg constrained in fully extended position (n=3) such as in an orthopedic cast.
Figure 3-9. Toe clearance depth: research findings versus the standards.
3.3.10 90-Degree Turn
While all of the standards compared in this report have requirements for “wheelchair turning spaces”, only the U.S. and Canada have requirements specifically for 90-degree or L-Turn clearances. These are similar for both countries, 915 mm (36 in.) and 920 mm (36.2 in.) for the U.S. and Canada, respectively.
The width required for all participants to complete a 90-degree turn in our sample was much smaller than the UDI findings (Figure 3‒10), due to differences in the abilities of people or/and WhMD technologies included in each of the studies or due to the different measurement procedures employed.
An increase in the 90-degree turning width criterion from 915 mm (36 in.) to 1000 mm (39 in.) would accommodate at least 95% of our sample. It also appears that there are some manual chair, power chair and scooter users who require much larger spaces than the 95th percentile values.
* indicates data plotted in the graph
Figure 3-10. 90-degree turning width: research findings versus the standards.
3.3.11 180-Degree Turn
The mean width required for all participants to complete a 180-degree turn in our sample was smaller than the UDI findings (Figure 3‒10), but our 95th percentile values for power chair and scooters users were larger than the maximum values obtained in the UDI study. The disparities are likely due to the differences in the studies described previously.
The space requirements for a 180-degree turn are similar across countries, ranging from 1500 mm (59 in.) in the U.K. and Canada to 1540 mm (60.6 in.) in Australia. The U.S. standard of 1525 mm (60 in.) accommodates just over 80% of the manual and powered wheelchair users, but less than 50% of the scooter users in our sample. An increase in the 180-degree turning width of at least 175 mm (7 in.) would be needed to accommodate 95% of manual and powered wheelchair users and 90% of the scooter users. Again, there are some manual chair users, power chair users and scooter users who require much larger spaces than the 95th percentile values, exceeding 500 mm (almost 20 in.) beyond the current U.S. standards!
* indicates data plotted in the graph
Figure 3-11. 180-degree turning width: research findings versus the standards.
3.3.12 180-Degree Turn around a Barrier
The U.S. has requirements for a 180-degree turn around a barrier that makes the width of the turn-around space dependent on the width of the passageway. If the barrier is less than 1220 mm (48 in.) wide, the standard calls for a minimum passage width of 1065 mm (42 in.) and a minimum turn-around space depth of 1220 mm (48 in.). If the passageway is narrower, the turn-around depth must be 1525 mm. (60 in.).
Our study was the only one of those compared in this report to evaluate 180-degree turning performance around the barrier. The results show that the current standards accommodate at least 90% of the powered chair users and manual wheelchair users, and almost 80% of the scooter users in our sample. However, they also demonstrate that the depth of the turn-around space could be reduced if the passageway width is at least 1095 mm. (43 in.).
* indicates data plotted in the graph
Figure 3-12. 180-degree turning width around barrier: research findings versus the standards.
3.3.13 360-Degree Turn
The standards on the space requirements for a 360-degree turn are quite similar across countries, ranging from 1500 mm (59 in.) in Canada and the U.K. to 1525 mm (60 in.) in the U.S.
Less than 50% of our manual and powered wheelchair users completed a 360-degree turn within the United States standard turning diameter (Figure 3‒12). None of our sample’s scooter users were able to complete a turn within the U.S. standard. In fact, the tightest 360 turn performed by a scooter user was 1900 mm (75 in.) in diameter! The 360-degree turning diameter would have to be increased to 2500 mm (a little over 98 in.) to accommodate our entire study sample.
In comparison, the UDI participants utilized a much larger space for the 360-degree turn in which no sides were blocked. A diameter of about 4200 mm (165 in.) would be needed to accommodate their entire sample. In our sample, scooter users overall require more space but the largest values for scooters, power chairs and manual chairs were very close. In the UDI sample, at least one power wheelchair user required a much larger clearance for the 360-degree turn (most likely the person with the “trailer” mentioned previously).
* indicates data plotted in the graph
Figure 3-13. 360-degree turning width area: research findings versus the standards.
3.3.14 Grip Strength
There were large differences in the percentage of individuals capable of completing the gripping tasks and, for those able to complete the tasks, the distribution of the grip strength for the three different grips were different between men and women, and across WhMD types (Figure 3‒14). For power grips, the percentage capable of completing three repetitions of maximal grips ranged from 77% (male power wheelchair users) to 100% (male scooter users). Overall, fewer WhMD users were able to complete the lateral pinching tasks (e.g. 73‒74% of power wheelchair users) and thumb-forefinger pinching tasks (e.g. 68‒69% of power wheelchair users).
For those individuals able to complete the pinching tasks, the results showed that both the ability to perform a grip and the magnitude of maximum grip force are substantially affected by the type of hand grip being considered. In particular, the magnitude of maximum power grip forces was noticeably greater in a power grip than in a pinch grip. Further, between the two pinch grip postures, the data show lateral pinch grips to be marginally greater than thumb-forefinger pinch grips.
Hand grip forces were typically greater for men than women, across users of the three different WhMD types. When compared across WhMD types, users of manual chairs typically produced the greatest magnitude of grip force, followed by scooter users and then lowest for power chair users. An exception to this trend was the lateral pinch grip forces among women. Not included in this analysis, are the effects of arm posture (e.g. elbow flexed at 90-degrees vs. an outstretched arm) (see D’Souza et al., in review), medical condition and age (see Joseph et al., 2010).
A comparison with the ADA-ABA permissible force limit for operating controls showed that more than 95% of the sampled WhMD users who were able to perform a power grip could exert a maximum power grip force exceeding 5 lbf.
However, the 5 lbf force limit substantially exceeds the 5%tile values of grip for the pinch postures. For the WhMD users who were able to perform a power grip in this study, approximately 25% of the WhMD users could not exert a maximum lateral pinch force that exceeded 5 lbf. About 25% of male WhMD users and 50% of female WhMD users could not exert a thumb-forefinger grip that exceeded 5 lbf.
* Percent capable indicate the percentage of the sample (grouped by gender and device type) capable of successfully forming a hand grip and exerting a force for three repetitions of the prescribed grip postures.
** 95th percentile value same as maximum value due to small sample size.
Figure 3-14. Grip force: research findings versus the standard.
* Percent capable indicate the percentage of the sample (grouped by gender and device type) capable of successfully forming a pinch grip and exerting a force for three repetitions of the prescribed grip type.
** 95th percentile value same as maximum value due to small sample size.
Figure 3-14. Grip force: research findings versus the standard. (Cont’d)
3.3.15 Reach
3.3.15.1 Forward reach – unobstructed
A large percentage of WhMD users in our study could not reach beyond the most forward point of their WhMDs or foot, and the difference between users of different types of WhMDs was very large (Figure 3‒15). For example, from among the 371 (75%) WhMD users in our study that could perform a reach task, only 78% of the manual chair users, 55% of the power chair users and 48% of the scooter users could reach beyond their mobility device or foot for at least one point between 600 mm (23.6 in.) and 1100 mm (43.3 in.) from the floor. Lower percentages in a forward reach for scooter users partially resulted from having to overcome a greater distance to reach over and/or around the front tiller, particularly at lower heights. Forward reaching capabilities for the three groups declined rapidly for heights above 1200 mm (47.2 in.) and below 600 mm (23.6 in.). Only 32% of our study’s manual wheelchair users, 22% of power chair users and 8% of the scooter users could complete forward reaches beyond the mobility device or foot at heights of 500‒600 mm (19.7‒23.6 in.). The lower limit of the U.S. standard would need to be raised from 380 mm (15 in.) to at least 600 mm (23.6 in.) in order to accommodate over 70%, 50% and 38% of our study’s manual wheelchair users, powered chair users and scooter users, respectively.
Figure 3-15. Forward reach: research findings versus the standard.
3.3.15.2 Side (lateral) reach - unobstructed
For WhMD users in our study that could perform a reach task, over 90% of each of the WhMD user groups could reach beyond the lateral most point of their WhMDs for heights between 800 mm (31.5 in.) and 1400 mm (55 in.) (Figure 3‒16) suggesting a marked improvement over a forward reach. Reach abilities began to drop at 600‒700 mm (23.5‒27.5 in.) and fell dramatically for all WhMD user groups at heights of 500‒600 mm (19.5‒23.5 in.). For heights of 500‒600 mm only 48% of manual wheelchair users, 32% of power wheelchair users and 22% of scooter users could complete a reach beyond the most lateral portion of their WhMD. In order to accommodate over 90% of the manual and powered chair users, and over 80% of the scooter users in our sample, a shift from 380‒1220 mm (15‒48 in.) to 700‒1400 mm (27.5‒55 in.) is needed. The improvement in side reaching performance with increased lower and upper limits as compared to the current standard is likely a function of larger (i.e. higher) WhMDs, and in some cases larger individuals who are now able to use WhMDs.
Figure 3-16. Side reach, unobstructed: research findings versus the standard.
3.3.15.3 Side (lateral) reach – over an obstruction depth of 610 mm
The vast majority of WhMD users in our study that displayed some reach capability could not reach at or beyond a 610 mm (24 in.) obstacle, regardless of height (Figure 3‒17). There were also differences between users of different types of WhMDs. For heights that approximated the U.S. standard of 1170 mm (46 in.), only 31% of the manual wheelchair users, 24% of the power wheelchair users and 13% of the scooter users could reach 610 mm (24 in.) beyond the most lateral point of the WhMD. The results suggest that the recommended maximum depth of 610 mm (24 in.) obstruction would need to be reduced significantly in order to accommodate a majority of our study’s WhMD users.
Figure 3-17. Side reach, beyond a 610 mm obstruction: research findings versus the standard.
3.3.16 Door Use
A total of 144 WhMD users completed door use tasks for at least one of the doors. In some cases, WhMD users were not able to complete tasks involving other doors due to scheduling issues (i.e., lack of time) and building renovations.
The differences in the sub-sample composition compared to the overall sample on demographic and anthropometric variables were generally small. Table 3‒5 summarizes the descriptive statistics for the sub-sample. The sub-sample was on average younger than the overall sample (see Table 3‒2). The differences in age are not unexpected since latter data collection efforts in Ithaca and in Buffalo involved targeting older adults who were not measured at the IDeA Center and therefore could not complete the door use tasks. Differences between the gender composition, occupied width, occupied length and maximum power grip strength were fairly modest. For example, the mean occupied width of the sub-sample was 10 mm (0.4 in.) less than the occupied width of the overall sample, and the occupied length of the sub-sample was only 6 mm (0.2 in.) less than the overall sample (See Figures 3‒3 and 3‒4).
Table 3-5. Descriptive statistics for the sub-sample that completed the door use tasks.

[Click image above to view HTML version]
The “Opening Maneuver” and “Operating Latch” door use tasks posed difficulties for very few WhMD users, requiring “minimal effort” for more than 85% of the trials (Table 3‒6 a-b). Door use tasks that were found to present WhMD users with difficulty were “Opening”, “Through Passage”, “Closing Maneuver” and “Closing”. For these tasks, a significant percentage of trials were rated at “maximal effort” or “impossible” for at least one of the three doors (Table 3‒6 c-f).
WhMD users had more difficulty “Opening” door 3, as compared to doors 1 and 2. Fifty-two percent of the pushing trials were rated at “maximal effort” or “impossible” for door 3, as compared to 12% for door 1 and 9% for door 2 (Table 3‒6 c). Forty percent of the pulling trials were rated at “maximal effort” or “impossible” for door 3, as compared to 13% for door 1and 27% for door 2. The additional effort required of door 3 for the “Opening” task was expected because door 3 had a mechanical closer that had a resistance of 7‒8 lb-f.
A higher percentage of WhMD users also had greater difficulty with “Through Passage” for door 3 than doors 1 and 2. Forty-four percent of the pushing trials were rated at “maximal effort” or “impossible” for door 3, as compared to 11% for door 1 and 6% for door 2 (Table 3‒6 d). Eighteen percent of the pulling trials were rated at “maximal effort” or “impossible” for door 3, as compared to 14% for door 1 and 11% for door 2. This was expected because of the closer and also because door 3 had a 6 mm (1/4 in.) threshold, and was the narrowest of the three doors (755 mm or 29.75 in.). The door most often rated as requiring “minimal effort” was door 2. It did not have a closer or threshold and was the widest (1040 mm or 41 in.). The presence of the closer requires the user to continue to apply pressure to the door while passing through the opening.
The “Closing Maneuver” presented problems to WhMD users for each of the 3 doors studied. “Closing Maneuver” was rated at “maximal effort” or “impossible” for 36%, 26% and 100% of the pushing trials and 57%, 42%, and 100% of the pulling trials for doors 1, 2 and 3, respectively (Table 3‒6 e). However, the very high number of “blocked view” trials for door 3 (103 for pushing and 100 for pulling) is worth noting. Trials for this door were often not observable when the participant successfully passed through the door to the space beyond because the mechanical closer closed the door while the researcher remained on the side of the door where the trial started. Most, if not all, of these trials would have required minimal effort. If the “blocked view” trials for door 3 were categorized as either “minimal” or “moderate” effort, then only small percentage of the trials (19% for pushing) and (4% for pulling) would have been rated as “maximal effort” or “impossible” for the “Closing Maneuver).
Similar results were found for the “Closing” task, although this task was the one likely to be rated as “maximal effort” or “impossible” (Table 3‒6 f). One interesting finding, however, was that “Closing” trials were more likely to be rated as “minimum effort” for door 2 than door 1, despite door 2 being 215 mm (8.5 in.) wider than door 1. The difference in rating was therefore more likely to have been influenced by the latch side clearance than door size, especially on the pull side. Door 1 only had a 76 mm (3 in.) latch side clearance.
Differences in observed ratings of effort were also found between different device types for some of the door use tasks. For example, “Closing” trials involving scooter users were more likely to be rated “minimum effort” than trials involving manual or powered chairs for doors 1 and 2 (Table 3‒7 a, b). This may be because scooter users in general have greater upper extremity function and strength and can more easily close doors than those who use manual or powered wheelchairs.
| Table 3‒6 Observed level of effort for each of the tasks (a-f). | ||||||
| a. | ||||||
| Opening Maneuver | Push | Pull | ||||
| Door 1 | Door 2 | Door 3 | Door 1 | Door 2 | Door 3 | |
| Minimum effort (1) | 92% | 94% | 92% | 88% | 94% | 92% |
| Moderate effort (2) | 3% | 2% | 1% | 5% | 4% | 2% |
| Maximal effort (3) | 5% | 3% | 6% | 7% | 2% | 5% |
| Impossible (4) | 0% | 0% | 1% | 0% | 0% | 0% |
| Subtotal sample size (rated) | 119 | 89 | 101 | 121 | 114 | 92 |
| Blocked view (5) | 25 | 39 | 26 | 21 | 14 | 12 |
| Missing data | 0 | 16 | 17 | 2 | 16 | 40 |
| Total sample size | 144 | 144 | 144 | 144 | 144 | 144 |
| b. | ||||||
| Operating Latch | Push | Pull | ||||
| Door 1 | Door 2 | Door 3 | Door 1 | Door 2 | Door 3 | |
| Minimum effort (1) | 86% | 92% | 87% | 94% | 94% | 91% |
| Moderate effort (2) | 5% | 4% | 5% | 4% | 3% | 5% |
| Maximal effort (3) | 7% | 4% | 8% | 2% | 3% | 3% |
| Impossible (4) | 3% | 0% | 1% | 0% | 0% | 1% |
| Subtotal sample size (rated) | 104 | 106 | 119 | 109 | 103 | 88 |
| Blocked view (5) | 40 | 22 | 8 | 33 | 25 | 16 |
| Missing data | 0 | 16 | 17 | 2 | 16 | 40 |
| Total sample size | 144 | 144 | 144 | 144 | 144 | 144 |
| c. | ||||||
| Opening | Push | Pull | ||||
| Door 1 | Door 2 | Door 3 | Door 1 | Door 2 | Door 3 | |
| Minimum effort (1) | 60% | 72% | 28% | 67% | 50% | 19% |
| Moderate effort (2) | 28% | 20% | 20% | 20% | 23% | 41% |
| Maximal effort (3) | 9% | 9% | 39% | 13% | 27% | 37% |
| Impossible (4) | 3% | 0% | 13% | 0% | 0% | 3% |
| Subtotal sample size (rated) | 141 | 123 | 127 | 140 | 128 | 103 |
| Blocked view (5) | 3 | 22 | 8 | 33 | 25 | 16 |
| Missing data | 0 | 16 | 17 | 2 | 16 | 40 |
| Total sample size | 144 | 144 | 144 | 144 | 144 | 144 |
| d. | ||||||
| Through Passage | Push | Pull | ||||
| Door 1 | Door 2 | Door 3 | Door 1 | Door 2 | Door 3 | |
| Minimum effort (1) | 58% | 69% | 22% | 55% | 67% | 50% |
| Moderate effort (2) | 31% | 25% | 33% | 30% | 22% | 32% |
| Maximal effort (3) | 7% | 6% | 25% | 13% | 10% | 14% |
| Impossible (4) | 4% | 0% | 19% | 1% | 1% | 4% |
| Subtotal sample size (rated) | 144 | 127 | 126 | 141 | 127 | 102 |
| Blocked view (5) | 0 | 1 | 1 | 1 | 1 | 2 |
| Missing data | 0 | 16 | 17 | 2 | 16 | 40 |
| Total sample size | 144 | 144 | 144 | 144 | 144 | 144 |
| e. | ||||||
| Closing Maneuver | Push | Pull | ||||
| Door 1 | Door 2 | Door 3 | Door 1 | Door 2 | Door 3 | |
| Minimum effort (1) | 37% | 45% | 0% | 21% | 33% | 0% |
| Moderate effort (2) | 27% | 29% | 0% | 22% | 25% | 0% |
| Maximal effort (3) | 32% | 25% | 0% | 53% | 40% | 0% |
| Impossible (4) | 4% | 1% | 100% | 4% | 2% | 100% |
| Subtotal sample size (rated) | 144 | 122 | 124 | 137 | 124 | 4 |
| Blocked view (5) | 0 | 6 | 103 | 5 | 4 | 100 |
| Missing data | 0 | 16 | 17 | 2 | 16 | 40 |
| Total sample size | 144 | 144 | 144 | 144 | 144 | 144 |
| f. | ||||||
| Closing | Push | Pull | ||||
| Door 1 | Door 2 | Door 3 | Door 1 | Door 2 | Door 3 | |
| Minimum effort (1) | 37% | 42% | 0% | 13% | 23% | 0% |
| Moderate effort (2) | 17% | 31% | 0% | 11% | 16% | 0% |
| Maximal effort (3) | 40% | 26% | 0% | 66% | 56% | 0% |
| Impossible (4) | 6% | 1% | 100% | 10% | 5% | 100% |
| Subtotal sample size (rated) | 142 | 125 | 24 | 136 | 122 | 4 |
| Blocked view (5) | 2 | 3 | 103 | 6 | 6 | 100 |
| Missing data | 0 | 16 | 17 | 2 | 16 | 40 |
| Total sample size | 144 | 144 | 144 | 144 | 144 | 144 |
| Table 3‒7 Observed level of effort for the “Closing” task by WhMD (a-b). | |||||||||
| a. Level of effort for the closing task by type of mobility device | |||||||||
| Closing - Push | Door 1 | Door 2 | Door 3 | ||||||
| Man-ual | Power | Scoot-er | Man-ual | Power | Scoot-er | Man-ual | Power | Scoot-er | |
| Min-imum effort (1) | 33% | 35% | 56% | 42% | 37% | 53% | 0% | 0% | 0% |
| Mod-erate effort (2) | 17% | 16% | 19% | 30% | 33% | 33% | 0% | 0% | 0% |
| Maximal effort (3) | 43% | 41% | 25% | 28% | 28% | 13% | 0% | 0% | 0% |
| Im-possible (4) | 7% | 8% | 0% | 0% | 2% | 0% | 100% | 100% | 100% |
| Sub-total sample size (rated) | 75 | 51 | 16 | 67 | 43 | 15 | 17 | 5 | 2 |
| Blocked view (5) | 2 | 0 | 0 | 1 | 2 | 0 | 51 | 40 | 12 |
| Missing data | 0 | 0 | 0 | 9 | 6 | 1 | 9 | 6 | 2 |
| Total sample size | 77 | 51 | 16 | 77 | 51 | 16 | 77 | 51 | 16 |
| b. | |||||||||
| Closing - Push | Door 1 | Door 2 | Door 3 | ||||||
| Man-ual | Power | Scoot-er | Man-ual | Power | Scoot-er | Man-ual | Power | Scoot-er | |
| Min-imum effort (1) | 12% | 11% | 25% | 18% | 24% | 43% | 0% | 0% | 0% |
| Mod-erate effort (2) | 11% | 9% | 19% | 20% | 12% | 14% | 0% | 0% | 0% |
| Max-imal effort (3) | 67% | 72% | 44% | 61% | 55% | 36% | 0% | 0% | 0% |
| Im-possible (4) | 10% | 9% | 13% | 2% | 10% | 7% | 100% | 100% | 0% |
| Sub-total sample size (rated) | 73 | 47 | 16 | 66 | 42 | 14 | 2 | 2 | 0 |
| Blocked view (5) | 3 | 3 | 0 | 2 | 3 | 1 | 51 | 39 | 10 |
| Missing data | 1 | 1 | 0 | 9 | 6 | 1 | 24 | 10 | 6 |
| Total sample size | 77 | 51 | 16 | 77 | 51 | 16 | 77 | 51 | 16 |
User Comments/Questions
Add Comment/Question