2.0 Methodology
2.1 Participant Recruitment and Sampling
A sample of 495 WhMD users was recruited for the study. These included sub-samples of manual wheelchair users, conventional powered wheelchair users and scooter users. We intentionally oversampled powered wheelchair users in order to capture the sizes and space requirements of this group.
It would be useful to know how our sample compares to national estimates of the WhMD population. The most recent published estimates on the type of device are provided by LaPlante and Kaye (2010), and Cooper and Cooper (2003). LaPlante and Kaye (2010) used data from the 1994‒95 National Health Interview Survey on Disability (NHIS-D). More recent data available on the utilization of WhMD’s (e.g. the 2010 U.S. Census Bureau’s Survey of Income and Program Participation) do not distinguish between the types of electric WhMDs. Based on estimates by LaPlante and Kaye (2010), powered wheelchair users and scooter users each comprise about 9% of the WhMD user population not residing in institutions. A representative sample of 495 WhMD users would therefore include only 45 powered wheelchair and 45 scooter users.
In a review on wheeled mobility demographics, Flagg (2009) cites estimates by Cooper and Cooper (2003) on the proportion of mobility devices in the three categories. They estimated powered wheelchairs and scooters each to be about 15% of the WhMDs in use. The estimates by Cooper and Cooper (2003) were based on their own research and experience in the field, and include wheelchairs used in institutional settings like long term care facilities, rehabilitation hospitals and assisted living facilities. In our research, we recruited from assisted living facilities and day care programs for frail older adults but only people who could propel a chair independently were eligible to participate.
Based on this larger estimate, a sample of 495 WhMD users representative of the U.S. in terms types of WhMD used would include only about 74 power wheelchair and 74 scooter users. Even this larger estimate would not allow an accurate characterization of the sizes and functional abilities of these user groups in our study, which we expected to be quite diverse and different than manual wheelchair users.
Our approach allowed us to accurately describe the range of body sizes and functional abilities of conventional powered wheelchair users and manual wheelchair users. A sub-sample of scooter users was recruited to provide us with preliminary anthropometric data for this group but we were not able, despite great efforts, to recruit a large number of scooter users. It should be noted that it is possible to manipulate our current sample with the use of statistical simulation methods to develop samples that representative in terms of device type, age, and gender (Paquet et al., in preparation).
Data were collected in three different locations to help ensure a diverse sample of WhMD users: Buffalo and its suburbs (n=351), Pittsburgh (n=100) and Ithaca (n=44). Researchers at each of these sites were trained in the data collection methods and used the same measurement equipment to ensure consistency in measurement methods across sites.
2.2 Key Measurement Variables and Procedures
We selected measurement variables and procedures for measurements based on advice provided by experts in anthropometry and ergonomics, human modelers, architects and designers, and clinicians.
The measurement variables include the following:
1. Demographic information and wheelchair description: Approximately 30 variables recorded with a checklist, along with digital still photographs of the user and mobility device.
2. Body and wheelchair dimensions: Approximately 125 locations of body and wheelchair points recorded in three dimensions.
3. Reaches and lifts: One-handed maximum reaches recorded at 5 different heights in three different directions for up to four different weight conditions (maximum of 60 reaches total).
4. Maneuverability: Four tasks related to propulsion in confined spaces.
5. Grip Strength: Three repetitions of maximal power grasp recorded for two different upper extremity postures and three repetitions of maximal pinch grip for two types of finger posture (lateral and thumb-forefinger pinches) (12 measurements total).
6. Door use: The level of observed effort was rated as participants used three different doors.
2.2.1 Demographic Information
A survey, checklist and photography were used to capture the demographic and wheelchair characteristics for each WhMD user. Demographic variables included: gender, age, disability status (category), years with the disability, and years using the mobility aid. Key variables associated with the mobility aid included device type (e.g., power chair, scooter), and within each type: make, model, age, armrests, footrests, drive wheels, controller, seat support surfaces and overall condition of the seating surface. A checklist was used to evaluate these device attributes (see Figure 2‒1). Digital photographs of the user and device were taken from the front and side views to document the wheelchair accessories and configurations of WhMD user.
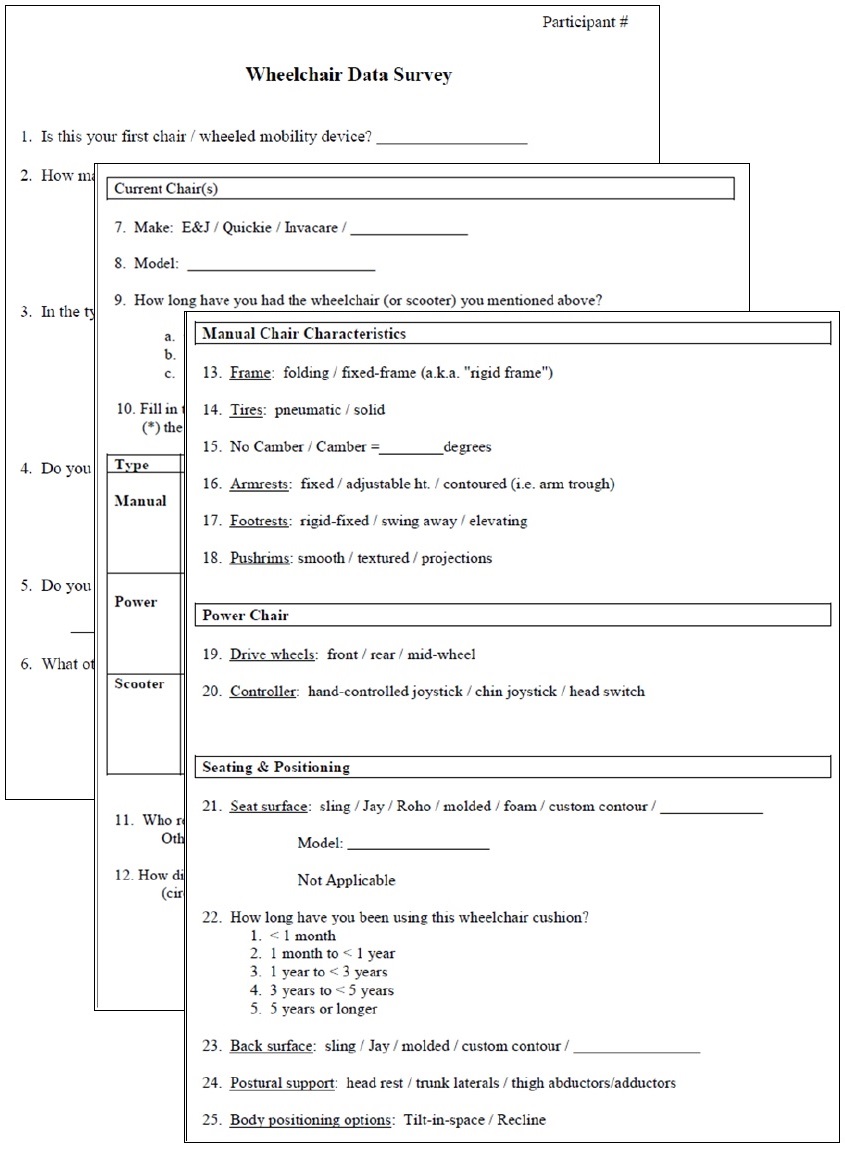
Figure 2-1. Portions of the checklist used to evaluate wheelchair characteristics
2.2.2 Structural Anthropometry (i.e. Body and WhMD Dimensions)
A three-dimensional (3-D) electromechanical probe (i.e. FaroArm, Faro Technologies Inc.) was used to record the 3-D location of body and WhMD device points (Figure 2‒2). The 3-D points were used to estimate body and WhMD heights, widths and depths and to construct static 3-D digital human models of WhMD users.
Figure 2‒2. Data collection with an electromechanical probe allows quick and accurate measurement of the widths, heights and depths of the body and mobility device characteristics.
The 3-D measurements required the measurement of reference points and planes, as well as the measurement of key body and WhMD points with respect to the environment. The IDeA Center has developed a detailed manual that defines each of the points in 3-dimensions, includes illustrations and explains applications for each of the points (Feathers et al., 2004). The reference points and planes, body points and WhMD points, and some of their application are listed in Tables 2‒1 and 2‒2.
Table 2‒1. Wheelchair and environment reference points and planes, and uses.

[Click image above to view HTML version]
Table 2‒2. Body points and important anthropometric dimensions associated with each point.

[Click image above to view HTML version]
2.2.3 Functional Reach
One-handed reach and lift capability data made at different heights, angles and object weights were collected in 3-D. Determining an individual’s 3-D reach envelope required that the reach envelope be measured relative to certain environmental, wheelchair and personal features (e.g. 3-D envelopes measured relative to a point on the floor, forward most portion of a person or wheelchair and/or from a reference point on wheelchair’s arm support surfaces). Data can be presented in 3-D, in the form of 2-D charts along key planes (e.g. sagittal plane to represent forward reach abilities), or described for a standard reach (e.g. maximum forward reach from a reference point).
The one-handed lifting tasks required individuals to move weighted cylinders that were empty or weighted with filler. Cylinders of 75 mm (3 in.) diameter were chosen because they required participants to use one-handed power or lateral pinch grasps, which are commonly used to hold and manipulate products. The size of the cylinders was held constant across conditions and participants. The four weight conditions were no weight, 1 lb, 3 lb and 5 lb.
Those individuals unable to grasp and/or lift any of the cylinders above shoulder height did not complete the reaches. Further, if a particular weighted canister could not be lifted above shoulder height then reaches involving that particular weight were avoided for reasons of participant safety.
Reaches and lifts were completed in 15 different directions (3 different angles of asymmetry from the orientation of the WhMD at 5 different heights). The angles of asymmetry included 0, 45 and 90-degrees from the sagittal plane that passes through the acromion process on the individual’s dominant side (i.e. forward, asymmetric and side reaches, respectively). The five heights were normalized to the individual's vertical reach capabilities so that reaches were performed at, above and below shoulder height.
Three-dimensional reach data were collected with the electromechanical probe (FaroArm, Faro Technologies). Use of the electromechanical probe required manually digitizing the 3-D location of the maximum reach point after the cylinder was positioned (Figure 2‒3). The point data were used to measure reach distances from reference points (e.g. maximum forward reach from the front of the WhMD, or maximum side reach from the lateral-most point of the WhMD), and construct reach envelopes that illustrate the reaching capabilities of the sample in 2-D and 3-D space.
A computation procedure was developed for performing analyses on reaches that involved combining 3-D reach information from the measured WhMD users in relation to a common reference plane. For instance, a vertical plane at the anterior-most point was used a reference to analyze forward reaches. This is similar to a wheelchair occupant facing a wall such that the forward-most aspect of their foot and/or wheelchair was touching the wall. Likewise, a vertical plane at the lateral-most point was used as a reference for analyzing lateral reaches, similar to a situation where a wheelchair occupant were right alongside a wall.
The percentage of WhMD users able to reach to or beyond a particular reference plane (either forward or lateral) was then computed. The data were analyzed in 100 mm (4 in.) increments from the floor. The reference planes could also be moved away or towards the occupant to simulate different obstruction depths to estimate the relative increase or decrease in reach capability. It should be emphasized that our data depict, in percentages, the reaching capabilities of only those individuals who could grasp and lift a particular cylinder above shoulder height.
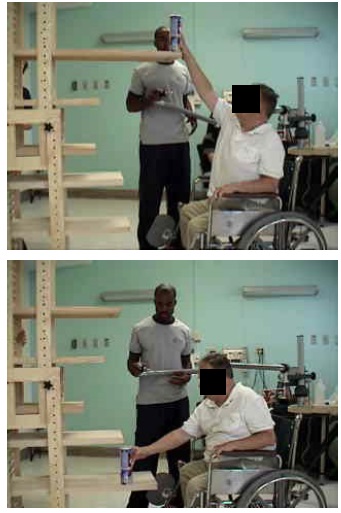
Figure 2‒3. Participants moved cylinders in 3 different directions at 5 different heights. Shown are forward reaches for two different heights. The electromechanical probe is used to record the 3-D location of the maximum reach distances from body and wheelchair reference points.
2.2.4 Maneuverability
WhMD users were video recorded while completing the following tasks:
• 90-degree turn,
• 180-degree turn with no restrictions on length of the maneuver,
• 180-degree with a center barrier,
• 360-degree rotation within a space with four walls.
The tasks were performed in restricted space conditions with the maneuvering performed within the confines of temporary barriers that are made of cardboard. Widths of the restricted space were set at a minimum of 750 mm (30 in.) for the 90-degree turn, 750 mm (30 in.) passage width for the U-turn with a barrier, and 1300 mm (51 in.) for the 180-degree and 360-degree turning activities.
WhMD users were asked to complete the tasks without touching the walls. The separation between walls was increased at increments of 50 mm (2 in.) if passage through the mock environment was not cleared without touching the walls (Figure 2‒4).
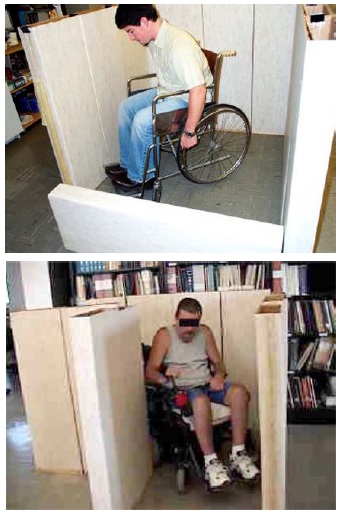
Figure 2‒4. Two examples of WhMD users completing restricted space experimental conditions.
2.2.5 Grip Strength
Four types of grip strength measurements for the dominant hand were assessed. These included a power grip with the elbow in full extension (i.e. shoulders flexed 90-degrees and upper extremity fully extended), power grip with the elbow flexed 90-degrees, lateral pinch (i.e. with the pinch gauge between the thumb pulp and the radial aspect of the forefinger), and thumb-forefinger pinch (i.e. with the pinch gauge between the tips of the thumb and forefinger). These measurements are important to the design of and/or standards development for some types of hand tools, hardware and electrical controls (e.g. scissors, some types of door latches, knob controls). Grip strength was recorded with manual hand and pinch dynamometers (Jamar, Inc). WhMD users were required to perform three maximal efforts in each of the four types of grips with their dominant hand, with the mean value considered as the maximal force value for analysis. Force measurements were not obtained for those WhMD users that were unable to perform a grip or exert a grip force, or declined from grip measurements (e.g. due to pain or discomfort in the hand). If the person could not complete all three force repetitions, force data for that particular grip was not included in the analysis.
Prior analysis of a subset of this data (D’Souza et al., in review) showed maximal power grip forces to be greater on average by approximately 1% to 5% with the arm in full extension as compared to with the elbow flexed 90-degrees on average across gender and mobility device type. In light of this marginal difference, only the power grip data measured with the elbow flexed 90-degrees along with data on pinch grips are included in this report. Additional analyses of this data to study potential differences in grip strength capabilities by age and medical condition that may clinical relevance have also been reported (e.g. Joseph et al., 2010).
2.2.6 Door Use
Our study of door use had three main objectives all intended to provide groundwork for future studies aimed at design guidelines and standards that would make doors more accessible to WhMD users:
1. Identify door use tasks that present WhMD users with the most difficulty,
2. Evaluate how different aspects of door design effect door use difficulty, and
3. Identify which WhMD user groups experience the greatest difficulties with doors.
The door use tasks required the use of three different doors in the building housing the IDeA Center. Trials in both directions were performed (i.e. from push and pull sides) using a forward approach. Each door presented different types of challenges to WhMD users. The door characteristics are summarized in Table 2‒3.

[Click image above to view HTML version]
For each trial, use of the door was divided into six task components: Opening Maneuver, Operating Latch, Opening, Through Passage, Closing Maneuver and Closing (See Figure 2‒5). For each phase, the level of difficulty experienced during each task was assessed using a 4 point scale and definitions previously developed and tested by Danford and Steinfeld (1999):
1. Minimal effort: The task was performed successfully on the first attempt, without an expression of frustration, smoothly without interruption, and in no more time than it would take for a member of the general population.
2. Moderate effort: The task was performed successfully on the first attempt, with no more than a brief expression of frustration and infrequent pauses or slight difficulties that increase the task time slightly as compared to a member of the general population.
3. Maximal effort: The task was performed successfully after multiple attempts, often with some expression of frustration and frequent pauses or difficulties that dramatically increases task time as compared to a member of the general population.
4. Impossible: The task was not performed successfully or there was a refusal to complete the task.
5. Blocked View: The effort could not be assessed due to visual obstruction between observer and WhMD user (e.g., door in the way for closing maneuvers, the WhMD user’s body orientation with the observer prevents an assessment).
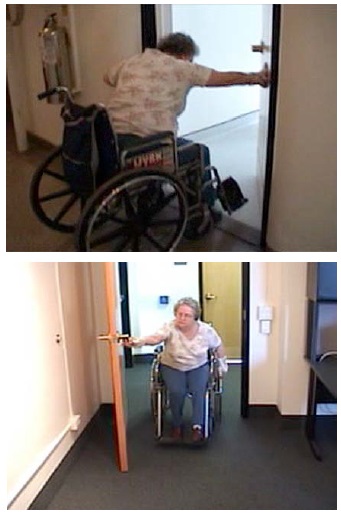
Figure 2‒5. Two examples showing physical requirements of door use for two of the doors used by WhMD users.
2.3 Analysis
2.3.1 Comparison of Demographic Characteristics of Our Sample and U.S. Population of WhMD Users
The size and functional abilities of WhMD users was hypothesized to differ significantly across gender, device type and age of the individual. A comparative analysis between our sample and the population of U.S. WhMD users provided information about the generalizability of our pooled results with the U.S. population of WhMD users. Demographic information about the U.S. population of WhMD users was obtained through summary reports of the 1994‒95 National Health Interview Survey on Disability (Flagg, 2009; Kaye et al., 2000).
The relative percentages of WhMD users stratified by gender, device type and age categories were compared between our sample and the U.S. population of WhMD users. Cases in which our sample was not considered representative on these variables suggest a “stratified analysis” (i.e. presentation of results for sub-samples, rather than the pooled data set) or other statistical modeling methods (e.g. Paquet et al., in preparation) would provide opportunities for a more valid application of our results to U.S. standards. Population-based data about percentage of WhMDs users with different types of disability were not available for the analyses.
2.3.2 Comparison of Demographic Characteristics of Subsamples by Data Collection Location
Because each of the data collection sites had access to different sub-populations of WhMD users and slightly different methods of participant recruitment, we believed it would be important to understand the differences in the demographic characteristics of the sub-samples of each site.
Therefore the relative percentages of WhMD users stratified by gender, device type and age categories were compared across the study’s three data collection sites.
2.3.3 Comparison of Dimensions with Standards and other Anthropometric Studies
The results of our study were compared to the Americans with Disabilities Act Accessibility Guidelines (ADAAG) and the Americans with Disabilities Act – Architectural Barriers Act Accessibility (ADA-ABA) Guidelines for Buildings and Facilities, standards of several countries and findings from several other large non-U.S. anthropometric studies of WhMD users. To identify the dimensions to compare, we first identified the relevant item in the U.S. standards to identify the common underlying anthropometric variables. Our analysis then focused only on those variables. The list below identifies the items in the standards and the anthropometric variables which were used for comparison:
• Unoccupied Device Width: Compared to the horizontal distance between the most extreme lateral points of the WhMD.
• Unoccupied Device Length: Compared to the horizontal distance between the most extreme posterior and anterior points of the WhMD.
• Clear Floor Space Width: Compared to Occupied Width.
• Clear Floor Space Length: Compared to Occupied Length.
• Seat Height, maximum: Compared to the vertical distance measured from the floor to the height of the seat support surface when occupied.
• Knee Clearance Height, minimum: Compared to the vertical distance measured from the floor to the superior aspect of the right knee.
• Toe Clearance Height, minimum: Compared to the vertical distance measured from the floor to the highest point on the right foot (i.e. higher of either the dorsal or distal foot point). This measure was only considered for manual and power wheelchair users.
• Knee Clearance Depth, minimum: Compared to the horizontal distance measured from the distal aspect of the right knee to the anterior-most point on the occupant and/or wheelchair. This measure was only considered for manual and power wheelchair users.
• Toe Clearance Depth, maximum: Compared to the horizontal distance measured from the dorsal aspect of the foot (i.e. crease of the foot and lower leg) to the anterior-most point on the occupant and/or wheelchair. This measure was only considered for manual and power wheelchair users.
• Wheelchair Turning Space to make a 90-Degree Turn: Compared to the maneuvering clearances required for performing a 90-degree (L-shaped) turn.
• Circular and T-shaped Wheelchair Turning Space: Compared to the maneuvering clearances required to make a 180-degree turn in a space confined on three sides.
• Wheelchair Turning Space to make a 180-Degree Turn around an Obstacle: Compared to the maneuvering clearances required to make a 180-degree turn around a center barrier.
• Circular and T-shaped Wheelchair Turning Space: Compared to the maneuvering clearances required to make a 360-degree turn in a space confined on all four sides.
• Forward Reach Height Lower and Upper Limits: Compared to the measured heights that WhMD user could reach beyond the anterior (forward) most point of the WhMD user or device.
• Side Reach Height Lower and Upper Limits: Compared to the measured heights that WhMD user could reach beyond the most lateral point of the WhMD user or device.
• Side Reach Height Lower and Upper Limits over an obstruction of 610 mm: Compared to the measured heights that WhMD user could reach 610 mm beyond the most lateral point of the WhMD user or device.
• Maximum Forces for Hand-operated Controls: Compared to the maximum hand grip strength in a power grip, and lateral and thumb-forefinger pinch grips.
In order to accomplish the comparative analysis with the standards and other studies, we reviewed ICC/ANSI A117.1 (2003) Accessible and Usable Buildings and Facilities, which serves as the model for the technical requirements in the federal guidelines in the U.S., the Americans with Disabilities Act Accessibility Guidelines (ADAAG) and its eventual replacement, the Americans with Disabilities Act – Architectural Barriers Act Guidelines (ADA-ABA). For the United Kingdom (U.K.), we reviewed BS 8300:2001 Design of Buildings and Their Approaches to Meet the Needs of Disabled People – Code of Practice. For Canada (CA), we reviewed B651‒04 Accessible Design for the Built Environment. For Australia (AUS), we reviewed AS 1428.2 – 1992 Design for Access and Mobility Part 2: Enhanced and Additional Requirements – Buildings and Facilities. Table 2.4 summarizes Accessibility Standards that were used for the comparisons.
Table 2.4 Comparison of Accessibility Standards across Four Countries.

[Click image above to view HTML version]
* This standard also includes an appendix with information on device size and maneuvering spaces for power chairs and scooters derived from the UDI research.
Since the findings of anthropometric research are often voluminous, journal articles and book chapters do not usually include a full documentation. Thus, we obtained the original research reports from Ringaert et al. (2001) from Canada, Stait et al. (2000) from the United Kingdom, Bails (1983) and Seeger et al. (1994) from Australia. The research underlying BS8300:2001 in the U.K. was summarized in an Annex to the standard itself but we were unable to obtain a more comprehensive report that described the details of the methodology. Each of the studies is briefly described below. See Steinfeld et al. (2010c) for a more complete summary of each.
In his study, Bails (1983) recruited participants from attendees at disability support centers and institutions. Eligible participants were between 18 and 60 years of age and used a manual or powered wheelchair. Scooter users were not included in the study. The research focused primarily on testing of full-size simulations of elements found in the built environment, such as doorways, environmental controls, furniture and fixtures that were configured to meet the Australian standards at the time.
Seeger et al. (1994) studied only device size. About 73% of the 240 individuals in the sample lived in nursing homes and other institutions. Forty-five percent were over 65 years old. Eleven percent used power chairs and 2% used scooters. Both unoccupied and occupied dimensions of device width and length were measured as well as a set of other basic dimensions. Measurements were taken manually using conventional measuring tools including a tape measure, steel square and spirit level.
The Department of Environment Transport and the Regions (DETR) (Stait et al., 2000) and the Department for Transport (DfT) (Hitchcock et al., 2006) studies were the two most recent in a series of three large-scale wheelchair anthropometry surveys conducted in the U.K. The studies were limited to the measurement of device size and weight. The DETR survey conducted in 1999, recruited participants solely at an exposition of equipment for people who use wheeled mobility devices for traveling around the community. The subsequent DfT survey was widened to include 12 schools and retail centers in the U.K., in addition to the 2005 Mobility Roadshow. Of the 745 participants in the DETR study whose data was acceptable, 59% used self-propelled manual chairs, 9% used attendant powered chairs, 25% used power chairs and 9% used scooters. Nine percent of the sample were judged to be 16 years of age or younger. The DfT study sample comprised of 1098 adults and 247 children. Among adults, 41% used self-propelled manual chairs, 10% used attendant-propelled wheelchairs, 27% used power chairs, and 22% used scooters. The DETR study used two photographs of each participant, while the DfT study employed seven photographs taken with a camera from pre-determined angles after participants wheeled into position on a scale. A checkerboard pattern on the floor and wall provided references to take measurements off the photographs. Although a wide variety of accessories were observed on the devices, they were not measured as part of the width calculation.
The research used as a basis for revisions to the U.K. BS8300:2001 standards covered clear floor area space requirements, knee clearances and maneuvering clearances. A total of 164 individuals were included in the sample but only 90 participated in the research on space allowances. Due to the lack of a full research report, it is not clear how the measurements were collected and, in many cases, the landmarks used to define them. From the information available, it appears that some scooters and attendant propelled chairs were included in the sample but it is not clear whether these individuals were included in the device or body measurements.
The Universal Design Institute (UDI) study (Ringaert et al., 2001) included a sample of individuals recruited from disability and senior organizations in Winnipeg by written invitation. Of the 50 participants, 35 (70%) used power chairs and 15 (30%) used scooters. The cause of disability for individuals in the sample included a wide range of conditions. Device size and maneuvering spaces were measured. All dimensions were taken to the extremes of the equipment including any object attached to the device like a ventilator. However, the actual landmarks on the devices were not well documented. Measurements were made with rulers and tape measures but no information is given on the accuracy and reliability of these techniques. Maneuvering trials were recorded using overhead video cameras while participants completed standardized movements in simulated environments built with plywood floors and wood framed dividers. Measurements were later taken off the videotapes although the method used to extract the measurements and the reliability of the technique was not described. An observer rating was used to determine successful trials.
The common variables were defined graphically in illustrations and with abbreviations, e.g. Knee Clearance Height (KCH), Knee Clearance Depth – Upper (KCD), and Extended Depth (ED). In many cases, variables underlying the U.S. standards are not included in other standards. Thus, in our comparisons, we omitted values for those variables. We did not, however, report variables from other standards that are not included in the U.S. standards.
The standards did not always use the same variables (or parameters), terminology or measurement conventions. For example, the U.S. standards include both Imperial and “soft” conversions to Metric units, but all the other standards are in Metric units only; there are at least three different terms used for a “wheelchair turning space”, and the U.K. standards report reach ranges for both a “maximum” and “minimum” reach while the U.S. standards have only one range delimited by a minimum and a maximum value.
These differences present several problems to researchers. For example, the definition of a “wheelchair turning space” determines the protocol used to study the clearance needed. Different results are obtained if that space is bounded or unbounded or whether the protocol calls for a smooth continuous turn or includes a series of smaller movements or allows either. Since the standards do not define variables clearly, researchers have made their own interpretations and developed different protocols to study the same variables. Thus, to make comparisons, we standardized all the values from standards and research as much as possible based on a common definition of variables and measurement conventions. We reported the U.S. values in both Imperial and Metric units but did not convert the other countries’ values to Imperial nor did we do “hard” conversions of the Imperial values found in the U.S. standards.
We then reviewed the research completed in each study. In many cases, this required some interpretation because the research studies did not always use the same terms or definitions as the standards in the respective country. Different approaches were also used to report findings. Some results were reported in percentiles. Other results were reported as minimum or maximum values. Still others were reported as the “percentage of subjects accommodated” – those who could perform a task at a certain criterion level.
We devised a graphic method to compare the results of the research studies to each other including our own and to the standards. Most of the studies reported at least a minimum or maximum value and a mean value for each variable studied. These three points were displayed on a graph and coded by study. Where available, percentile data were added to the graph in between the minimum and maximum values and the mean to provide more detail. All the values for each study that represented a distribution were connected by line segments.
For clarity, we pooled data for all mobility devices. However, this can confound comparisons across studies due to differences in the proportion of manual wheelchairs, power chairs, and scooters. Therefore, we also provided tabular data stratified by mobility device type.
2.3.4 Analysis of Door Use Difficulty
The measurement of door use performance was designed as a quasi-experimental study that involved systematically observing and coding WhMD user performance during door use tasks. It therefore required different analysis and comparison approaches.
First, an analysis of the demographic variables for the subset of WhMD users who completed the door use tasks was completed to describe the percentages of men and women, and types of WhMDs used in this sub-group. The mean, median and range of WhMD user age, occupied width, occupied length and maximum power grip were also reported as we thought that these variables might help explain the door use performance among the sub-group.
The level of difficulty experienced for each of the phases of door use was then compared across the three different doors and WhMD types for each of the tasks. Specifically, the percentage of each of the rating scores (minimum effort, moderate effort, maximum effort and impossible) was calculated for each of the three doors and six door use tasks. Those doors and door use tasks having a relatively large percentage of scores exceeding minimum effort were identified as potentially problematic, and a follow-up analysis of these conditions was performed to determine which WhMD user groups had the greatest difficulty with these tasks.
User Comments/Questions
Add Comment/Question