Energy Requirements for Different Surfaces
The energy consumption results are shown in the following table and figures.
Table 4. Average Energy Consumption (mlO2/kg/m) for Each Surface by Subject Group
| Energy Consumption above Resting Values | |||||||||||
| Rest | ADAG | RDOL | ASPP | RDMX | PAFN | DIRP | CPBR | EWFK | EWFJ | SAND | |
| NoDis | 2.42 | 0.10 | 0.09 | 0.10 | 0.09 | 0.09 | 0.11 | 0.10 | 0.10 | 0.11 | 0.16 |
| AwLM | 2.50 | 0.14 | 0.15 | 0.12 | 0.14 | 0.15 | 0.16 | 0.16 | 0.14 | 0.18 | 0.12 |
| AwAD | 2.95 | 0.12 | 0.15 | 0.18 | 0.16 | 0.18 | 0.18 | 0.21 | 0.21 | 0.22 | 0.26 |
| Wc | 3.05 | 0.14 | 0.10 | 0.12 | 0.12 | 0.10 | 0.20 | 0.28 | 0.31 | 0.37 | 1.31 |
| Rest = Resting energy consumption (mlO2/kg/min) | AwLM Ambulatory with limited mobility |
| NoDis No known disability | Wc Manual wheelchair use |
| AwAD Ambulatory with assistive devices |
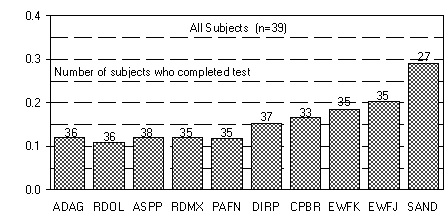
Figure 8. Average Energy Consumption for All Subjects Combined
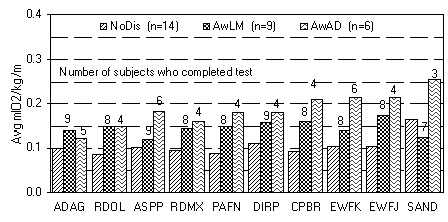
Figure 9. Average Energy Consumption for Subjects with No Disability (NoDis), Ambulatory with Limited Mobility (AwLM), and Ambulatory with Assistive Devices (AwAD)
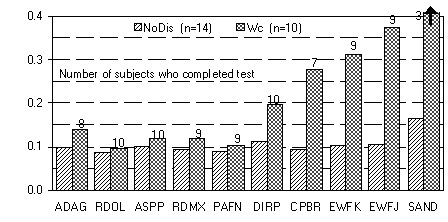
Figure 10. Average Energy Consumption for Subjects with No Disability (NoDis)and Manual Wheelchair Users (Wc)
User Comments/Questions
Add Comment/Question