RESULTS OF HUMAN SUBJECT TESTING
Characteristics of Study Participants
Thirty-nine (39) subjects (23 female, 16 male) participated. Subjects were classified into one of four groups:
1) No disability – no known disability or mobility limitation; 2) Ambulatory with limited mobility – persons whose mobility was impaired, but who did not use any type of assistive device for ambulation; 3) Ambulatory with assistive device – persons with a mobility limitation who used an assistive device, such as crutches, a cane, a walker, a surgical implant or prosthetic limb; or 4) Wheelchair user – manual wheelchair users (Table 3). The subjects within each disability category had a wide range of fitness and ability levels.
A statistically significant correlation between total energy required for the ADAAG course and the energy required for each surface (except sand) indicates that for a given subject the level of community mobility is related to the “accessibility” of outdoor surfaces.
On the surfaces objectively measured as firm and stable, subjects with higher fitness levels had lower heart rate and RPE scores (i.e., walking was less difficult). On dirt, wood chips, and engineered wood fibers J and K, fitness level was correlated with all measures of surface “accessibility.” Higher fitness levels resulted in lower energy consumption, higher velocity, lower heart rate, and lower RPE.
Table 3. Demographic Characteristics of Study Participants (Mean ± 1 SD, (min - max)
| Dis | G | N | Age (yrs) | Yrs with Disability |
| All | F | 23 | 35.9 ± 9.0 (22 - 49) | 15 ± 12 (3 - 47) |
| M | 16 | 34.3 ± 7.7 (24 - 46) | 11 ± 9 (3 - 29) | |
| NoDis | F | 7 | 32.7 ± 9.1 (22 - 45) | NA |
| M | 7 | 33.2 ± 7.7 (24 - 44) | NA | |
| AwLM | F | 8 | 37.4 ± 10.6 (22 - 47) | 17 ± 15 (3 - 47) |
| M | 1 | 44.5 (44.5) | 3 (3) | |
| AwAD | F | 4 | 36.5 ± 8.0 (25 - 41) | 12 ± 9 (3 - 24) |
| M | 2 | 30.7 ± 8.3 (25 - 37) | 14 ± 9 (7, 20) | |
| Wc | F | 4 | 37.5 ± 8.4 (29 - 49) | 13 ± 13 (5 - 32) |
| M | 6 | 35.0 ± 8.1 (26 - 46) | 11 ± 9 (3 - 29) |
| Dis = Disability | NoDis = No known disability |
| G = Gender | AwLM = Ambulatory with limited mobility |
| N = Number of subjects | AwAD = Ambulatory with assistive devices |
| NA = Not applicable | Wc = Manual wheelchair user |
| All = All subjects combined |
Energy Requirements for Different Surfaces
The energy consumption results are shown in the following table and figures.
Table 4. Average Energy Consumption (mlO2/kg/m) for Each Surface by Subject Group
| Energy Consumption above Resting Values | |||||||||||
| Rest | ADAG | RDOL | ASPP | RDMX | PAFN | DIRP | CPBR | EWFK | EWFJ | SAND | |
| NoDis | 2.42 | 0.10 | 0.09 | 0.10 | 0.09 | 0.09 | 0.11 | 0.10 | 0.10 | 0.11 | 0.16 |
| AwLM | 2.50 | 0.14 | 0.15 | 0.12 | 0.14 | 0.15 | 0.16 | 0.16 | 0.14 | 0.18 | 0.12 |
| AwAD | 2.95 | 0.12 | 0.15 | 0.18 | 0.16 | 0.18 | 0.18 | 0.21 | 0.21 | 0.22 | 0.26 |
| Wc | 3.05 | 0.14 | 0.10 | 0.12 | 0.12 | 0.10 | 0.20 | 0.28 | 0.31 | 0.37 | 1.31 |
| Rest = Resting energy consumption (mlO2/kg/min) | AwLM Ambulatory with limited mobility |
| NoDis No known disability | Wc Manual wheelchair use |
| AwAD Ambulatory with assistive devices |
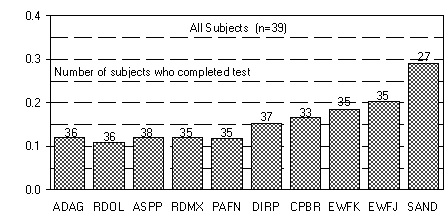
Figure 8. Average Energy Consumption for All Subjects Combined
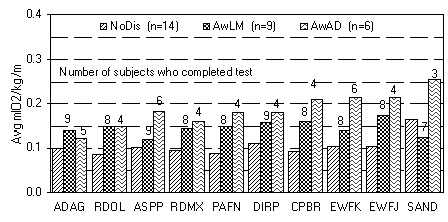
Figure 9. Average Energy Consumption for Subjects with No Disability (NoDis), Ambulatory with Limited Mobility (AwLM), and Ambulatory with Assistive Devices (AwAD)
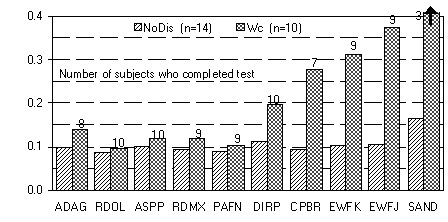
Figure 10. Average Energy Consumption for Subjects with No Disability (NoDis)and Manual Wheelchair Users (Wc)
User Comments/Questions
Add Comment/Question