Accessible Exterior Surfaces
This is an executive summary of the “Accessible Exterior Surfaces Technical Report” dated 24 April 1999. This report is available through the Access Board at 800.872.2253, or Beneficial Designs, Inc. at 831.429.8447 or mail@beneficialdesigns.com.
INTRODUCTION
The Americans with Disabilities Act (ADA) Accessibility Guidelines currently specify that surfaces that are required to be accessible must be “stable, firm, and slip resistant” (Section 4.5.1) (USATBCB, 1992). These requirements are subjective; objective measures are not specified. These characteristics have been defined as:
Stability – the degree to which a surface resists change from contaminants or applied force, so that when the contaminant or force is removed, the surface returns to its original condition;
Firmness – the degree of surface resistance to deformation, especially by indentation or the movement of objects; and
Slip-resistance – the degree to which a surface provides frictional counterforce to the forces exerted in walking to permit safe ambulation (USATBCB, 1994).
Questions have arisen relating to the appropriateness and usability of various surface materials in outdoor environments required to be accessible. Additional information is necessary to provide guidance to designers and operators in order that they can provide non-discriminatory access for people with disabilities. Outdoor surface accessibility guidelines would also improve accessibility for all persons, regardless of their abilities, to a vast number of areas, including recreational facilities, playgrounds, beaches, parks, outdoor stadiums, boating and fishing docks, campgrounds, and hiking trails.
RESEARCH OBJECTIVES
The objectives of this research were to:
1. Determine the energy costs and perceived level of difficulty to negotiate a range of outdoor surfaces among a small group of subjects with and without disabilities;
2. Objectively measure the firmness and stability of the test surfaces;
3. Determine the relationship between the objective surface measures, energy costs, and level of difficulty; and
4. Propose preliminary recommendations for accessibility guidelines for the firmness and stability of exterior surfaces.
METHODOLOGY
Test Courses & Surfaces
Test courses were designed and built using nine different types of exterior surfaces (Table 1). The ADAAG Accessible Course was used to evaluate subjects’ ability to ambulate in the community. This “access route” was 574.2 ft (175.0 m) in length, and included two 137 ft (41.8 m) sections with grades of 4% to 5% (one uphill, one downhill), and two 30-foot (9.1 m) ramps with grades up to 8.3% (one uphill, one downhill).
The two Straight Courses were 984.3 ft (300 m) in length with a 32.8 ft (10 m) turning radius at each end. The “P” shaped Turning Courses were designed such that one circuit around the course provided 328 ft (100 m) of walking distance and involved turning for 10% of the distance (both 90 and 180 degree turns). (See the Technical Report for course details.)
The test surfaces were objectively measured using the Wheelchair Work Measurement Method and the portable Rotational Penetrometer. To determine the energy required, persons with and without disabilities walked or wheeled across each of these surfaces. For reference and comparison purposes, objective measures were also obtained on a slip resistant ramp at different grades and seven carpet/pad combinations (Table 2).
| Test Course/Test Surface | Code |
| ADAAG Accessible Course: Unpaved #2 Road Mix(3/4" Class 2 aggregate) | ADAG |
| Straight Courses: Asphalt with exposed 1-in.minus aggregate | ASPS |
| Native soil | DIRS |
| P-shaped Turning Courses: Asphalt with exposed 1-in. minus aggregate | ASPP |
| Native soil | DIRP |
| Unpaved #2 Road Mix (3/4" Class 2 aggregate) | RDMX |
| Path Fines California Gold DG | PAFN |
| Path Fines with Stabilizer (Road Oyl® resin modified emulsion binder by Road Products Corp1) | RDOL |
| Wood Chips (chipped brush, average size 3x1x1 in., compacted to a depth of 5 in.) | CPBR |
| Engineered Wood Fiber J (loose-fill processed wood fibers, compacted to a depth of 5 in.) | EWFJ |
| Engineered Wood Fiber K (loose-fill processed wood fibers, compacted to a depth of 5 in.) | EWFK |
| Sand (dry) | SAND |
1 Resin Pavement is a trademark of Road Products Corporation and Soil Stabilization Products Company, Inc. The Road Oyl registered trademark and patent are the property of Road Products Corporation.
| Carpet | Code |
| Level loop, 100% nylon with a woven polypropylene backing; 0.16 in pile height; 28 oz pile weight | C1 |
| Interweave cut and loop (cut pile with loop pile at a different height), 100% nylon with a polypropylene backing; 0.281 in pile height(avg.); 43 oz pile weight | C2 |
| Level cut pile, 100% nylon; 0.50 in pile height | C3 |
| Pad | Code |
| No pad used | P0 |
| 0.25 in. fiber | P1 |
| 0.375 in. bonded urethane | P2 |
| 0.5 in. bonded urethane | P3 |
| 0.375 in. fiber | P4 |
| General Usage | Carpet/Pad Combinations |
| High traffic areas (e.g., lower level corridors, lobbies), for longer travel distances | C1P0, C1P1, C2P1 |
| Upper level corridors | C2P2, C2P4 |
| Executive offices and sleeping rooms, for shorter travel distances | C3P0, C3P3 |
Note: All carpet/pad combinations tested comply with current ADAAG.
Objective Surface Measurements
For purposes of comparison, objective surface measurement data are included from the “Measurement of Surface Characteristics for Accessibility” NIH-funded research project at Beneficial Designs. A wheelchair work measurement system and a portable surface measurement device were designed to objectively measure surface firmness and stability.
Wheelchair Work Measurement Method. Wheelchair work per meter values for straight and turning were determined for all test course surfaces except sand, under dry conditions using the Wheelchair Work Measurement Method in accordance with ASTM F1951–99 (formerly PS 83–97). Work per meter values were also determined for the reference ramp grades and carpet/pad combinations.
Rotational Penetrometer. The Rotational Penetrometer (Figure 1) is a portable device that provides accurate measurements of firmness and stability on a wide variety of surfaces. It can be used easily in the field, is suitable for trail use, and does not require a level surface for testing.
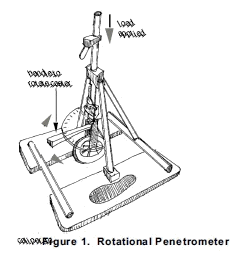
All of the test courses were measured using the Rotational Penetrometer under wet and dry conditions. Firmness was determined by applying a given force to the penetrator and then measuring the depth of penetration into the surface. The stability of a surface was measured by applying a given force, rotating the penetrator left and right 90 degrees, for a total of 360 degrees, and then measuring the final depth of penetration into the surface.
Human Subject Testing
Subject Recruitment. Subjects were recruited by gender and mobility limitation (no known disability, ambulatory with limited mobility, ambulatory with assistive devices, and manual wheelchair use). Informed consent was obtained from each participant. Prior to beginning their participation in this study, subjects were screened for “at risk” conditions for exercise. To characterize the study population, background information was collected, including age, gender, disability, assistive device use, independence in activities of daily living, and physical activity participation.
Standardized Tests of Physical Fitness and Community Ambulation. Energy expenditure at rest and during ambulation can be significantly affected by the individual’s level of fitness. In order to characterize the fitness levels of study participants, standardized tests of aerobic endurance (PWC170) and strength (hand grip) were completed.
Resting heart rate and energy consumption were measured with the subject seated or reclining on a couch. Heart rate was measured with a Polar heart rate monitor (Polar Vantage XL). Energy consumption was measured using a portable Aerosport KB1-C metabolic analyzer.
Subjects were asked to complete two laps of the ADAAG Accessible Course while their heart rate, energy consumption and velocity were recorded. Data were recorded during the second lap of the course. Upon completion of the ADAAG course, subjects were asked to rate their level of perceived exertion using the RPE Scale (Borg, 1974). Subjects were also asked to rate the difficulty they had walking or wheeling on the ADAAG course. Perceived difficulty was designed to consider factors such as the security of footing, obstacle negotiation, and effort required on slopes. The subjects rated the level of difficulty from 1 to 10 for both straight travel and turning on the surface using the Level of Difficulty Rating Scale. Subjects were instructed that a rating of “1” represented a hard, level, indoor surface. A rating of “10” was the difficulty level for walking on sand.
Energy Consumption During Ambulation. Measurements were recorded for subjects walking on the Straight and Turning Courses. Subjects walked on each surface at their preferred pace, until the physiological variables (energy consumption, heart rate, velocity) had stabilized (2‒3 minutes) and the data collection period (an additional 2 minutes) had been completed. Rating of perceived exertion (RPE) and level of difficulty were recorded after the subject had completed each course. Subjects were instructed to rate the difficulty of each surface for both straight travel and turning. A combined level of difficulty rating was calculated as the weighted total of the straight and turning scores in relation to the amount of turning required for each course (10% turning for “P” course, no turning for the straight courses). The order of the surfaces tested was randomly assigned and a 10‒15 minute rest interval was permitted between tests to ensure that the physiological measures had returned to resting levels.
Data Analyses
Net energy consumption – the additional energy utilized during walking in excess of resting levels – was calculated for each surface. Relative oxygen consumption values (ml O2/kg weight/min) measured during the data collection period (stable, plateau phase) were averaged for the resting data and each test surface. The net energy consumption (ml/kg/min) was calculated by subtracting the average resting value from the value for each test surface. The net energy consumption was divided by the velocity of walking in order to standardize the data for comparison between subjects. Thus, the energy consumption for each surface (oxygen consumption/kilogram of body weight/meter) was standardized relative to subject size (body weight), resting metabolic levels and speed of ambulation.
Frequency tabulations were used to identify data entry errors. T-tests and correlations were used to evaluate the relationships between numerical data. The impact of categorical data was evaluated using analysis of variance (ANOVA) statistics. Statistical significance was set at p < 0.05 for all analyses.
EXPLANATION OF STUDY DESIGN
What was measured and why?
Energy Consumption – Measuring the oxygen a person consumes indicates how much energy the body is producing. When the oxygen consumption is measured at rest (i.e., with the person sitting or lying down), the amount of energy the body is using to function (e.g., for making the heart pump, organs function) can be determined. If an individual walks at a steady pace for 3 to 4 minutes, energy consumption will stabilize at a level that is equal to the energy required to negotiate that environment. By subtracting the resting oxygen consumption from the oxygen consumption while walking/wheeling, the amount of energy being used specifically for walking can be determined.
Walking Speed – If adults are asked to walk at their freely chosen speed they automatically select the type of movement and speed that requires the least amount of energy. If an individual is forced to walk either faster or slower than this chosen pace, the amount of energy used will increase. Therefore, f or this study, subjects were allowed to determine their own preferred pace so that energy consumption in its “most efficient” state could be measured.
Heart Rate and Rating of Perceived Exertion – Rating of perceived exertion (RPE) is a research scale used to document the individual’s perception of how difficult it is for his/her body to perform an exercise (i.e., how hard the individual’s lungs are breathing, and heart is pumping). RPE scores have been shown through research to be consistently related to measures of heart rate and amount of exercise, regardless of the type of exercise. In general, the RPE score is equal to the steady state heart rate divided by 10.
Level of Difficulty – Level of difficulty is similar to the rating of perceived exertion in that it attempts to quantify the individual’s subjective perception of the activity. However, it differs from the rating of perceived exertion in that it is not specific to how the heart and lungs are performing. Often, an unstable surface, for example, may be perceived as very difficult because of the unstable footing, even though the individual does not have to exert him/herself. Level of difficulty was recorded to evaluate factors (e.g., ease of slipping, uneven surfaces) that would not necessarily affect the energy consumption but may impact the overall “accessibility” of the surface.
Why test on straight courses and P-shaped turning courses? Constructing long test courses enables comparison of subject data with research done by other investigators in which subjects walk on a straight linear course or in large diameter circles or ovals. However, the cost for producing these course designs with a number of surface materials would be very large. As a compromise, the construction of two long courses enabled some comparisons with published research without generating prohibitive surface construction costs. In this study, there was also a desire to have the subjects walk on the test surfaces in a manner that would reflect the types of ambulation that would represent functional mobility. This functional mobility includes both turning and walking in a straight path on any given surface. The “P” courses were designed so that the subject was turning for approximately 10% of the total distance.
What happens when people walk under more difficult conditions? In general, when people walk under more difficult conditions there is: 1) a decrease in speed (to decrease the energy required), 2) an increase in heart rate (to pump more oxygen to the muscles), and/or 3) an increase in total energy consumption (when the other compensating mechanisms are not sufficient).
Which surfaces are accessible to everyone? There are no surfaces that are accessible to everyone, because there is an infinite range of abilities among the population. Participants in this study were recruited to represent a variety of disabilities. They completed standard tests of fitness to ensure that a variety of ability levels was represented. Currently, our society has made a decision on what is considered “sufficiently accessible,” that being environments that comply with the current ADAAG. Although it is recognized that not all individuals have independent access in an ADAAG environment, these standards have been designated “accessible enough” for most people. It should be noted that all powered mobility technologies are able to negotiate ADAAG environments and represent an option for persons without the functional mobility to negotiate these environments.
RESULTS OF OBJECTIVE SURFACE MEASUREMENT
Wheelchair Work Measurements. The work required to propel a wheelchair in a straight path provided an indication of the firmness of the surface. The work required to propel a wheelchair through a 90 degree turn provided an indication of the stability of a surface. Wheelchair work per meter values were not obtained for sand because it was not possible to propel the wheelchair through this surface. The work to negotiate a ramp was linearly related to the angle of the ramp. The work required to propel across the level surface was compared to the work required to propel up or through a turn on various ramp angles in order to relate the work required for the surface to ADAAG specifications for “sufficiently accessible” levels of work (e.g., 8.3% grade for 30 feet).
The dirt (DIRP), chipped brush (CPBR), and engineered wood fiber (EWFK and EWFJ) surfaces had higher work per meter values compared to the other exterior surfaces (Figure 2, Figure 3).
Chipped brush and the engineered wood fibers (J and K) all required more work to roll on than a 3% ramp (chipped brush equates approximately to a 3.7% ramp). These three surfaces also required more work to negotiate than the ADAAG course and the crushed granite with stabilizer. It is recommended that these surfaces be considered moderately firm and stable, and be suitable for use in level areas for a limited distance (e.g., around a campsite) or for shorter distances on trails.
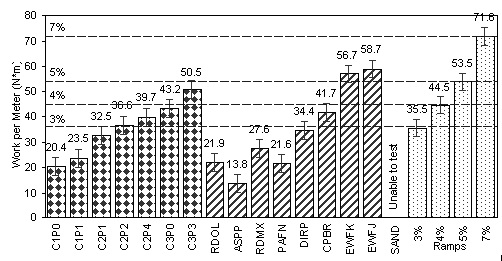
Figure 2. Wheelchair Work Values for Straight Propulsion
Note: The “I” shaped vertical lines indicate the standard error of the mean, a statistic that estimates the variability expected if repeated samples of the same size are taken. It is calculated by dividing the standard deviation of the observations by the square root of the number of observations.
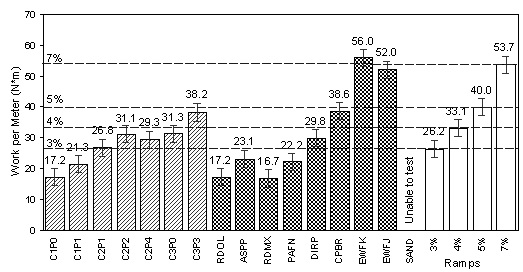
Figure 3. Wheelchair Work Values for Turning
Rotational Penetrometer Measurements of Firmness and Stability. The Rotational Penetrometer penetrated significantly more on the dirt (DIRP), chipped brush (CPBR), engineered wood fiber (EWFJ and EWFK), and sand (SAND) surfaces compared to the other exterior surfaces, indicating decreased firmness and stability (Figure 4, Figure 5). The results of the Rotational Penetrometer correlated with those of the Wheelchair Work Measurement Method.
All of the exterior surfaces, except sand, became less firm in wet conditions (Figure 6). All exterior surfaces, except chipped brush (CPBR), became less stable when wet (Figure 7). While engineered wood fiber K (EWFK) became only slightly less stable, engineered wood fiber J (EWFJ) and path fines (PAFN) became much less stable. Path fines without stabilizer and dirt, while stable in a dry condition, became unstable and moderately stable when wet, respectively.
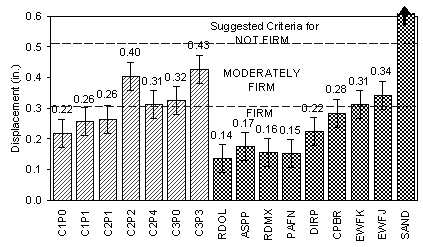
Figure 4. Rotational Penetrometer Firmness Measurements
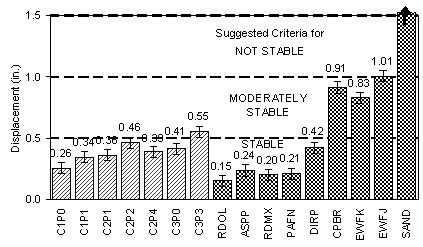
Figure 5. Rotational Penetrometer Stability Measurements
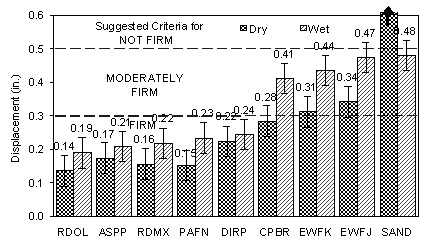
Figure 6. Rotational Penetrometer Firmness Measurements for Dry and Wet Surfaces
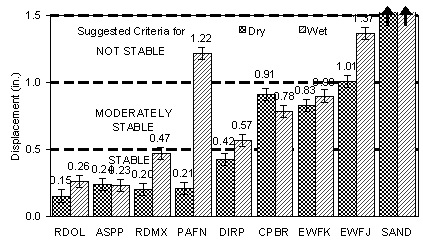
Figure 7. Rotational Penetrometer Stability Measurements for Dry and Wet Surfaces
RESULTS OF HUMAN SUBJECT TESTING
Characteristics of Study Participants
Thirty-nine (39) subjects (23 female, 16 male) participated. Subjects were classified into one of four groups:
1) No disability – no known disability or mobility limitation; 2) Ambulatory with limited mobility – persons whose mobility was impaired, but who did not use any type of assistive device for ambulation; 3) Ambulatory with assistive device – persons with a mobility limitation who used an assistive device, such as crutches, a cane, a walker, a surgical implant or prosthetic limb; or 4) Wheelchair user – manual wheelchair users (Table 3). The subjects within each disability category had a wide range of fitness and ability levels.
A statistically significant correlation between total energy required for the ADAAG course and the energy required for each surface (except sand) indicates that for a given subject the level of community mobility is related to the “accessibility” of outdoor surfaces.
On the surfaces objectively measured as firm and stable, subjects with higher fitness levels had lower heart rate and RPE scores (i.e., walking was less difficult). On dirt, wood chips, and engineered wood fibers J and K, fitness level was correlated with all measures of surface “accessibility.” Higher fitness levels resulted in lower energy consumption, higher velocity, lower heart rate, and lower RPE.
Table 3. Demographic Characteristics of Study Participants (Mean ± 1 SD, (min - max)
| Dis | G | N | Age (yrs) | Yrs with Disability |
| All | F | 23 | 35.9 ± 9.0 (22 - 49) | 15 ± 12 (3 - 47) |
| M | 16 | 34.3 ± 7.7 (24 - 46) | 11 ± 9 (3 - 29) | |
| NoDis | F | 7 | 32.7 ± 9.1 (22 - 45) | NA |
| M | 7 | 33.2 ± 7.7 (24 - 44) | NA | |
| AwLM | F | 8 | 37.4 ± 10.6 (22 - 47) | 17 ± 15 (3 - 47) |
| M | 1 | 44.5 (44.5) | 3 (3) | |
| AwAD | F | 4 | 36.5 ± 8.0 (25 - 41) | 12 ± 9 (3 - 24) |
| M | 2 | 30.7 ± 8.3 (25 - 37) | 14 ± 9 (7, 20) | |
| Wc | F | 4 | 37.5 ± 8.4 (29 - 49) | 13 ± 13 (5 - 32) |
| M | 6 | 35.0 ± 8.1 (26 - 46) | 11 ± 9 (3 - 29) |
| Dis = Disability | NoDis = No known disability |
| G = Gender | AwLM = Ambulatory with limited mobility |
| N = Number of subjects | AwAD = Ambulatory with assistive devices |
| NA = Not applicable | Wc = Manual wheelchair user |
| All = All subjects combined |
Energy Requirements for Different Surfaces
The energy consumption results are shown in the following table and figures.
Table 4. Average Energy Consumption (mlO2/kg/m) for Each Surface by Subject Group
| Energy Consumption above Resting Values | |||||||||||
| Rest | ADAG | RDOL | ASPP | RDMX | PAFN | DIRP | CPBR | EWFK | EWFJ | SAND | |
| NoDis | 2.42 | 0.10 | 0.09 | 0.10 | 0.09 | 0.09 | 0.11 | 0.10 | 0.10 | 0.11 | 0.16 |
| AwLM | 2.50 | 0.14 | 0.15 | 0.12 | 0.14 | 0.15 | 0.16 | 0.16 | 0.14 | 0.18 | 0.12 |
| AwAD | 2.95 | 0.12 | 0.15 | 0.18 | 0.16 | 0.18 | 0.18 | 0.21 | 0.21 | 0.22 | 0.26 |
| Wc | 3.05 | 0.14 | 0.10 | 0.12 | 0.12 | 0.10 | 0.20 | 0.28 | 0.31 | 0.37 | 1.31 |
| Rest = Resting energy consumption (mlO2/kg/min) | AwLM Ambulatory with limited mobility |
| NoDis No known disability | Wc Manual wheelchair use |
| AwAD Ambulatory with assistive devices |
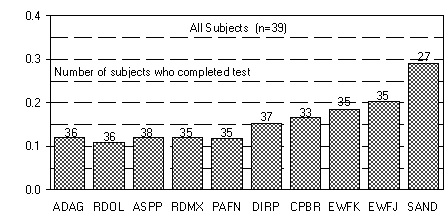
Figure 8. Average Energy Consumption for All Subjects Combined
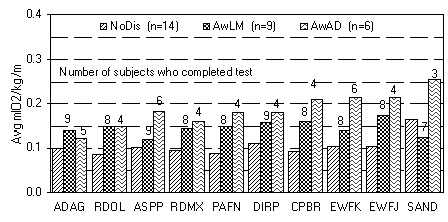
Figure 9. Average Energy Consumption for Subjects with No Disability (NoDis), Ambulatory with Limited Mobility (AwLM), and Ambulatory with Assistive Devices (AwAD)
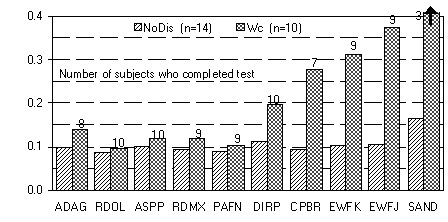
Figure 10. Average Energy Consumption for Subjects with No Disability (NoDis)and Manual Wheelchair Users (Wc)
COMPARISON OF OBJECTIVE MEASURES AND ENERGY COSTS
Objective measures of surface firmness and stability were compared to energy costs (energy consumption, velocity, RPE and level of difficulty) to negotiate the surfaces. All human subject measures were significantly correlated to the objective measures. All correlations were strong (>0.85; maximum 1.0 for a perfect correlation), except for the medium correlation between penetrometer firmness and velocity (r = −0.6). Velocity was inversely related to firmness and stability. All other variables were directly related to firmness and stability.
There was a strong, second order polynomial relationship between the Rotational Penetrometer stability measurements and the average energy cost for wheelchair users. As the surface became less stable (Rotational Penetrometer displacement increased), the energy cost for wheelchair users increased more dramatically than for ambulatory individuals with and without disabilities.
COMPARISON OF FINDINGS WITH OTHER PUBLISHED RESEARCH
What would happen with other disability groups? Overall, our results are very similar to the published literature for similar populations. Therefore, we would hypothesize that our results would also be similar if we had tested other disability populations or older adults. The published literature for children indicates that their energy consumption levels are considerably higher than for adults with similar disabilities. In general, children have higher levels of energy expenditure because they are less “practiced” and therefore less efficient in their movement. However, generally children can also tolerate higher levels of energy expenditure, and therefore higher levels of energy consumption do not necessarily relate to a lack of accessibility. (See the Technical Report for detailed comparisons and complete references).
What proportion of the population could negotiate these surfaces? Energy consumption, level of difficulty rating and rating of perceived exertion were evaluated to determine the proportion of our subjects who considered each surface to be “accessible.” An “accessible” surface was one that required less than 0.20 mlO2/kg/m energy consumption, a level of difficulty rating less than 6 (“difficult”), or a rating of perceived exertion less than 13 (“somewhat hard”). Over 90% of our subjects found the objectively firm and stable surfaces to be “accessible,” while over 80% of the subjects considered the packed dirt surface “accessible.” In comparison, less than 70% of the subjects considered the wood products or sand surfaces to be accessible. Further, the percentage of subjects who considered sand to be accessible is probably artificially high because many subjects, particularly those using wheelchairs, refused or were unable to complete the sand test. If we assume that other disability groups would have similar results (as indicated above), we can hypothesize that in general, at least 80% of the population would consider the surfaces that meet the proposed criteria for “firm and stable” to be accessible.
CONCLUSIONS
The results of this pilot study suggest:
• Surfaces that can be objectively measured as firm and stable generally require less energy, are perceived as less strenuous, allow higher ambulation velocities, and are perceived as less difficult to walk on.
• Ambulation tends to be more difficult (i.e., increased energy consumption, higher ratings of perceived exertion, higher levels of difficulty ratings and decreased velocity) on wood chips (CPBR), engineered wood fiber J (EWFJ), and engineered wood fiber K (EWFK) surfaces.
• Sand (SAND) is the most difficult surface for all user groups, but the difference is particularly dramatic for those using a manual wheelchair.
• Ambulatory subjects with mobility limitations (with and without assistive devices) have higher energy costs on the surfaces that are objectively measured as firm and stable, which may explain in part why their energy costs had a relatively smaller increase on the surfaces that were not objectively measured as firm and stable.
• There is some indication, even with the limited number of subjects in this study, that the softness of a surface can improve the comfort of walking on the surface when using prosthetic technologies. For the same reason that people prefer to run on non-paved surfaces, some users would find walking on non-paved surfaces more comfortable as well.
• The low energy costs for manual wheelchair users on surfaces that were objectively measured as firm and stable increase dramatically on the surfaces that were not measured as firm or stable.
• Community mobility of the subjects as measured by total energy expenditure on the ADAAG course, level of fitness as measured by the PWC170 and grip strength tests, and the type of mobility limitation were significantly related to the “accessibility” of the surfaces (i.e., subjects who had difficulty ambulating in an ADAAG-compliant environment also found it more difficult to ambulate on surfaces that were not objectively measured as firm and stable).
• Energy expenditure increases for ambulation with turns relative to ambulation on a straight course. Further investigation would be required to understand the impact of the type of mobility limitation (particularly for the ambulatory groups), the specific type of disability, and the specific type of assistive device used.
• All subject testing was conducted on surfaces under dry conditions. Conclusions for these types of surfaces under wet conditions could be inferred from the results of objective measurement methods under “wet” conditions.
• Path fines and dirt were significantly less firm and stable under wet conditions. Increased energy expenditure would be expected on these surfaces in a wet condition for people who have increased levels of energy expenditures on less firm and stable surfaces.
• The Wheelchair Work Measurement Method provides reliable measures of the work required to propel a wheelchair across a level surface. However, the test equipment is not portable, and measurements are unreliable on sloped surfaces. Therefore, it is not suitable as a standard test method for exterior surfaces.
• The Rotational Penetrometer test procedure has been proven to provide consistent and repeatable objective measures of both firmness and stability on a full spectrum of surfaces, ranging from very hard and stable to very soft and unstable (i.e., concrete to sand).
• The Rotational Penetrometer is easy to use, portable, provides repeatable results on surfaces that are level within 5%, and is capable of measuring surfaces under both wet and dry conditions.
• Measurements obtained with the Rotational Penetrometer correlated with the results of the Wheelchair Work Measurement Method. They also correlated with the level of difficulty ratings and measures of energy consumption for subjects walking on a variety of surfaces.
RECOMMENDATIONS
An objective test procedure for measuring the firmness and stability of surfaces with a portable device and performance specifications need to be accepted in order to enable land managers to determine whether the surface material on a trail (i.e., on site) is considered “accessible.” Surface firmness and stability should be measured using an objective device suitable for use “on trail” or in the field because surface characteristics vary dramatically depending on the installation at the actual site.
Recommended Objective Test Method and Performance Specifications
The objective test method using the Rotational Penetrometer is recommended because it provides valid and reliable measurements of surface firmness and stability on slopes up to 5%, can be used on a wide variety of surface materials, and is suitable for conducting “on trail/on site” tests.
The following are recommended performance specifications for firmness and stability under dry conditions based on the Rotational Penetrometer test results and the human subject results from this research.
| Firmness | Penetration Depth | Firmness Rating |
| Firm | 0.3 inch or less | 3 or lower |
| Moderately Firm | >0.3 to 0.5 inch | >3 to 5 |
| Not Firm | >0.5 inch | >5 |
| Stability | Penetration Depth | Stability Rating |
| Stable | 0.5 inch or less | 5 or lower |
| Moderately Stable | >0.5 to 1.0 inch | >5 to 10 |
| Not Stable | >1.0 inch | >10 |
The proposed cut-off values for firm and stable surfaces generally correspond to the work required to propel a wheelchair up a 3% slope. The proposed cut-off values for moderately firm and stable surfaces generally correspond to the wheelchair work per meter values for a 7% slope.
Objective ratings of firmness and stability should be disclosed to all users through trail signage.
Surfaces that are firm, but only moderately stable should be allowed on linear trails less than 0.5 mile in length (i.e., do not require a lot of turning or pivoting).
Surfaces that are both moderately firm and moderately stable should be allowed on level trails (less than 3% slope in any direction to allow drainage) less than 0.1 mile in length (distances that are similar to those found in indoor environments), or in confined outdoor areas that are level (less than 3% slope in any direction to allow drainage) and where the distances traveled are less than 50 ft (e.g., around a picnic table, on a campsite).
Based on these proposed specifications, the asphalt (ASPP), unpaved road mix (RDMX), path fines (PAFN), path fines with stabilizer (RDOL), and native soil (DIRP) surfaces tested in this research would be considered firm and stable under dry conditions. The wood chips (CPBR) and engineered wood fiber K (EWFK) would be considered moderately firm and stable and would potentially be allowed for limited distances. Engineered wood fiber J (EWFJ) would not be considered firm nor stable. Some carpeted surfaces currently considered “accessible” (i.e., maximum pile thickness of 0.5 in.) would not comply with the proposed specifications.
Recommendations for Future Research
• Due to the small and diverse group of subjects, additional research involving persons who are ambulatory with limited mobility would need to be conducted to validate the results of this study, and provide additional information on this subject group regarding which surfaces are accessible or preferred.
• Direct measures of energy consumption should be recorded in combination with subjective ratings of difficulty to obtain an accurate assessment of surface “accessibility” for the user.
• Future research should evaluate energy consumption using both linear travel and ambulation with turns. The evaluation of linear travel facilitates comparisons with results from previous research; however it does not accurately represent the energy expenditure of community ambulation (which almost always involves some turning). In order to compare results between studies, a standard test course design which incorporates both 90 and 180 degree turns would have to be agreed to by all researchers working in this area. The proportion of turning and straight travel for such a course should reflect the “typical” patterns of ambulation in the community. (See the Technical Report for details on the test courses used in this research.)
• The oldest subjects in the published literature were 65 to 70 years of age. Additional testing with individuals over 70 years of age would be required to verify specific surface accessibility requirements for that age group.
• Children with and without disabilities have higher levels of energy expenditure because they are less “practiced,” and therefore less efficient in their movement. Additional research would be required to verify whether children with disabilities have the capacity to access surfaces that require an increase in energy consumption relative to a paved surface.
• Additional research would be required to determine the validity and repeatability of the Rotational Penetrometer measurements on surfaces with slopes greater than 5%.
• The exact specifications for conducting Rotational Penetrometer tests under wet conditions (e.g., specifications for the wetting procedure, the intervals at which measurements should be made after the wetting procedure) or to determine the “wetness” of surfaces tested on-site would need to be developed and validated through future research.
• Based on the findings of this research, carpet on sloped surfaces may be an accessibility issue. Additional research should examine the existing requirements for carpet and carpetpad combinations.
• To evaluate the impact of other surface variables, such as slip resistance and the “levelness” or “evenness” of the surface, further research would be required.
• Additional research would be required to evaluate the impact of surface firmness and stability in combination with other trail characteristics, such as distance, grade, cross slope or obstacles.
User Comments/Questions
Add Comment/Question