Visual Detection of Detectable Warning Materials by Pedestrians with Visual Impairments - Final Report
2.5 Visual Detection Distance
As described in the Method section, the maximum distance up to 7.92 m (26 ft) at which each participant could see each detectable warning was measured. These data were then analyzed at 1-foot intervals from 2.44 m (8 ft) to 7.92 m(26 ft) by counting the number of participants at each distance who were able to see the detectable warning. For this analysis, we assumed that participants who could see a particular detectable warning from a greater distance could also see it from closer distances. For example, if a participant first saw the detectable warning from a maximum distance of 4.3 m (14 feet), and saw the detectable warning when tested at the 2.44 m (8 ft) distance, then we assumed that the participant could also see the detectable warning at all intermediate distances between 2.44 m (8 ft) and 4.3 m (14 ft).
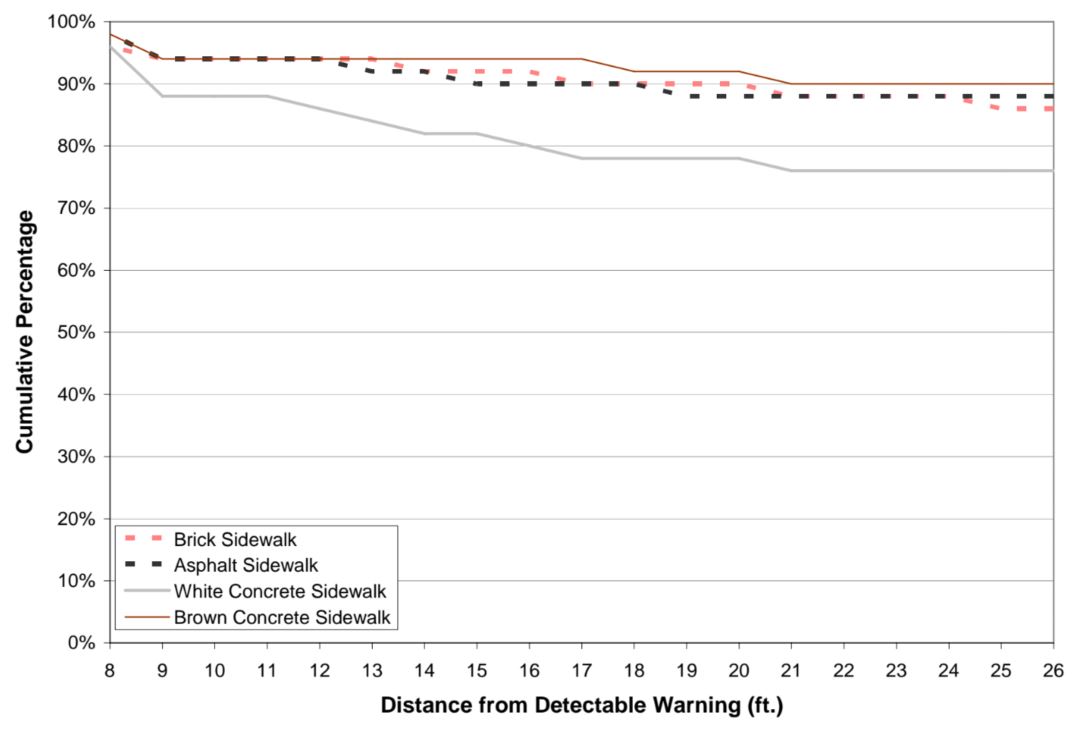
The results of this analysis are summarized in Figure 8 through Figure 20. In each of these figures, the percentage of participants (n = 50) who were able to see a particular detectable warning from distances between 2.44 m (8 ft) and 7.92 m (26 ft) is plotted at 1-foot intervals. For clarity of presentation, four different lines, corresponding to the four different sidewalk colors tested have been drawn to connect the data points. These lines show how the percentage of participants who were able to see the detectable warning changes with distance for the four different sidewalk colors tested. For any observed percentage value (P) plotted in Figure 8 through Figure 20, a 95-percent confidence interval for the true population percentage ma y be constructed by applying the formula:
95% confidence interval = [P-1.96 (SQRT(P*(1-P)/50), P+1.96 (SQRT(P*(1-P)/50)].
For the reader’s convenience, confidence intervals for several values of P are given in Table 5, however, to assure clarity of presentation, no confidence bounds are shown in Figures 8 through Figure 20.
As expected, the percentage of participants who were able to see the detectable warning increases with distance from 7.92 m (26 ft) to 2.44 m (8 ft). Some of the detectable warning colors tested had much higher rates of visual detection at both 2.44 m (8 ft) and at 7.92 m (26 ft) than other colors. In cases where the sidewalk color is similar to the detectable warning color, the percentage of participants who were able to see the detectable warning is reduced. In fact, the least detectable combinations were the white “concrete” detectable warning on the white sidewalk and the brown “concrete” detectable warning on the brown sidewalk. In these cases, the detectable warning color and the sidewalk color were nearly identical.
| Percentage | Lower bound | Upper bound |
|---|---|---|
| 5% | 0% | 11% |
| 10% | 2% | 18% |
| 15% | 5% | 25% |
| 20% | 9% | 31% |
| 25% | 13% | 37% |
| 30% | 17% | 43% |
| 35% | 22% | 48% |
| 40% | 26% | 54% |
| 45% | 31% | 59% |
| 50% | 36% | 64% |
| 55% | 41% | 69% |
| 60% | 46% | 74% |
| 65% | 52% | 78% |
| 70% | 57% | 83% |
| 75% | 63% | 87% |
| 80% | 69% | 91% |
| 85% | 75% | 95% |
| 90% | 82% | 98% |
| 95% | 89% | 100% |
Detection distances for the 10 single-color detectable warnings are shown in Figure 8 through Figure 17. In these 10 figures, the 4 plotted lines tend to spread apart, indicating that the percentage of participants who can see these detectable warnings depends on the sidewalk type. However, in Figure 18 through Figure 20, which show data for the black-and-white patterned detectable warnings, the four plotted lines tend to run close together, indicating that the percentage of participants who were able to see these black-and-white patterned detectable warnings does not depend strongly on sidewalk type. Overall, the black-and-white patterned detectable warnings tended to be seen by more participants than most of the single color detectable warnings.
Figure 8. Graph. White Detectable Warning: Percentage of Participants Who Could See the Detectable Warning at Each Distance
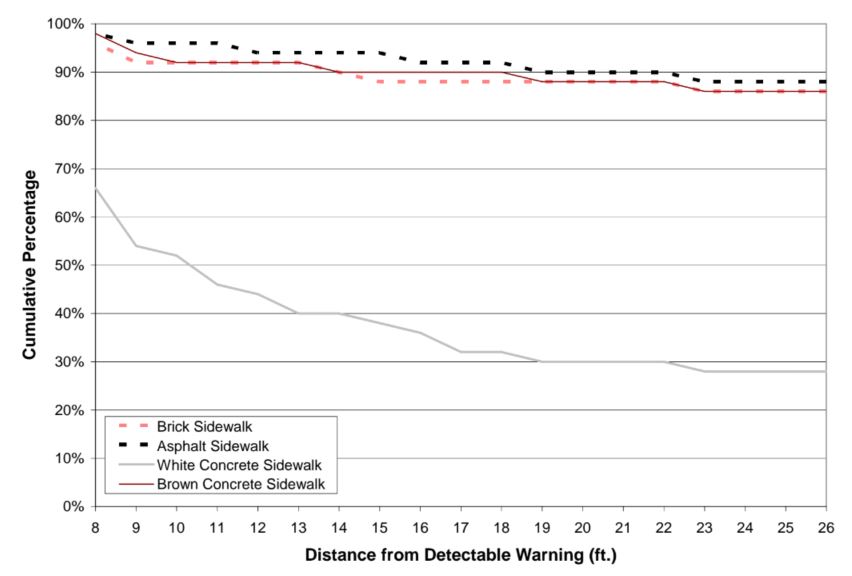
Figure 9. Graph. Light Gray Detectable Warning: Percentage of Participants Who Could See The Detectable Warning at Each Distance
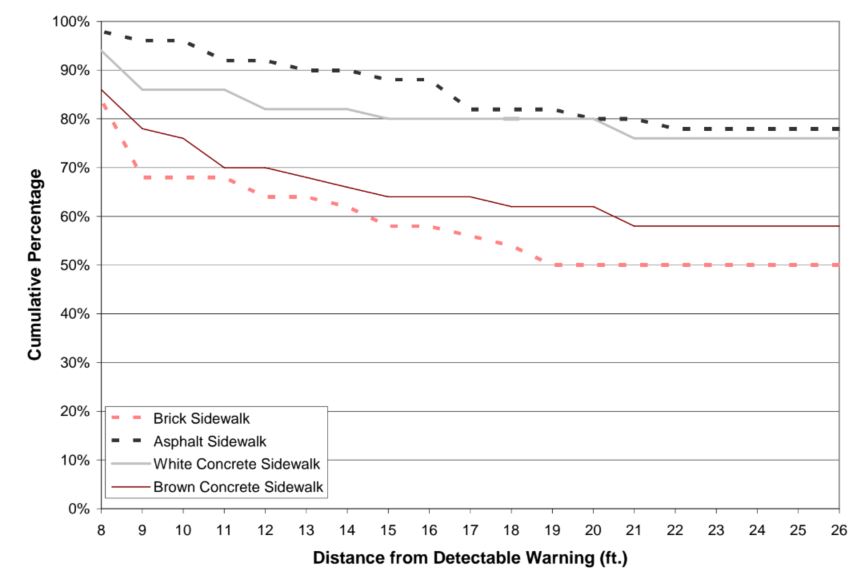
Sidewalk Figure 10. Graph. White Concrete Detectable Warning: Percentage of Participants Who Could See the Detectable Warning at Each Distance
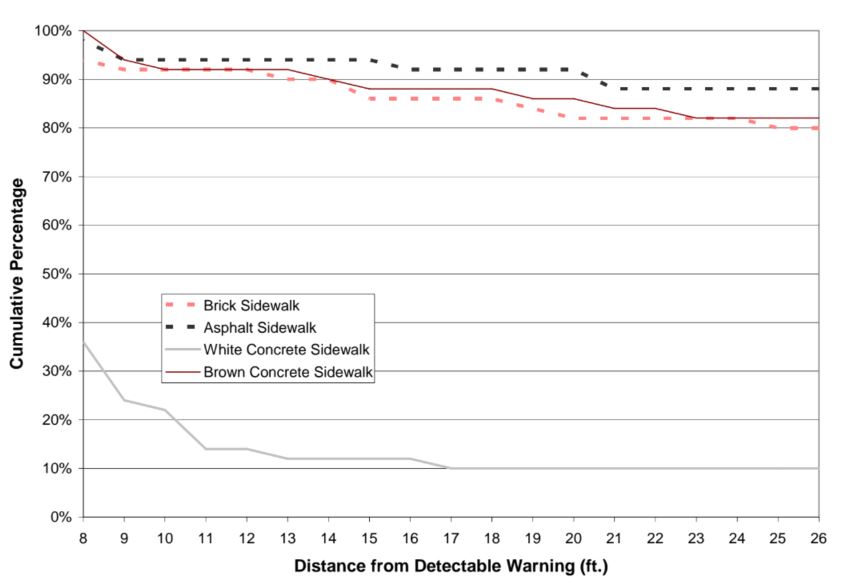
Figure 11. Graph. Brown Concrete Detectable Warning: Percentage of Participants Who Could See the Detectable Warning at Each Distance
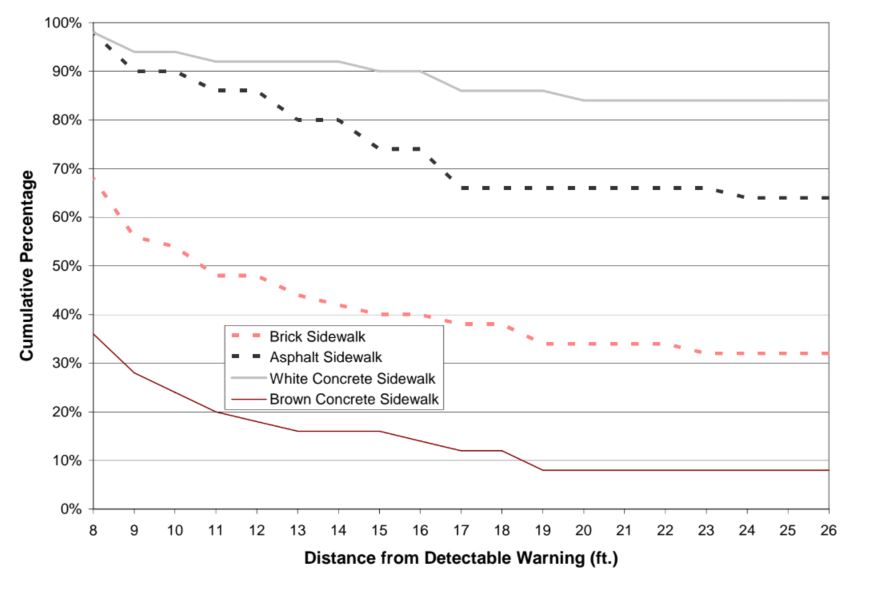
Figure 12. Graph. Dark Gray Detectable Warning: Percentage of Participants Who Could See the Detectable Warning at Each Distance
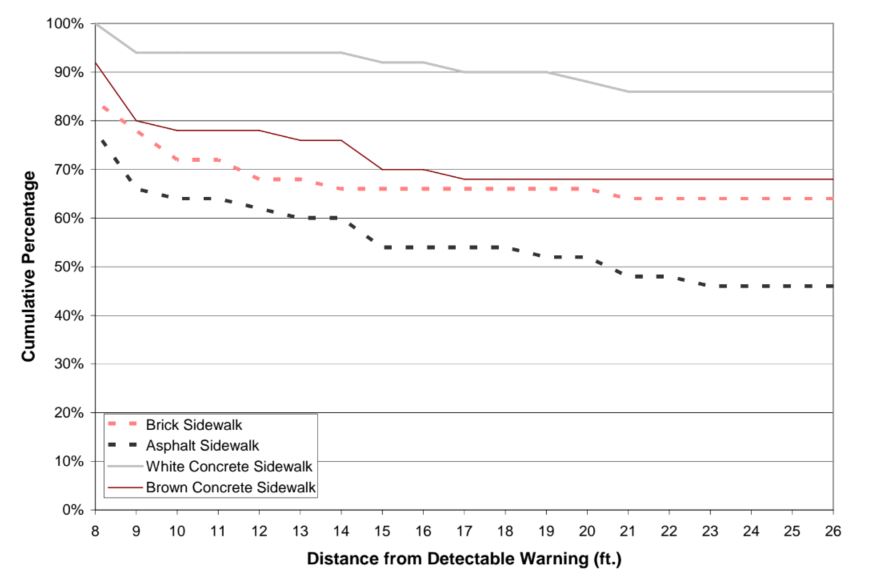
Figure 13. Graph. Federal Yellow Detectable Warning: Percentage of Participants Who Could See the Detectable Warning at Each Distance
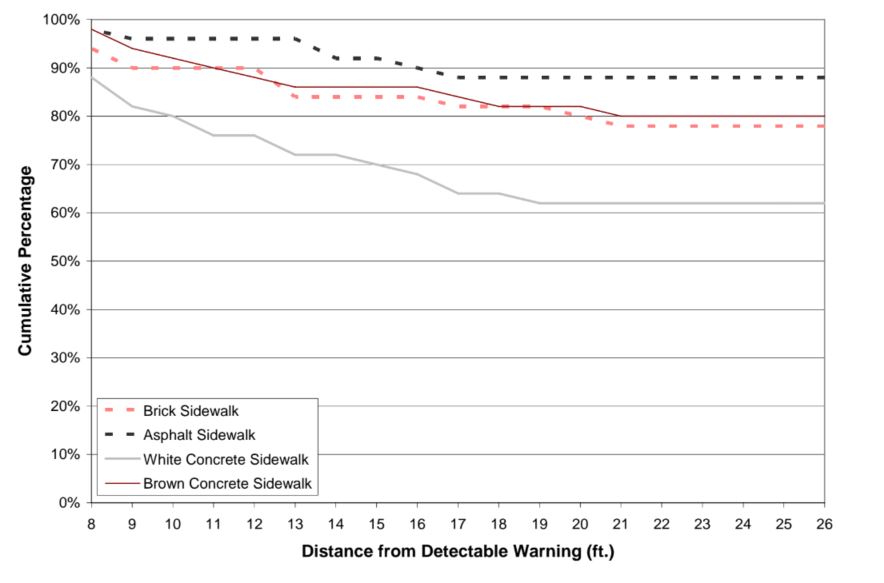
Figure 14. Graph. Pale Yellow Detectable Warning: Percentage of Participants Who Could See the Detectable Warning at Each Distance
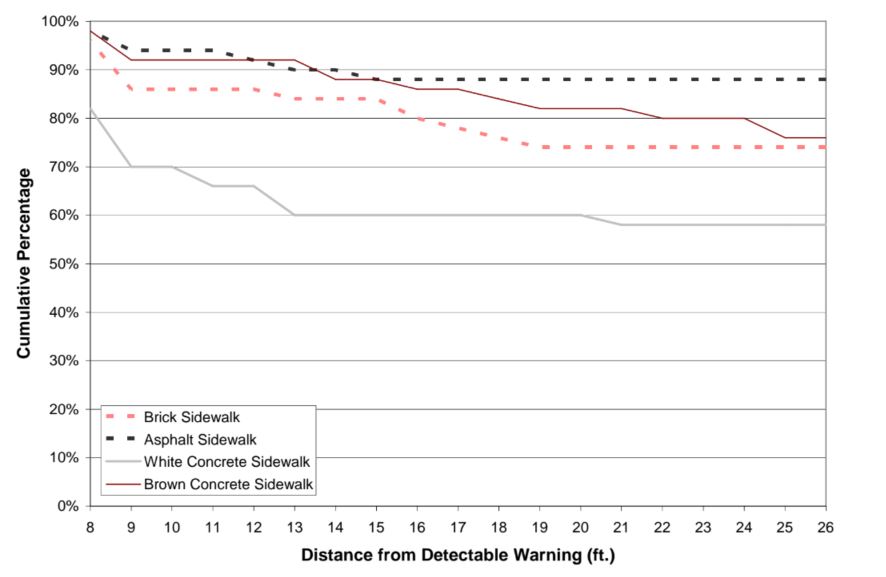
Figure 15. Graph. Bright Red Detectable Warning: Percentage of Participants Who Could See the Detectable Warning at Each Distance
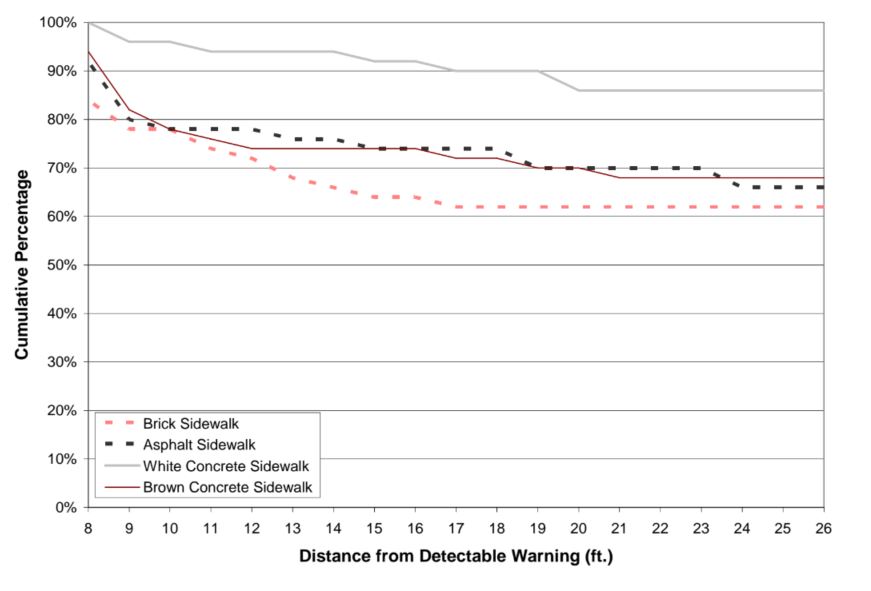
Figure 16. Graph. Orange-Red Detectable Warning: Percentage of Participants Who Could See The Detectable Warning at Each Distance
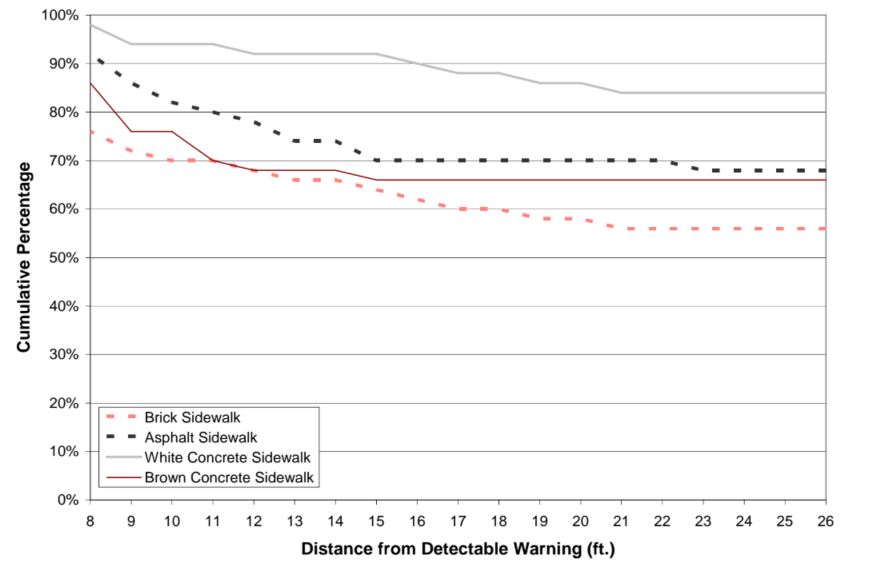
Figure 17. Graph. Black Detectable Warning: Percentage of Participants Who Could See the Detectable Warning at Each Distance
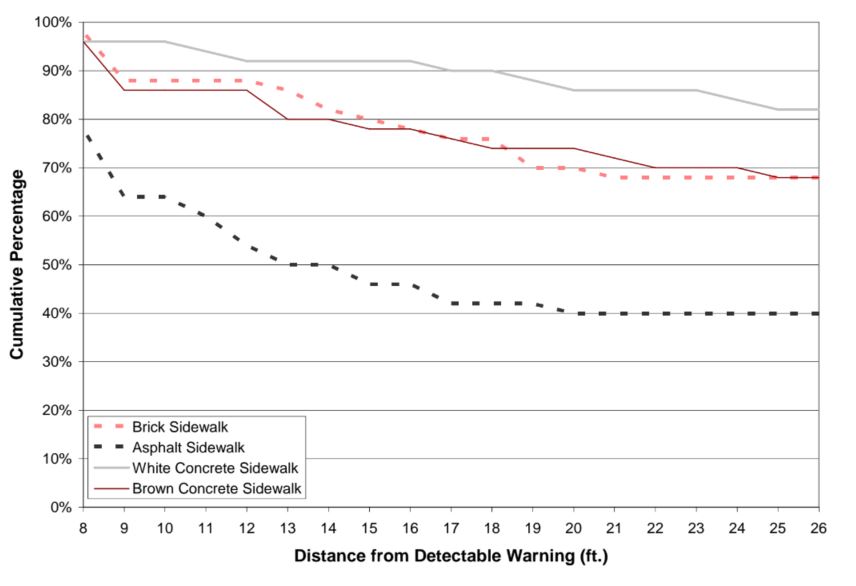
Figure 18. Graph. Black with White Border Detectable Warning: Percentage of Participants Who Could See the Detectable Warning at Each Distance
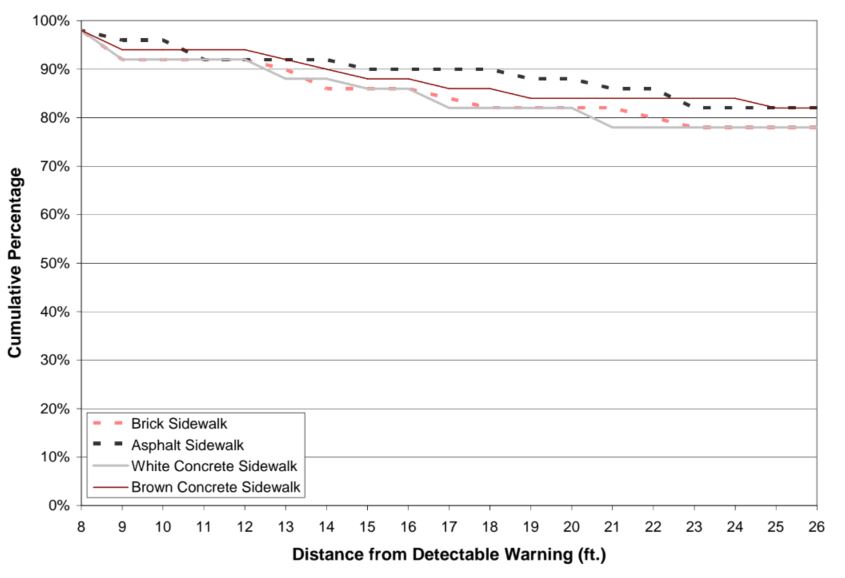
Figure 19. Graph. Black-and-White Stripes Detectable Warning: Percentage of Participants Who Could See the Detectable Warning at Each Distance
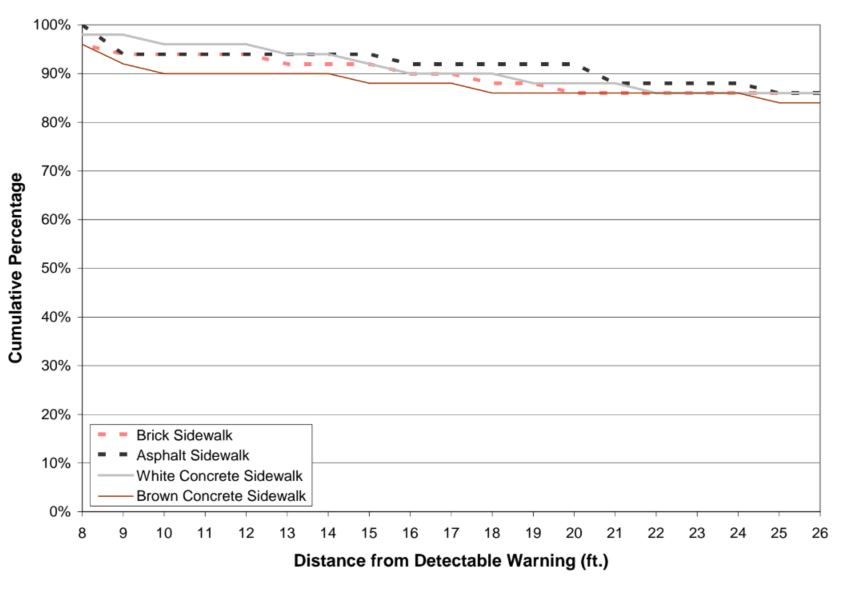
Figure 20. Graph. White with Black Border Detectable Warning: Percentage of Participants Who Could See the Detectable Warning at Each Distance
2.5.1 Comparing Visual Detection Distances for Detectable Warnings
For practical purposes, someone trying to decide between two or more available detectable warning colors for a particular sidewalk application may want to know which of the colors could be seen by people with visual impairments from the greatest distance. As shown by the previous set of figures, visual detection depends on the color of the sidewalk as well as the color of the detectable warning. Thus, for a given sidewalk type, it is necessary both to know which of the detectable warning colors tested in this study could be seen at greater distances than other colors and to have a means to decide whether any observed differences in detection distance were statistically significant.
The data on maximum visual detection distance were constrained by the experimental procedure which permitted minimum and maximum viewing distances of 2.44 m (8 ft) and 7.92 m (26 ft). The data are strongly skewed, with many trials resulting in visual detection at a distance of 7.92 m (26 ft). Other trials resulted in detection at various distances between 2.44 m (8 ft) and 7.92 m (26 ft), and some trials did not result in detections. Although viewing distances closer than 2.44 m (8 ft) were not tested, the study team coded detection distance for trials with non-detections as zero feet. In order to compare the detection distances for the 13 detectable warnings, we performed a series of pairwise comparisons using a non-parametric statistic appropriate for repeated measures data. Using SAS statistical software, we computed the Wilcoxon Signed-Rank statistic for each of the 78 possible pairwise comparisons of the 13 detectable warnings on a given sidewalk. In order to control the probability of the statistical Type I error at .05 across the entire set of 78 comparisons, we used a criterion of α = .05 / 78 = .000641 for each pairwise comparison. This method for controlling Type I error is conservative. It controls the probability of claiming statistically significant differences between detectable warnings where no differences actually exist, however, this method may risk obscuring some interesting, and potentially real practical differences observed in this study. Therefore, in addition to reporting statistically significant differences in the conservative manner described above, we have also reported the direction of pairwise differences which would have been considered statistically significant if the two detectable warnings had been tested in isolation, rather than as part of a set of multiple comparisons. Thus, for this second less conservative statistical decision criterion we set a criterion of α = .05 for each pairwise comparison.
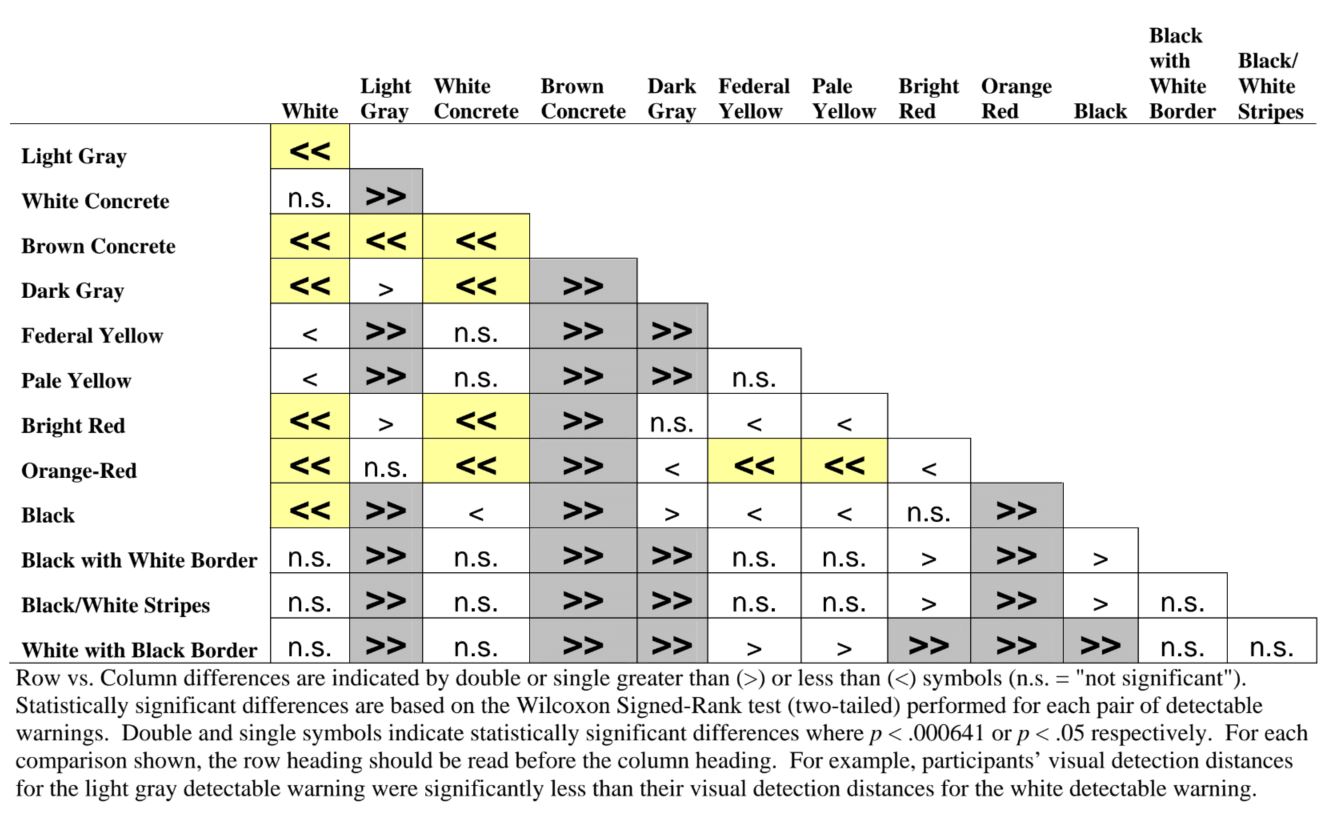
The results of the analyses are summarized in Table 6 through Table 9. Each of these tables corresponds with one of the four sidewalk types tested. The row and column headings refer to the detectable warning colors tested. The results of the pairwise comparison between detectable warnings listed in rows and those listed in columns are shown at the intersection of the appropriate row and column. The double “greater than” symbol (>>) indicates that the detectable warning color heading the row was seen from a significantly greater distance than the detectable warning color heading the column based on the conservative criterion where (p < .000641). The single “greater than” symbol (>) indicates that the detectable warning color heading the row was seen from a significantly greater distance than the detectable warning color heading the column based on the less conservative criterion where (p < .05). Similarly, the double “less than” symbol (<<) and single “less than” symbol (<) indicate that the detectable warning color heading the row was seen from significantly less distance than the detectable warning color heading the column based on the two criteria described above. The notation “n.s.” indicates that observed differences in detection distance were not statistically significant (p > = .05). For example, on the brick sidewalk the three black -and -white patterned detectable warnings were not significantly different from each other in terms of detection distance. Note that none of the significant differences designated by a single “greater than” or single “less than” symbol is statistically significant by the more conservative criterion.
The interaction between detectable warning color and sidewalk color is apparent from comparing the pattern of results across the four sidewalk types (Table 6 through Table 9). There are several cases where one detectable warning color may be seen from a greater distance than a second detectable warning color on a particular sidewalk type, but for a different sidewalk type, the second detectable warning color may be seen from a greater distance than the first. For example, the federal yellow detectable warning is seen from significantly greater distances than the dark gray detectable warning on all sidewalk types except for the white sidewalk, where the dark gray is seen from significantly greater distances than the federal yellow.
Table 6. Brick Sidewalk: Significant Differences in Visual Detection Distance for Detectable Warnings
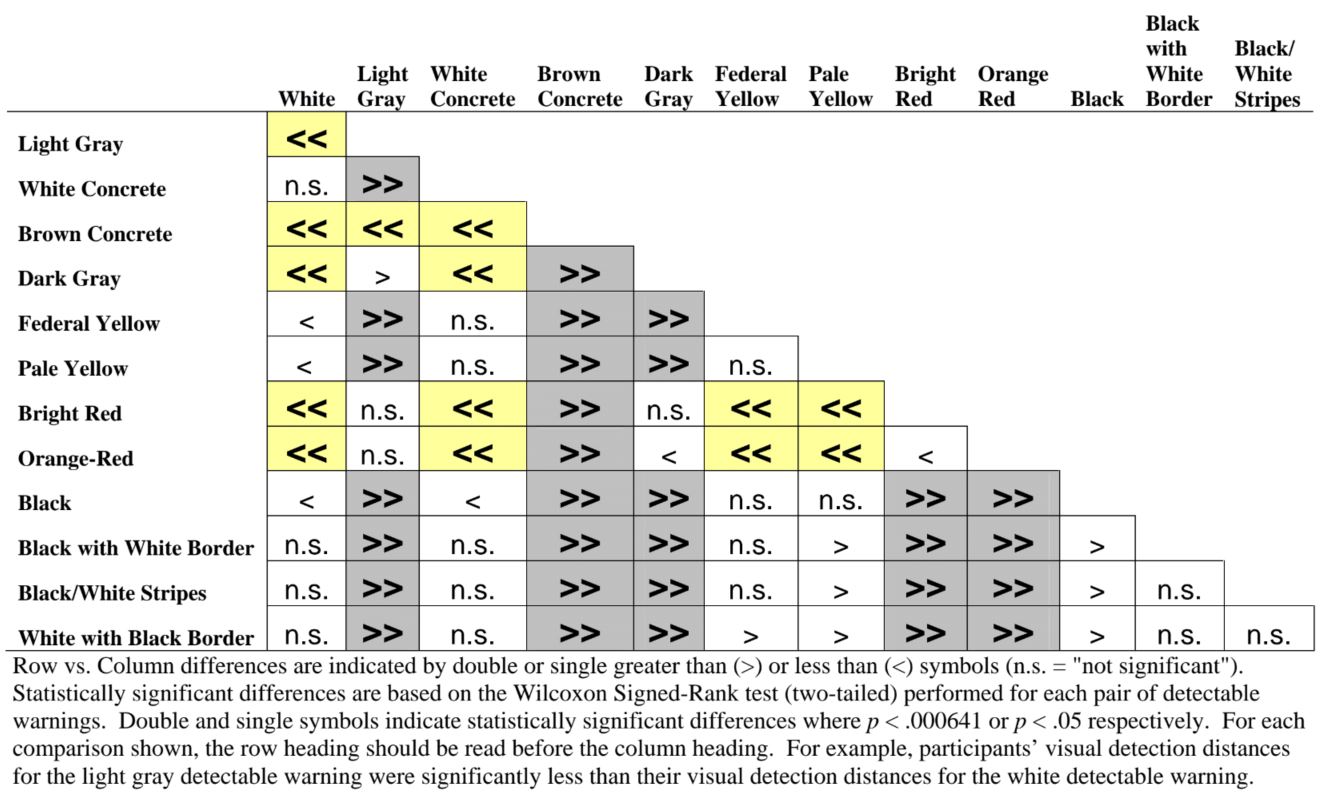
Table 7. Asphalt Sidewalk: Significant Differences in Visual Detection Distance for Detectable Warnings
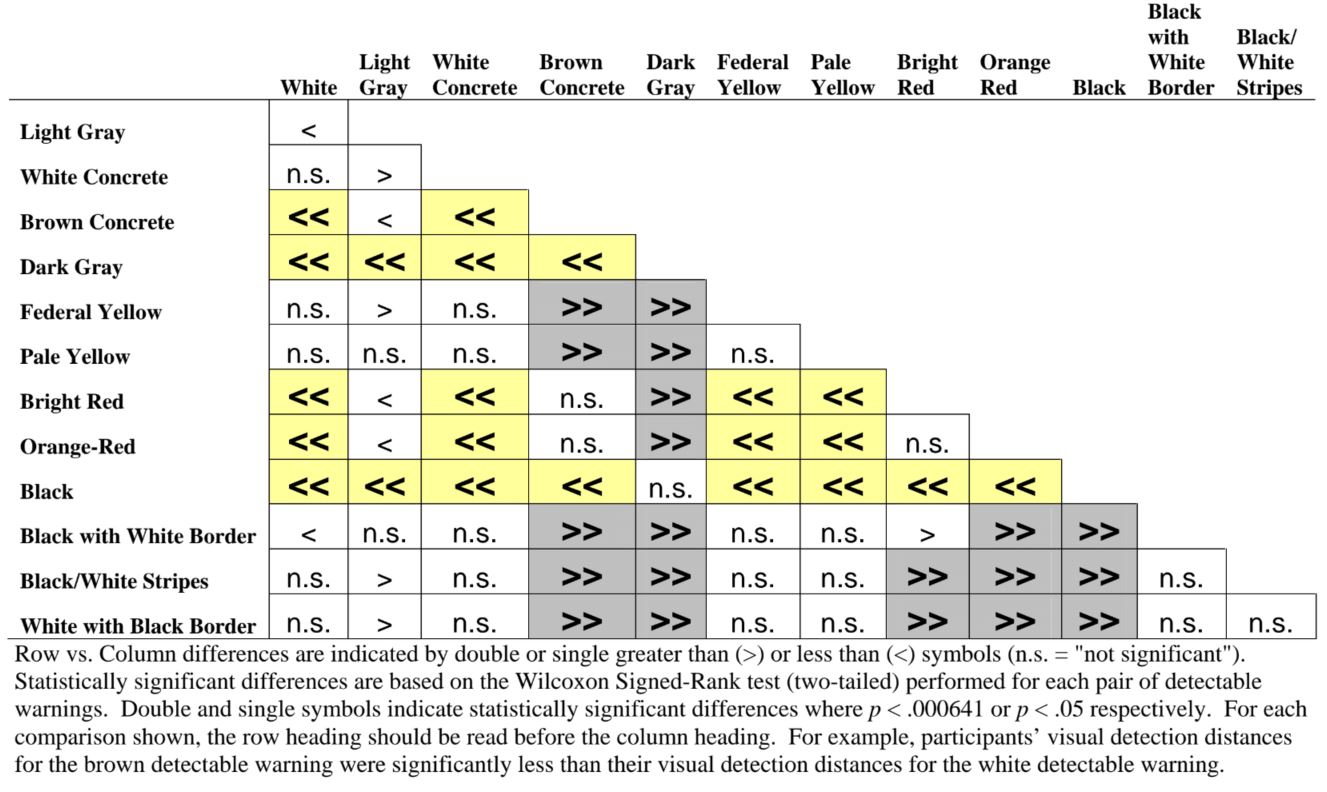
Table 8. White Concrete Sidewalk: Significant Differences in Visual Detection Distance for Detectable Warnings
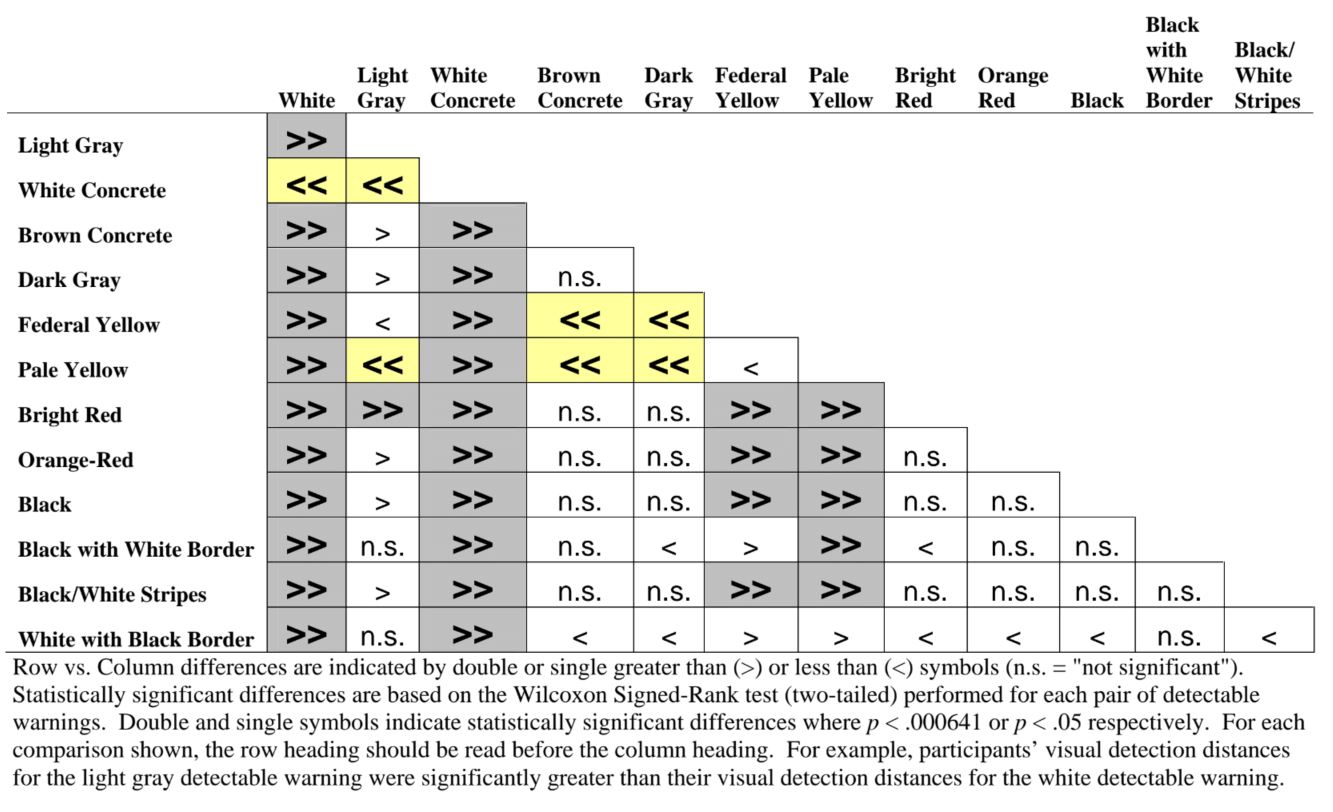
Table 9. Brown Concrete Sidewalk: Significant Differences in Visual Detection Distance for Detectable Warnings
User Comments/Questions
Add Comment/Question