Visual Detection of Detectable Warning Materials by Pedestrians with Visual Impairments - Final Report
2.10 Other Factors that May Predict Visual Detection and High Conspicuity Ratings
The study team conducted several logistic regression analyses of the trial-by-trial data to determine whether lighting conditions may have influenced visual detection and conspicuity of detectable warnings. We examined the effects of cloud cover per session and illuminance per trial along with reflectance of the detectable warning, reflectance of the side walk, the effect of using a single-color versus a patterned detectable warning, and the effect of using an achromatic (black, white, gray) versus a colored (bright red, orange-red, federal yellow, pale yellow) detectable warning.
For these analyses, the brown detectable warning was grouped with the achromatic set. Also note that, for the analyses described below, the reflectance of the white part of the patterned detectable warnings was defined as the detectable warning reflectance. In other analyses (not shown here) we defined the reflectance of the black area of the two-color detectable warnings as the detectable warning reflectance. The coefficients for nearly all model parameters were similar no matter which area was used to define reflectance for the two-color detectable warnings. The only exceptions were the parameter estimates for the pattern versus no pattern variables in the 7.92 m (26 ft) detection model and in the conspicuity model described below. For these two models, the pattern versus no-pattern parameter estimates were sensitive to the way that the reflectance was defined for two-color detectable warnings. All other parameter estimates, including the parameter for detectable warning reflectance, were not sensitive to the area (white or black) used to define reflectance of two-color detectable warnings.
Three similar models were used to predict probability of seeing the detectable warning at 2.44 m (8 ft), the probability of seeing the detectable warning at 7.92 m (26 ft), and the probability of obtaining a high conspicuity rating (4 or 5). The data for these analyses were the outcomes of every trial on which a detectable warning was presented. Thus, the number of data points to be fit by each of the three logistic regression models was: 50 (participants) x 13 (detectable warnings) x 4 (sidewalks) = 2600. The logistic regression analyses were performed with SAS statistical software using the general linear model procedure (PROC GENMOD). The parameter estimation algorithm included an adjustment for repeated measures data clustered by participant.
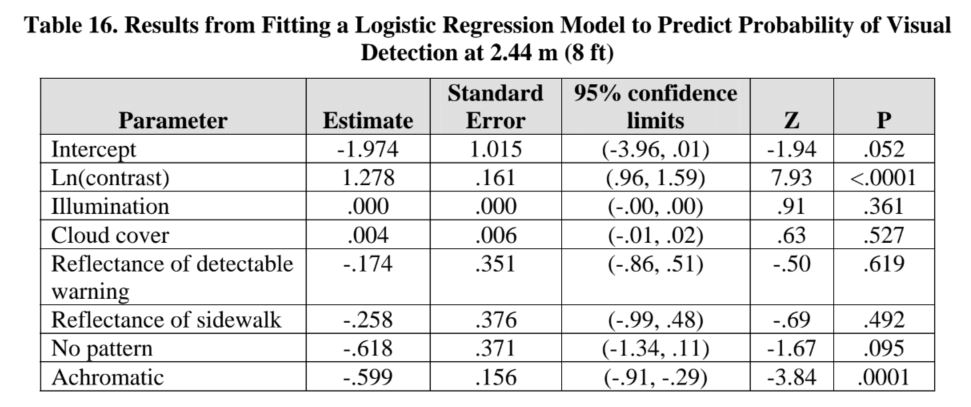
The parameter estimates of the model for predicting the probability that a detectable warning would be seen from 2.44 m (8 ft) are shown in Table 16. It is clear from the parameter estimates that neither cloud cover nor illuminance help to predict whether a detectable warning would be seen from 2.44 m (8 ft) in this study. The logarithm of contrast, Ln(Contrast), and the parameter for achromatic versus colored have estimates significantly different from zero. Greater contrast increases the probability of detection at 2.44 m (8 ft) and using an achromatic detectable warning decreases the probability of detection as compared to the red or yellow detectable warnings. The negative estimates for the two reflectance parameters and for the no-pattern parameter are not statistically significant.
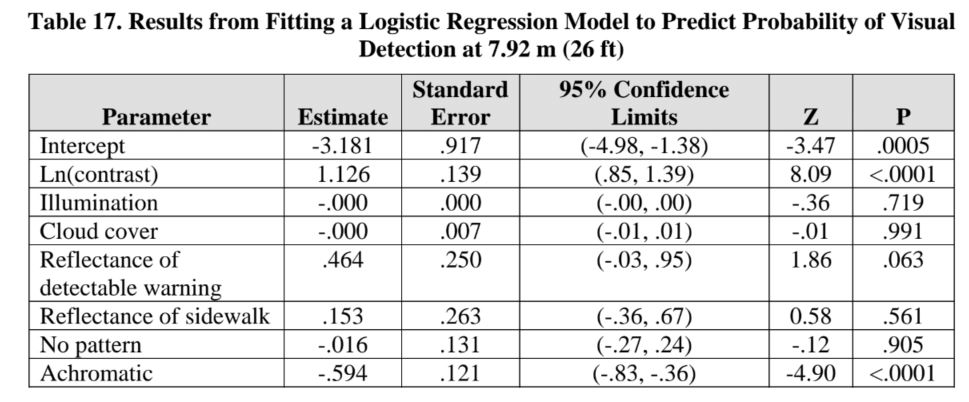
A similar regression model was used to predict the probability that a detectable warning would be seen from a distance of 7.92 m (26 ft). These results are shown in Table 17. In this model, illumination, cloud cover, and reflectance of the sidewalk do not help to predict whether the detectable warning will be seen. The statistically significant parameter estimate for the logarithm of contrast (p < .0001) indicates that higher contrast predicts a higher probability of visual detection at 7.92 m (26 ft). The achromatic parameter estimate is also statistically significant (p < .0001) indicating that having a colored (red or yellow) as opposed to an achromatic detectable warning increases the prob ability of detection from 7.92 m (26 ft). The positive estimate for reflectance of the detectable warning is not statistically significant.
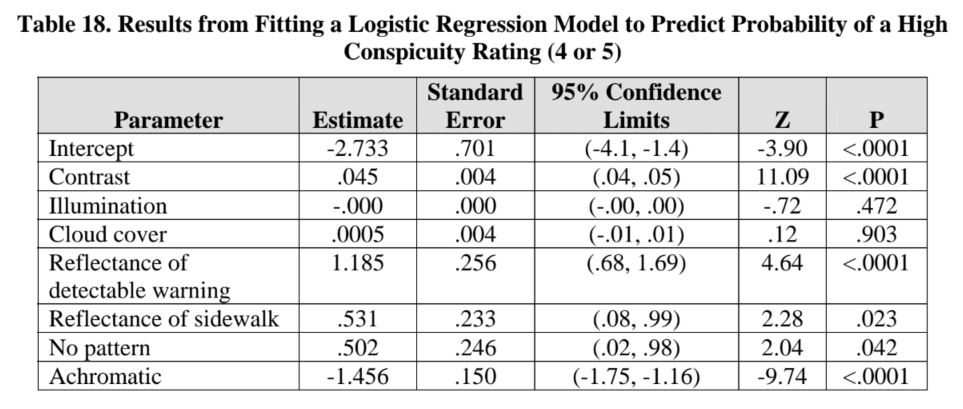
The results of a similar logistic regression model used to predict the probability of high conspicuity ratings are shown in Table 18. For this model, contrast was used rather than the natural logarithm of contrast. Consistent with the results of the two detection models described above, illumination and cloud cover do not help to predict conspicuity. However, several of the other parameter estimates are statistically significant.
The statistically significant model parameters include contrast (p < .0001), reflectance of the detectable warning (p < .0001) and no pattern (p < .05). According to the parameter estimates, higher contrast, higher reflectance of the detectable warning, higher reflectance of the sidewalk, and no pattern each increase the probability that the detectable warning will receive a high conspicuity rating. Having an achromatic detectable warning significantly decreases the probability of obtaining a high conspicuity rating as compared to the red and yellow detectable warnings (p < .0001). The effect of pattern versus no pattern in this model depends strongly on whether reflectance data for the white or for the black elements of the patterned detectable warnings were defined as detectable warning reflectance. All other parameter estimates were robust to this change.
User Comments/Questions
Add Comment/Question