
Standards and Anthropometry for Wheeled Mobility
REPORT PREPARED FOR:
U.S. ACCESS BOARD, WASHINGTON, DC
Authors: Edward Steinfeld, Jordana Maisel, Dave Feathers
July, 2005
Center for Inclusive Design and Environmental Access (IDEA)
School of Architecture and Planning
University at Buffalo
The State University of New York
Buffalo, NY 14214-3087
This report, the workshop’s papers and the presentations are available on the World Wide Web: http://www.ap.buffalo.edu/idea/Anthro/index.asp
Preface
This report was prepared at the request of the Board to provide guidance in the further development and revision of the ADA-ABA Guidelines and in providing technical assistance to designers and code developers. It builds on research completed as part of the Rehabilitation Engineering Research Center on Universal Design at Buffalo from 1999 – 2004.
The authors thank the researchers who responded to our requests by providing copies of their original reports. We hope that the data and observations in the report can be useful to anyone interested in the state of accessibility standards and research related to space requirements for wheeled mobility.
Disclaimer
This report and some of the anthropometry research described here was developed with funding from the U.S. Access Board (contract # TPD-02-C-0033). The bulk of the anthropometry research was completed with funding from the National Institute on Disability and Rehabilitation Research (NIDRR) through the Rehabilitation Engineering Research Center on Universal Design at Buffalo Project (grant #H133E99005). The contents do not necessarily represent the policy of the Access Board or NIDRR and readers should not assume any endorsement by the Federal government.


Contact Information
For further information, contact:
Edward Steinfeld, Director
Center for Inclusive Design and Environmental Access (IDEA Center)
School of Architecture and Planning
University at Buffalo
3435 Main Street, 378 Hayes Hall
Buffalo, NY 14214-3087
716.829.34585 ext. 329 (phone)
716.829.3758 (TTY)
This document is available free of charge from the IDEA Center website at: http://www.ap.buffalo.edu/idea/Anthro/index.asp
© Copyright, IDEA Center, 2005
Unlimited use of this document for educational and research purposes are permitted without written permission but altering the contents and distribution for sale is not allowed without prior written permission from the IDEA Center.
Executive Summary
Standards for accessible design include requirements based on the anthropometry of wheeled mobility users. Key requirements apply to clear floor area, reach limits, knee and toe clearances and maneuvering clearances. Advisory information is also often included on the characteristics of mobility devices. The U.S. standards are based on research completed in the late 1970’s. Advances in wheeled mobility technology and demographic changes that have occurred since that time suggest that the U.S. standards may be out of date. Since that time, research on the anthropometry of wheeled mobility users has been conducted in Australia, the United Kingdom and Canada. All those countries have revised or are revising their standards based on that research. The IDEA Center has been collecting data on wheeled mobility users for five years and data collection will continue at least through 2006. Enough data has been collected to start a dialogue on the significance of the findings.
The research in the U.S. and the three other countries were reviewed and compared to identify needs for improving standards. Many differences were discovered in both the standards and research studies. Although research results differ, trends in the data support making many important revisions to the U.S. standards to address the reality of contemporary wheeled mobility use. But, since research methods differ from study to study, there is a need for a close analysis to understand the findings and apply them appropriately. Most of the studies were not well documented and raise many questions about the results. The IDEA Center study is well documented and provides a flexible data set to complete many different types of analyses, not all of which have been included in the present report. The comparative analyses developed for this report provide a framework for the future comparison of research findings and standards and offer a foundation for improving the utilization of research for standards development.
The analysis highlighted the importance of integrating research with standards development, organizing international research collaborations and developing international standards. Previous and ongoing research at the IDEA Center supported by the Access Board provides a foundation for all three activities.
1.0 Background
The standards used to ensure accessibility for people who use wheeled mobility devices like wheelchairs and scooters are based on research in anthropometry, the measurement of body sizes and physical abilities. The anthropometric data on wheeled mobility users that underlies the technical requirements of the ICC/ANSI A117.1 (1998) Accessible and Usable Buildings and Facilities (ICC/ANSI) and the ADA Accessibility Guidelines (ADAAG) were generated from research completed from 1974 -1978 using a research sample that included about 60 individuals who used wheelchairs (see Steinfeld, et al., 1979).
In 25 years, many changes have occurred in the stature of the U.S. population, the characteristics of people who use wheeled mobility devices and the characteristics of equipment that they use. Yet, the technical requirements have not changed. In fact, until recently, a newer anthropometric data set on wheeled mobility users in the U.S. was not available. In response to this lack of current information, the IDEA Center has been developing a comprehensive data set with a high level of accuracy (Steinfeld, Feathers and Paquet, 2005; Feathers, Paquet and Drury, 2004; Paquet and Feathers, 2004). Although data collection is ongoing, we have now achieved a sample size and breadth that we believe is sufficient to start a dialogue about the needs for revision to current standards.
Comparisons of international standards and research are useful to validate methods and confirm results. They are also useful to identify best practices and differences related to cultural factors. In this report, we present a comparative analysis of research and standards on wheeled mobility in the U.S., the U.K., Australia and Canada. The analysis was limited to wheeled mobility device dimensions, minimum clear floor areas, space requirements for maneuvering, knee and toe clearances and reach limits.
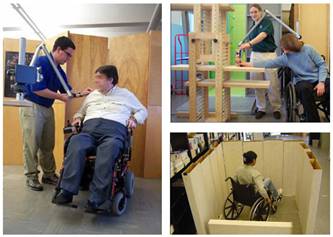
This report compares the national standards from these three countries and the U.S. It also compares the research findings from the various studies, including the current work at the IDEA Center, to the standards. Section 2.0 describes the methodology we used to make these comparisons. Section 3.0 includes a comparison of the research studies’ methodologies. Section 4.0 provides a graphic comparison of the standards and research studies and a discussion of the findings and recommendations. Section 5.0 provides a conclusion. The Appendix includes details of the research methodologies, photographs illustrating issues in the report, a summary table of the IDEA Center research results and references.
2.0 Methodology
We reviewed ICC/ANSI A117.1 (1998) Accessible and Usable Buildings and Facilities, which serves as the model for the technical requirements in the federal guidelines in the U.S., the Americans with Disabilities Act Accessibility Guidelines (ADAAG) and its eventual replacement, the Americans with Disabilities Act – Architectural Barriers Act Guidelines (ADA-ABA). For the United Kingdom (U.K.), we reviewed BS 8300:2001 Design of Buildings and Their Approaches to Meet the Needs of Disabled People – Code of Practice. For Canada (CA), we reviewed B651-04 Accessible Design for the Built Environment. For Australia (AUS), we reviewed AS 1428.2 – 1992 Design for Access and Mobility Part 2: Enhanced and Additional Requirements – Buildings and Facilities.
Since the findings of anthropometric research are often voluminous, journal articles and book chapters do not usually include a full documentation. Thus, we obtained the original research reports from Ringaert, et al. (2001) from Canada, Stait et al. (2000) from the United Kingdom, Bails (1983) and Seeger et al., (1994) from Australia. The research underlying BS8300:2001 in the U.K. was summarized in an Annex to the standard itself but we were unable to obtain a more comprehensive report that described the details of the methodology.
We first compared the relevant criteria in all the U.S. standards to identify the common underlying anthropometric variables. Our analysis then focused only on these variables. The common variables were defined graphically in illustrations and with abbreviations, e.g. Knee Clearance Height (KCH), Knee Clearance Depth – Upper (KCDU), Knee Clearance Depth – Lower (KCDL) and Extended Depth (ED). In many cases, variables underlying the U.S. standards are not included in other standards. Thus, in our comparisons, we simply omitted values for those variables. We did not, however, report variables from other standards that are not included in the U.S. standards.
The standards did not use the same variables (or parameters), terminology or measurement conventions. For example, the U.S. standards include both Imperial and “soft” conversions to Metric units, but all the other standards are in Metric units only; there are at least three different terms used for a “wheelchair turning space,” and the U.K. standards report reach ranges for both a “maximum” and “minimum” reach while the U.S. standards have only one range delimited by a minimum and a maximum value. These differences present several problems to researchers. For example, the definition of a “wheelchair turning space” determines the protocol used to study the clearance needed. Different results are obtained if that space is bounded or unbounded or whether the protocol calls for a smooth continuous turn or includes a series of smaller movements or allows either. Since the standards do not define variables clearly, researchers have made their own interpretations and developed different protocols to study the same variables. Thus, to make comparisons, we standardized all the values from standards and research as much as possible based on a common definition of variables and measurement conventions. We reported the U.S. values in both Imperial and Metric units but did not convert the other countries’ values to Imperial nor did we do “hard” conversions of the U.S. Imperial values.
We then reviewed the research completed in each country since 1980; the year after the research of Steinfeld et al. (1979) was published. In many cases, this required some interpretation because the research studies did not always use the same terms or definitions as the standards in the respective country. Different approaches were also used to report findings. Some results were reported in percentiles. Other results were reported as minimum or maximum values. Still others were reported as the “percentage of subjects accommodated” – those who could perform a task at a certain criterion level. We devised a graphic method to compare the results of the research studies to each other and to the standards. Most of the studies reported at least a minimum or maximum value and a mean value for each variable studied. These three points were displayed on a graph and coded by study. Where available, percentile data was added to the graph in between the minimum and maximum values and the mean to provide more detail. All the values for each study that represented a distribution were connected by line segments.
Some studies focused on a very limited set of variables. Because of the methodology used in the IDEA Center anthropometry research, however, we were able to compute results for all the variables and all relevant statistics. Thus our results appear in all the analyses and can be compared to all the standards.
3.0 Comparison of Research Methodologies
There were many differences in the research studies, including the documentation provided, samples recruited, methods used and data reporting formats. Table 1 provides a summary of the main differences. The sub-sample studied for any sub study could differ greatly from the total sample size and was not always documented. (Refer to Appendix 1 for more detailed descriptions of the methods used in each study.)
Table 1. Overview of Research Studies
|
Study |
Sample |
Methods |
Reliability |
Scope |
|
Bails, 1983, AUS
|
Total unknown, manual and power chairs, from institutions
|
2-D, manual
|
No reliability or validity study |
Body and device size, reaching, maneuvering, door use |
|
Seeger, Costi and Hartridge, 1994, AUS |
240, all devices. 75% from institutions |
2-D, manual measurements |
No reliability or validity study.
|
Body and device size |
|
Department of the Environment, Transport and the Regions (DETR): Stait, Stone and Savill, 2000, U.K.
|
745, all devices, attendees at Mobility Roadshow |
2-D, photography with digital measurements |
Reliability study |
Body and device size |
|
BS8300: 2001 Appendix (research commissioned by the DETR), U.K. |
164, all devices, but only 91 for space allowances, source unknown
|
Not reported. |
Unknown |
Body and device size, knee and toe clearances, reaching, maneuvering, door use |
|
Universal Design Institute (UDI): Ringaert, Rapson, Qui, Cooper and Shwedyk, 2001, CA
|
50, power chair and scooter users, diverse sources |
2-D, manual measurements, detailed interview |
No reliability or validity study |
Body and device size, reaching, maneuvering |
|
IDEA Center: Steinfeld, Paquet and Feathers, 2005, U.S.
|
275, all devices, diverse sources |
3-D, digital probe, video, detailed interview |
Reliability and validity study |
Body and device size, reaching, maneuvering, door use |
Bails (1983) recruited participants from attendees at disability support centers and institutions. Eligible participants were between 18 and 60 years of age and used a manual or powered wheelchair. Scooter users were not included in the study. The total sample size is not known. The research focused primarily on testing of full-size simulations of elements found in the built environment, such as doorways, environmental controls, furniture and fixtures that were configured to meet the Australian standards at the time. Many of the findings, therefore, could not be used to make generalizations or to determine the ideal spaces needed for access.
Seeger et al. (1994) studied only device size. About seventy-three percent 73% of the 240 individuals in the sample lived in nursing homes and other institutions. Forty-five percent were over 65. Eleven percent used power chairs and two percent used scooters. Both unoccupied and occupied dimensions of device width and length were measured as well as a set of other basic dimensions. Measurements were taken manually using conventional measuring tools including a tape measure, steel square and spirit level.
The DETR study (Stait et al., 2000) was limited to measurement of device size and weight. Participants in the DETR study were recruited at an exposition of equipment for people who use wheeled mobility devices for traveling around the community. Of the 745 participants whose data was acceptable, 59% used self-propelled manual chairs, 9% used attendant powered chairs, 25% used power chairs and 9% used scooters. Nine percent of the sample were judged to be 16 years of age or younger. Two cameras were used to take photographs of the participants from top and side after they wheeled into position on a scale. A checkerboard pattern on the floor and wall provided references to take measurements off the photographs. Parallax was corrected during the calculation of the dimensions. Prior to data collection the reliability of the method was verified by comparing dimensions taken directly from individuals with those calculated from photographs. Device dimensions were defined clearly. Although a wide variety of accessories were observed on the devices, they were not measured as part of the width calculation.
The BS8300:2001 research covered knee and toe clearances, reaching abilities of wheeled mobility users, clear floor area space requirements and maneuvering clearances. A total of 164 individuals were included in the sample but only 90 participated in the research on space allowances. Due to the lack of a full research report, it is not clear how the measurements were collected and, in many cases, the landmarks used to define them. From the information available, it appears that some scooters and attendant propelled chairs were included in the sample but it is not clear whether these individuals were included in the device, body or reach measurements.
The UDI study (Ringaert et al., 2001) was recruited from disability and senior organizations in Winnipeg by written invitation. Of the 50 participants, 35 used power chairs and 15 used scooters. The cause of disability for individuals in the sample included a wide range of conditions. Device size, maneuvering space needed and reaching ability were measured. All dimensions were taken to the extremes of the equipment including any object attached to the device like a ventilator. However, the actual landmarks on the devices are not well documented. Measurements were made with rulers and tape measures but no information is given on the accuracy and reliability of these techniques. Maneuvering trials were recorded using overhead video cameras while participants completed standardized movements in simulated environments built with plywood floors and wood framed dividers. Measurements were later taken off the videotapes although the method used to do this and the reliability of the technique are not described. An observer rating was used to determine successful trials.
The IDEA study (Steinfeld, Paquet, Feathers, 2004; 2005; Feathers, Paquet, Steinfeld, 2004; Paquet and Feathers, 2004) included static anthropometry of occupied wheeled mobility devices, reach measurements and measurements of maneuvering clearances. At the date of the analyses conducted for this report, 275 participants with a wide range of chronic conditions had been recruited through outreach efforts with several organizations in Western New York and mass media. Fifty-three percent of the sample was male and 47% female. The mean age of the sample was 51.5 with a range of 18-94 years of age. Fifty-five percent used manual wheelchairs, 36% used power wheelchairs and 9% used scooters. Three-dimensional locations of body and wheelchair landmarks were collected with an electromechanical probe (Feathers, Paquet and Steinfeld, 2004). A reliability study was completed before data collection (Feathers, Paquet and Drury, 2004). The reach protocol utilized a standardized procedure in which participants reached to a target (free reach) and also while lifting .46, 1.4 and 2.3 kg (0, 1, 3 and 5 lb.) weights. Reach limits were digitized with the mechanical probe, and, from the data, a reach envelope for each individual was constructed. Maneuvering clearances were measured while participants conducted standardized maneuvers inside a set of lightweight movable walls. The walls were gradually moved further apart until the maneuver could be completed without the participants moving the walls. Clearances were pre-measured on the floor of the test site using tape and marker and the locations of walls were recorded after each trial.
The studies utilized widely different methods to recruit participants. The DETR study has a large sample size but the participants were all self-selected in their interest and ability to attend the Mobility Roadshow. Thus the sample is likely to be more mobile than the wheeled mobility population as a whole and their choice of chairs may reflect that. A high rate of unusable data due to problems with photography may have introduced some sampling bias as well. The Seeger and Bails samples were drawn primarily from institutional settings, which would definitely introduce bias in the types of devices used and maneuvering abilities. Both the IDEA and UDI studies recruited a diverse sample and provided transportation to the research site ensuring that low mobility would not be a barrier to participation. However, in both cases, the samples could not be considered representative of the entire population of wheeled mobility users in their respective countries. Users of powered chairs, are definitely overrepresented in the IDEA sample. The UDI study did not include manual wheelchair users at all. It should be noted that overrepresentation of one group or another is not necessarily bad because it can help to address lack of attention to specific populations.
The UDI and Bails studies had very small samples. Bails, in particular, had sub samples for some of his protocols that included as few as five individuals. In the U.S. we calculate that the bare minimum size of a sample that would represent the U.S. population of wheeled mobility users would be 500. Although the current size of the IDEA Center sample (275) is the largest assembled in the U.S. and is almost five times larger than the study on which ANSI A117.1 (1980) was based, it still cannot be considered a representative sample on size alone. It is important to note that, in this type of research, total sample size is not as important as inclusion of a diverse group of users, enough people in each category to cover the range of abilities and sizes and spending enough time with individuals to obtain a comprehensive data set. Powered device users were over-sampled on purpose in the IDEA sample because the technology has changed so much since 1979 and the users of powered devices are more seriously impaired.
A limitation of both the IDEA sample and the UDI sample is that they are drawn entirely from cold weather cities. This may introduce some bias toward larger and more durable equipment. Data was collected all year round in the IDEA study so that season should not have introduced a bias in recruitment, however, the UDI study was conducted only in winter which may have influenced participation. The IDEA sample is growing more representative as time goes on as we target new recruitment to underrepresented groups. We are planning on collecting data in two additional cities, one in a hot climate and one in a city with hilly terrain. We have made a concerted effort to promote the use of our methods so that other researchers can contribute data to merge into our existing database.
The methods Bails and the BS8300 used are not reported in detail. Without the details, it is difficult to evaluate them. The reliability of measurements taken in the UDI and Seeger research is not known. It appears that UDI did not address issues of distortion caused by camera lenses in their analysis of some maneuvering trials. Both UDI and Seeger used rulers and tape measures rather than more accurate anthropometric instruments designed for such a purpose. In the UDI research, the lack of a reliability study to determine the level of agreement among researchers to rate the level of “accessibility” observed is a key limitation because those ratings were used to determine success in managing specific space clearances. The IDEA and DETR studies are very well documented and reliability studies were completed in the preparation phase.
UDI’s research was focused on validating the B651-95, precursor to the B651-04. All the maneuvering trials started with the clearances in the standard but the results of fitting trials can be influenced by the starting position. In contrast, the IDEA Center research started with the smallest possible clearance. We discovered that many of our participants could manage maneuvers in much smaller spaces than the minimum clearances of the ADAAG.
The reach protocol used by the IDEA Center did not collect data on the lowest reach possible because of safety concerns. Lowest reach was obtained for free lateral reach without bending but this cannot be used to represent the lowest forward or extended lateral reach. It is not known how the UDI researchers addressed the safety concerns related to low reach but it is clear that differences in human subject approval procedures certainly can influence the methodologies used.
DETR, UDI, the BS8300 researchers and IDEA provided results in percentile form. This is very valuable for making decisions about criterion values. Ideally, standard deviations and median values should be provided at a minimum so that all percentiles can be calculated. BS8300 failed to include median values so percentiles other than what they reported cannot be computed. UDI, Bails and the BS8300 researchers did not provide any information on whether outliers were identified and eliminated from the data reported.
Section 4.0 Findings
4.1 Wheeled Mobility Device Dimensions
Figure 1 and Table 2 show the standards from the four countries and the variables they include on wheeled mobility device sizes. Selected research findings are shown in Figures 2-8.
Figure 1
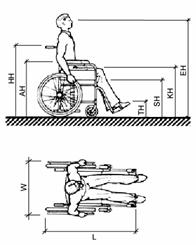
Table 2
|
|
U.S.* |
Australia |
Canada* |
U.K.* |
|
Unoccupied Width |
660 |
X |
660 |
X |
|
Unoccupied Length |
1065 |
X |
X |
X |
|
Handle Height (HH) |
915 |
X |
920 |
X |
|
Armrest Height (AH) |
760 |
X |
760 |
x |
|
Seat Height (SH) |
485 |
X |
480 |
480 |
|
Folded Wheelchair Width (F) |
X |
X |
300 |
X |
|
Occupied Width (W) |
X |
X |
X |
X |
|
Occupied Length (L) |
1200 |
X |
1200 |
X |
|
Eye Height (EH) |
1090-1295 |
1250 |
1100-1300 |
X |
|
Knee (Lap) Height (KH) |
685 |
X |
675 |
X |
|
Toe Height (TH) |
205 |
X |
200 |
X |
|
Toe Extension beyond Footrest (TE) |
150 |
X |
X |
X |
** Advisory information
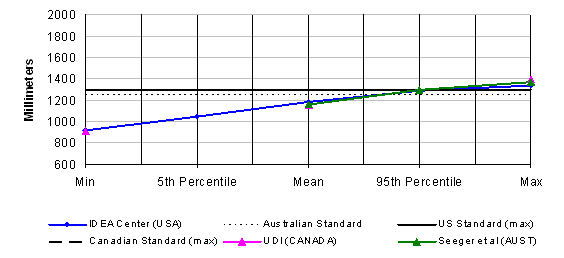
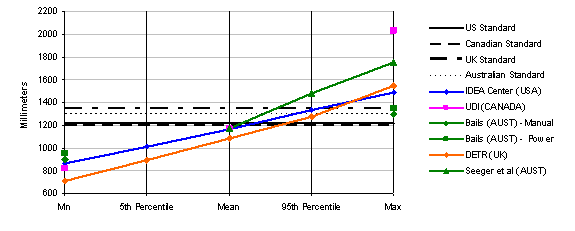
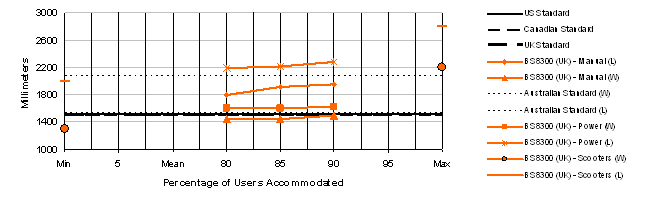
Figure 2. Unoccupied Device Width
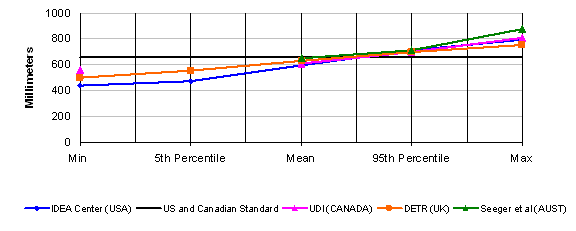
Figure 3. Unoccupied Device Length
The research data shows that the sizes of devices vary considerably from the values in the standards. The sizes described in the standards are close to the mean values found in the research studies but this is certainly not sufficient to accommodate a large enough proportion of wheeled mobility users. For example, the IDEA data for mean unoccupied length is identical to the standard. But, the widest device measured was about 150 mm wider and the longest more than 200 mm longer.
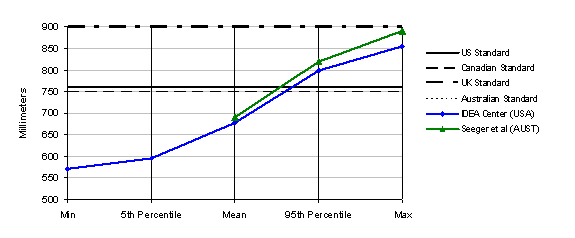
The data also indicates that armrest height and handle height vary considerably from the values included in standards but only for the extremes of the population (see figures 4-6). The means for these two variables were very close to the value in the standard in all three studies that measured it. In contrast, the mean seat height was above the value in the standard for the two studies that measured it and the difference between the value in the standards and the results is considerably larger than for armrest height and handle height.
Figures 4-5. Armrest Height
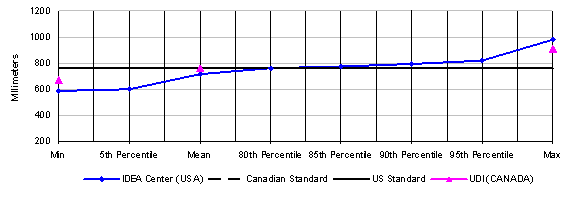
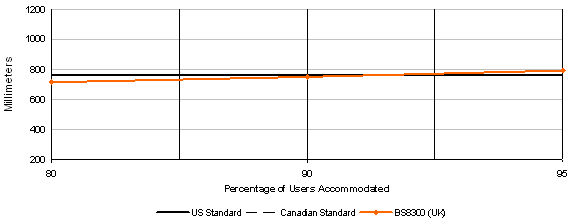
Figure 6. Handle Height
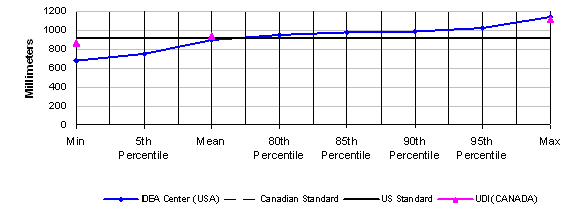
* One outlier removed due to data translation errors in software
The two studies that measured seat height discovered that the values in the current standards are below the means of the research results. This is probably due to the increased use of positioning systems, thick cushions and the availability of a wider range of wheel sizes since the 1970s but it can also be due to differences in measurement methods. The height of the seat can be measured at the edge and at the middle, under the cushion, or on top of the cushion. Thus, specifying exactly how it is measured is important for comparing results. In the IDEA research, the height of a seat plane was defined and also measured at point at the rear of an individual’s buttocks using an extension of the electromechanical probe that we slipped down behind an individual’s back. The results would clearly be different compared to other measurements, particularly if the measurement was taken at the leading or trailing edge of the seat below the cushion.
Figure 7. Seat Height
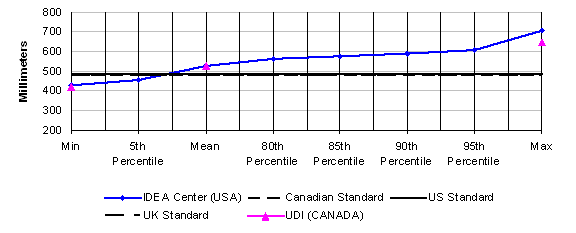
* Two outliers removed from IDEA Center data due to translation problems in software
For eye height, the findings are extremely consistent. They show that the means are well below the values in the standards. The maximum values for the UDI, Seeger and IDEA studies are just slightly above the standard value. These results may be related to the increased use of thick cushions since the 1970s and elevated seating systems that position smaller individuals at a more functional height. The earlier research may not have included people of very small stature.
Figure 8. Eye Height
When the ANSI A117.1 (1980) Standard was developed, there was a true “standard adult manual wheelchair” but that is not the case today. Wheeled mobility technology has changed significantly and it is likely to continue changing. Many new types of devices have appeared on the market, both larger and smaller than the “standard adult wheelchair” of the 1970s and devices are fitted and customized more often to suit the needs of an individual. In the U.S., as the average weight of the population has increased, wheelchair manufacturers started producing wheelchairs with larger capacity and many more seat widths.
To provide realistic guidance for designers, information on wheeled mobility dimensions should include occupied sizes as well as device size and also include accessories as they are used in everyday life. Occupied device sizes are clearly preferable and more useful for designers than unoccupied sizes but it is not uniformly provided in the standards. For example, in the U.S. standards, only occupied length is shown whereas the width is based on the device alone. Unoccupied device size is important also because it defines the absolute bottom line for small clearances, e.g. knee clearances or closet openings. It is important to note that although data on device sizes is available from manufacturers, it does not include actual dimensions as set up for individuals nor does it provide data on added equipment like seating systems, cushions, control boxes, ventilators, carrying baskets and other accessories. In this regard, not all the studies measured unoccupied dimensions or included accessories as part of their dimensions and measurements (e.g. Stait et al., 2000).
Data on occupied device sizes is most valuable for establishing clear floor area requirements. Thus, if occupied sizes are included in standards, it is important that they be consistent with the specified clear floor areas. Data on armrest, seat, and eye heights can be very useful for designers but it also can be misleading if not enough detail is provided. Design for extremes of a range may help only a very few people, yet design for the mean or median may exclude those in the extremes which may be very useful in the design of facilities that large numbers of wheeled mobility users may inhabit on a daily basis. If this data is reported in the standards, it should include enough information and guidance for designers to make informed decisions about how it is to be used.
The inclusion of handle height in the standards is of questionable value. We could not identify any need for this data. On the other hand, it would be useful to have information on accessory dimensions like control boxes and ventilators.
The illustrations used to depict wheeled mobility devices in the U.S. Australian and U.K. Standards are manual wheelchairs. The Canadian standard, however, includes illustrations and data on scooters and power chairs. This information can be very valuable to designers who are seeking to ensure full accessibility beyond minimum required levels. Additional illustrations are needed to convey the diversity in the devices and their occupants. Designers could also benefit from more information on device size to plan spaces like storage areas for wheelchairs at transportation terminals or the design of counter edges in relationship to armrests. For example, the U.K. standard includes data on the width of folded wheelchairs. Accurate and reliable data on device size may be more appropriate to provide in a reference manual with more detailed information and extensive illustrations of different equipment types in use.
Recommendations
- Provide illustrations of seven types of devices in an advisory section: attendant propelled manual chairs, old style manual chairs, lightweight manual chairs, power assisted chairs, power chairs with rear wheel drive, power chairs with mid wheel drive, scooters.
- Provide data on key characteristics of wheelchairs as used by individuals:
- Occupied width
- Occupied length
- Knee height
- Seat height
- Toe height
- Armrest height
- Eye height
- Head height (currently not included in the Guidelines but useful for vehicle design and also locations where lifts are installed that may not have sufficient headroom)
- Weight (currently not included in the Guidelines but critical for designing lift capacity and structural loads for ramps)
- For advisory purposes, provide statistical information on each variable from which percentile data can be calculated:
- Min-max values
- Standard deviation
- Median
- Update criteria that are based on the above dimensions. This includes but is not limited to clear floor areas, shower seat height, toilet height.
4.2 Clear Floor Area
Figure 9 and Table 3 show the standards from the four countries related to clear floor area. Figures 10-13 show the key findings from the research.
Figure 9.
Table 3.
|
|
U.S. |
Australia |
Canada |
U.K. |
|
Width (W) |
760 |
800 |
750 |
900 |
|
Length (L) |
1200 |
1300 |
1200 |
1350 |
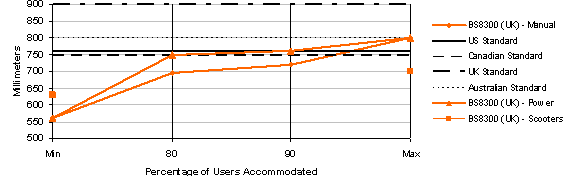
Figures 10-11. Clear Floor Area (Occupied) Width for All Devices
Figures 12-13. Clear Floor Area (Occupied) Length for All Devices
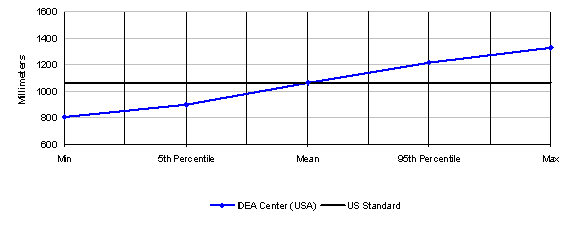
Recent revisions to standards in Australia and the U.K. have increased the clear floor area dimensions in both width and length. The U.K. requirements, in particular, are much larger requirements than those in the U.S. and Canada. Research results support larger dimensions. All the studies found that wheeled mobility devices vary from the standards significantly in both width and length. While there are many occupied devices that are narrower and shorter than the values in the standards, the largest devices are generally above the minimum width and length in the standards.
The findings on clear floor area are based on the findings on occupied width and length, where provided. The DETR study did not collect data on occupied width (see previous section). The authors argued that individuals can bring their arms and legs inboard when entering transportation vehicles and passing through doorways. We found, however, that many individuals cannot bring their body parts “inboard”.
The IDEA Center research results for occupied width were smaller than those of the Seeger study. No study reported widths larger than 850 mm. The BS8300 research did not report occupied widths larger than 800 mm but the BS8300 standard, as we interpret it, requires 100 mm more than that for the clear floor area width (900mm). The BS8300 standard’s developers may have added 100mm to provide additional maneuvering room at clear floor areas.
In all the studies that reported data by device type and percentile, the occupied widths of the smallest and largest power chairs were generally the same as the occupied widths of the manual chairs. Occupied widths of scooters were narrower with the exception of the IDEA Center findings. This can be attributed to the presence, in the IDEA scooter sub-sample, of some very large individuals and some who keep their legs outside the edge of the chair when in a resting position. Other studies may not have measured people in “resting” postures. The larger sizes of Americans may also contribute to this difference.
The largest occupied lengths all exceed the current standards, even the U.K. standard of 1350mm. However, the results show that the 95th percentile values are between 1200 and 1350 mm. The difference between the maximum length in the UDI and Seeger studies and the others is so great that it is probably due to the presence of unusually large people and/or devices or measurement error. The maximum length (occupied) recorded in the UDI study, for example, was over 2000 mm (over 6 ft.- 8 in.)! In the case of Seeger et al.’s work, we know that most of the sample was recruited from institutions and many may have had extended foot rests or reclined backs on their chairs. No information is provided in the reports to assess whether individuals in either study could be considered outliers. For example, the other studies together included over 1200 individuals and no other study reported a device as long as 2000 mm. Such a large value is likely to have been a measurement error or a very unusual case such as a person who uses a small all terrain vehicle for mobility.
The research results clearly suggest that clear floor areas be increased to address the actual size of contemporary occupied devices. Although there are differences in the findings, they can be attributed to methods and reporting approaches.
Recommendations
- The clear floor area width should be increased in the U.S. standards. A width of 800 mm (31.5 in.) would accommodate the 95th percentile in the IDEA sample
- The clear floor area length should be increased in the U.S. Standards. A length of 1400 mm (55 in.) would accommodate the 95th percentile in the IDEA sample
4.3 Reach Ranges
Figures 14-15 and Table 4 show the standards from the four countries related to reach from a wheeled mobility device. Figures 16-19 show key findings from the research.
Figures 14-15. Forward and Lateral Reach
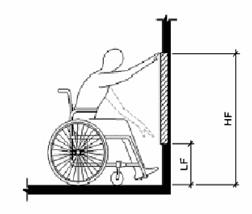
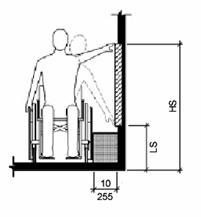
Table 4
|
|
U.S. |
Australia |
Canada |
UK |
|
Unobstructed |
|
|
|
|
|
High Forward Reach (HF) |
1220 |
1220 |
1220 |
x |
|
Low Forward Reach (LF) |
380 |
250 |
380 |
x |
|
High Side Reach (HS) |
1370 |
1350 |
1400 |
1060-1170 |
|
Low Side Reach (LS) |
380 |
230 |
230 |
630-665 |
|
Obstructed |
|
|
|
|
|
High Forward Reach |
1120 |
R.E. |
1100 |
1000-1150 |
|
Low Forward Reach |
x |
x |
x |
650 |
|
High Side Reach |
1220 |
1170 |
1200 |
x |
|
Low Side Reach |
x |
x |
x |
x |
*R.E. = Reach Envelope
The U.S., Canadian and Australian standards are similar, although the latter use a reach envelope to provide guidance for obstructed forward reach and both the Australian and the Canadian standards are less restrictive for low side reach. On the whole, the U.K. standards proscribe much more restrictive reach ranges although they do include different limits for different types of applications.
Figure 16. High Forward Reach
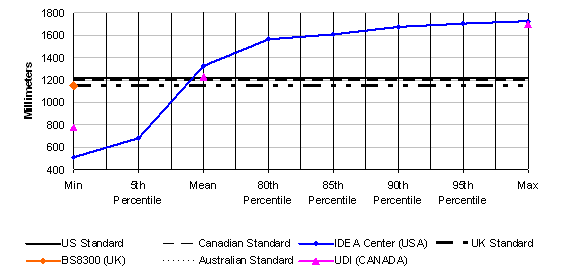
Figure 17. Low Forward Reach
* Three outliers removed from IDEA Center data due to data translation errors in software
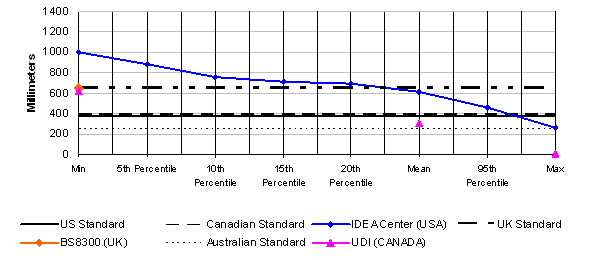
Figure 18. Upper Side Reach
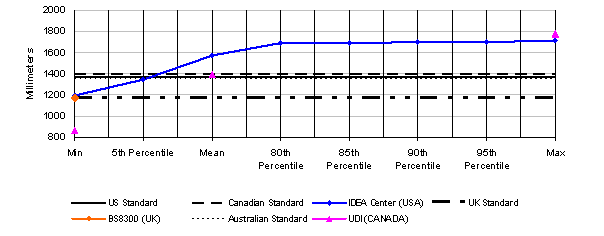
Figure 19. Low Side Reach
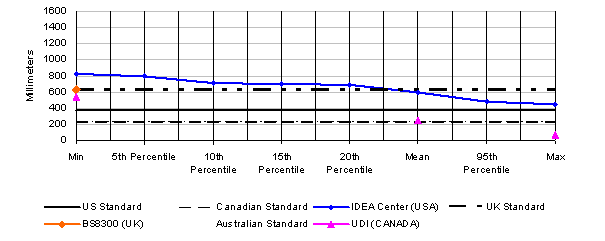
Note: 3 outliers removed from IDEA Center – Protocol data due to translation errors in software
For the IDEA results, the forward reach graph represents reach over the anterior most (forward) point of the wheelchair or body for trials with no weight lifted (as in Fig. 14-15). We do not know how forward reach was measured in the UDI study. In the BS8300 study, trials were conducted over a counter and it is not known whether the results reported represent highest reach for each person in general or over the anterior most point. It is also not clear who was excluded or included in the UDI and BS8300 results.
The 5th percentile values for high forward reach in both the IDEA and UDI studies are well below the current U.S., Australian and Canadian standard of 1220 mm (48 in.). The reason for the very low 5th percentile and minimum values in the IDEA study is that several individuals’ reach envelope only intersected the anterior most plane at the extended part of their reach envelope (near the bottom of the arch). They could reach higher but only behind the anterior most plane, e.g. if they had knee space in which to pull their device. This may be true of other studies as well but information is not available to understand what is meant by highest reach.
The UDI and IDEA results are remarkably similar given that there are so many ways that reach can be measured. The results indicate that there are some people at the lower tail end of the distributions who have very restrictive reaching ability. The minimum value for the BS8300 research (the only one reported) was close to the current standards. We believe that this is due to either a different measurement technique (highest reach regardless of whether it was behind the anterior most point) or exclusion of individuals in the sample who could not reach to the anterior most point.
High side reach results have a similar pattern although the BS8300 study results were lower than the standards of the other countries. The BS8300 and the UDI results for low side reach were within 100 mm (4 in.) of each other at the minimum end of the range. The participants in the IDEA sample with the most restricted reach ranges were not allowed to reach lower, however, due to the safety considerations imposed.
The reach results for the different studies demonstrate great differences, even though some consistent trends are evident. More information is needed to clarify exactly how the UDI and BS8300 reach studies were completed, how the data in each was analyzed, and who the people with extreme values were. The UDI data may include some outliers that need to be identified and eliminated. The BS8300 study may have excluded people whose reaching ability may be more restricted than those included by the UDI and IDEA center.
The reach results for the different studies demonstrate great differences even though some consistent findings emerged. More information is needed to clarify exactly how the UDI and BS8300 reach studies were completed and how the data in each was analyzed. More detailed information is needed about the people at the extremes in reaching in both studies. The UDI data may include some outliers that need to be identified and eliminated. The BS8300 study may have excluded people whose reaching ability may be more restricted than those included by the UDI and IDEA center. The IDEA Center results demonstrate that some individuals can only reach the anterior or lateral most plane at the extreme of their reach range. Additional analyses, removing individuals whose forward or side reach range is restricted in this way may result in more comparable findings.
Thus, standards should reflect the most functional reaching approach. Besides free reaching ability, there are additional exclusion criteria that could be imposed for the purpose of establishing standards, for example, the ability to lift an object or perform a grasping task. The IDEA Center studied the impact of grasping and lifting a weight during a task. The standards make no mention of the task so those results are not presented here. These data may perhaps be more relevant for developing standards since they are more realistic tasks. Our preliminary analyses of the weighted reach trial data indicate that many of the participants with marginal reaching abilities would be eliminated from an analysis of these trials because they could not perform the task at all (even with the aid of an assistive device called a “cuff” that eliminates the need to grasp the object). The remaining participants are likely to have more extensive reach envelopes and thus the low end of the range could actually be higher than with free reach simply due to exclusion of people with marginal reaching abilities. Our preliminary analysis also indicates that many participants could reach higher at a 45 degree angle than forward or to the side. Thus, this set of trials may provide information for changing the approach used in the standards. Individuals are likely to use the approach that is most functional for them, if there is enough room.
Currently the U.S., Canadian and Australian standards address reach over an obstruction in a very simplistic manner. They specify maximum and minimum heights but do not take into consideration the fact that the depth and height of the obstruction can vary with a corresponding impact on the reach envelope. Reaching over an obstruction was studied in the BS8300 study, and, the limits of obstructed reach can be derived from the IDEA data. But, since there are so many variables that have an effect on reach over obstructions, e.g. knee space depth, armrest height, depth of obstruction, height of obstruction, etc. it is not easy to devise a means to represent it in a way that is useful for designers. The BS8300 approach included different requirements for different scenarios. This seems to offer a promising direction for improving this aspect of accessibility standards.
Recommendations
- Develop revised criteria for reaching from a wheeled mobility device that are more realistic and comparable to everyday tasks.
- Base reach limits on a sample of individuals that excludes those with marginal abilities.
- Advisory information should be used either in the standards themselves or in a companion document to help designers address the variety of reaching conditions not specifically addressed in the requirements. That is the approach that the U.K. has taken in BS8300.
- Examine the implications of knee clearance on reach envelopes.
- Develop a method to represent reaching over obstructions.
4.4 Knee and Toe Clearances
Knee and toe clearances of the four sets of standards are roughly comparable. Figures 20-21 and Tables 5-6 show the standards from the four countries related to knee and toe clearances from a wheeled mobility device. Figures 22-27 show key findings from the research.
Figure 20.
Table 5.
|
|
U.S. |
Australia |
Canada |
U.K. |
|
Knee Clearance Height (KCH) |
685 |
640-650 |
680 |
700 |
|
Knee Clearance Depth (KCDL) |
280 |
230-250 |
200 |
260 3 |
|
Knee Clearance Depth (KCDU) |
205 |
x |
x |
x |
|
Extended Depth (ED) |
635 |
620-640 |
X |
500-650 |
|
Reduction Angle |
1:6 |
X |
X |
X |
|
Width |
760 |
800 |
750 |
900 |
Figure 21.
Table 6.
|
|
U.S. |
Australia |
Canada |
U.K. |
|
Toe Clearance Height (TCH) |
230 |
280-290 |
230 |
300 |
|
Toe Clearance Depth (TCD) |
150 |
190-200 |
230 |
X |
|
Width (W) |
760 |
X |
750 |
900 |
Figures 22-23. Knee Clearance Height
Note: DETR (U.K.) values are estimates
* One outlier from IDEA Center data removed because the wrong dimension was originally reported.
Figures 24. Knee Clearance Depth
* Two outliers from IDEA Center data removed due to translation errors in software.
The IDEA and DETR results for knee clearance size are not entirely consistent. But, they demonstrate that current standards generally accommodate the research participants except at the 95th percentile and above. The BS8300 sample had very little variation in knee clearance height. This suggests that the sample may have been much less diverse than the other two samples. A review of photographs of participants in the IDEA sample indicates that the largest individuals are not always the ones who need the greatest knee clearances. Smaller individuals who have heavy thighs, those with high seats and scooter users also have high lap heights. Individuals with extended footrests and scooter users have deep knee clearances. The knee clearance depth required by the U.K. standard is shallower than the others. But, the BS8300 research did not include this variable.
Figure 25-26. Toe Clearance Height
Note: DETR (U.K.) values are estimates
*Two outliers from IDEA Center data removed due to translation errors in software
**One additional outlier from IDEA Center- adjusted data removed due to foot position of one subject (dotted line)
Figure 27. Toe Clearance Depth
* Four outliers from IDEA Center data removed due to data translation errors in software
The IDEA, DETR and BS8300 research are the first to complete a study of knee and toe clearances. The studies are not entirely consistent but taken together, they provide convincing data on the need to make some changes in both knee and toe clearance dimensions. Note that the greatest discrepancy is between the BS8300 data and the other two studies. Again, the BS8300 results suggest that the sample used was not very diverse.
Results from the IDEA and DETR studies indicated that the 80th percentile participants and above are not accommodated by current standards for toe clearance. Again, the largest individuals are not always the ones who require the highest or largest toe clearance. In particular, people with small stature who have elevated seating systems need a very high toe clearance since the entire body becomes elevated. Scooters need a deep toe clearance as we defined it but many scooters have pivoting seats that allow their users to take a side approach to devices and fixtures. People with extended footrests require both deep and high toe clearances.
The IDEA Center data collection methods allowed calculations of lap height as well as knee height. Lap height was used as the determining value for knee clearance. A reanalysis using knee height may result in a closer fit with the DETR data but that does not necessarily mean that knee height should be the controlling variable.
It is clear that those people who need the largest knee and toe clearances cannot be accommodated without making some radical changes to the design of counters, drinking fountains and other design features where knee space is provided. Policy makers have to make a decision about who should be accommodated by knee and toe clearances or require alternatives like providing side access as well as front access. The results clearly provide evidence that adjustable and adaptable counters and toe kicks are a valuable design strategy. They suggest that more emphasis should be placed on adjustability, especially in home environments.
Recommendations
· A policy decision is needed on whom to accommodate for knee and toe clearances. Knee clearance and toe clearance height and depth requirements would have to be raised significantly to accommodate the individuals in the IDEA and DETR sample who need the largest clearances. However, that would result in some serious negative impacts for counter design, drinking fountain design and other design features where knee space is provided.
· Consider requiring both a lateral approach to counter and service desks in public places and a forward approach under the work surface.
· Consider the use of adaptable clearances as a way to accommodate more people when needed.
4.5 Maneuvering Clearances
Figures 28-29 and Tables 7-8 show the standards from the four countries related to maneuvering clearances from a wheeled mobility device. Figures 30-32 show key findings from the research.
Figure 28
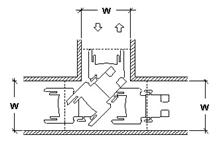
Table 7.
|
|
U.S. |
Australia |
Canada |
U.K. |
|
Width (W) |
915 |
X |
920 |
X |
Figure 29
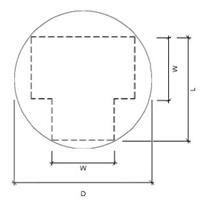
Table 8.
|
|
U.S. |
Australia |
Canada |
U.K. |
|
Diameter (circular) |
1525 |
X |
1500 |
1500 |
|
Width (W) |
X |
1540 |
X |
X |
|
Length (L) |
X |
2070 |
X |
X |
Figure 30. 90 Degree (“L-Turn”) for All Devices
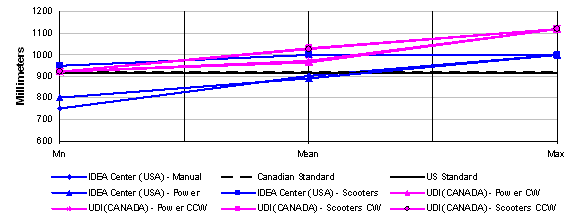
Note: IDEA Center values “max out” at 1000 mm due to experimental protocol
Figure 31-32. “U-Turn” for All Devices
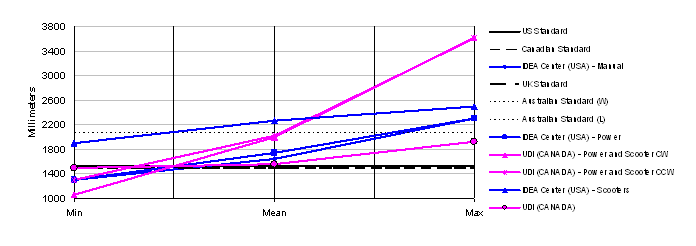
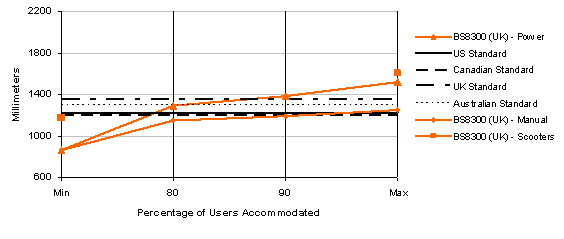
Only the U.S. and Canada have requirements for 90 degree or L-Turn clearances. All the standards have requirements for “wheelchair turning spaces.” Canada includes guidelines for both a 360 degree turn and a 180 degree turn. But, it is not clear, how the different standards define these turns. For example, when should one plan for a 360 degree turn as opposed to a 180 degree turn? Australia defines a rectangular area where the other countries have adopted a circular or “T-turn” geometries. Canada and the U.K. have added informative sections with more advisory information on maneuvering space requirements. This advisory data is based on the research reported in the UDI report and BS8300 Annex respectively.
The clearance required for all participants to complete a 90 degree turn by the IDEA sample was much smaller than the UDI findings. An increase in the clear width criterion of 100 mm (4 in.) would be needed to accommodate the entire IDEA sample. However, to accommodate the entire UDI sample, an increase of 300 mm (12 in.) would be needed. The UDI findings at the high end of the range probably reflect the impact of a few participants or devices with very poor turning ability.
The IDEA protocol included only a 360 degree turn but the UDI study included a 180 degree turn as well. The BS8300 reports only the latter but doesn’t define it. The IDEA and BS8300 results demonstrated that turning area clearances would have to be increased to 2400 mm (94.5 in.) compared to the current 1500-1525 mm (60 in.) to accommodate their entire samples. To accommodate the UDI sample for a 180 degree turn, the required turning space would only have to be increased to 1925 mm (75.8 in.). However, in the UDI research protocol, the ends of the turn were open, allowing the participants to lengthen out their turn and reduce its width. In comparison, the UDI participants utilized a much larger space for the 360 degree turn, in which no sides were blocked. A space about 4200 mm (165 in.) would be needed to accommodate the entire sample. In the IDEA sample, scooters require more space but the largest values for scooters, power chairs and manual chairs were very close whereas in the UDI sample, at least one power wheelchair user required a much larger clearance for the 360 degree turn. Because the UDI protocol for the 360 degree turn was not bounded by walls, participants could extend their arms and legs beyond the envelope of the chair. With a bounded area, many of these individuals may have been able to pull their extremities closer to their body during the turn.
The results support increasing the clearances for 90 degree turns and 180 degree turns. However, it appears that there are some people at the tail of the distribution who require much larger spaces than even the 95th percentile values. More detailed information on who these individuals are and the size of their devices is needed. They may be very restricted in their abilities to maneuver chairs independently. It is important to note that these individuals use all three types of devices. We observed some manual wheelchair users who had very restricted push arcs. This limited their ability to maneuver a chair and resulted in wide turning circles.
The differences between the UDI findings and the other studies suggest great differences in their protocol or measurement technique. This may be due to the lack of an enclosure in the 360 degree turn, errors in correcting for parallax when measuring from video cameras mounted above, or inability to obtain accurate measurements of body parts and devices in motion.
Recommendations
- Clearances for L-turns should be increased 100 mm (4 in.).
- The intent and applications of the wheelchair turning area needs to be more clearly defined.
- Clearances for wheeled mobility device turns should be increased but accommodating the entire population of wheeled mobility users may result in very restrictive requirements.
5.0 Conclusions
The research demonstrated that there is a need to revise the standards for wheeled mobility access to reflect the body structure and functional abilities of this population and the devices they use today. The U.S. standards are in more need of change but the basis for many of the changes previously made to the standards in Canada, the U.K. and Australia can also be questioned in light of the research findings. Findings must be evaluated very carefully when used to make changes to standards. In particular, the impact of the methods used on findings needs to be studied in depth. Yet, consistency of trends across the various samples is quite good, given the wide variety of methods used. The main problem in comparing findings is the lack of information about the extreme cases.
There is a clear need to develop an international consensus on standards and research methods. In a global economy, people who use wheeled mobility devices can be expected to travel all over the world. At least in facilities that are frequented by international travelers, minimum requirements for key built elements would provide a basic level of accessibility that everyone could expect. Our findings suggest that, at least in the most developed countries of the English-speaking world, standards are diverging. There appear to be several reasons for this divergence: 1) differences in the research that supports standards development, 2) differences in how the elements of access are defined, both the terminology used and also in the definitions (or lack thereof) of key variables, 3) use of Imperial units in the U.S. that are not always compatible with typical metric dimensions used in the construction industry. Underlying these reasons is the lack of communication between the researchers and standards developers at the international level. Without such communications, a consensus on methodologies and approaches will not evolve.
While standardization may improve the utilization of research findings, it is important to recognize the need for differences in accessibility standards from country to country. There are many good reasons for variation, including cultural differences in stature, differences in economic development and differences in cultural expectations for independence among the population. Yet, there is no reason why the benefits of international standardization can be achieved while still respecting cultural differences. The research conducted here demonstrates several possibilities: standardize the terms and definitions for the variables of accessibility, establish consensus on how to define accessibility in terms of human performance, define a minimum level of accessibility that is accepted at an international level. Any country could exceed the minimum thresholds.
Another important conclusion from this research is very obvious. Research methods have to be improved and documented more thoroughly. There is not enough information in many of the research reports we obtained to judge the quality of the methods used. Standards of research quality are well known. The reliability of methods needs to be documented. New methods should be compared for validity with older methods. Sample recruitment should be well documented and designed to reduce bias or achieve specific objectives. Enough funding needs to be provided to develop sufficient sample sizes.
Finally, there is a need to internationalize this type of research. Standardizing methodologies at an international level and providing funding from international agencies to measure people in countries that cannot afford to do it themselves are two critical needs. Currently, there is very little research on this subject and it is all being completed in developed societies. The rapidly improving development status of Asian countries will bring with it increased expectations and demands by their citizens with disabilities. The aging of societies worldwide will also increase the need to support independence for the older part of the population. In less developed countries, the older population is increasing very quickly as public health improves. In these countries, international agencies are also completing massive projects to improve education, health, transportation and housing. It is important that standards from the western world are not blindly applied in these societies without determining whether they are appropriate.
Appendix 1 – Details of Research Methodologies
Bails et al.
Bails recruited participants from attendees at disability support centers and institutions. Participants had to be between 18 and 60 years of age and had to either use a manual or powered wheelchair. Scooter users were not included in the study. The exact sample size is difficult to determine because each sub-study had a different sample size and not all participants were given an ID number. It therefore remains unclear whether or not the total number of participants is the aggregate of the individual studies or if some individuals participated in more than one field test.
Bails’ research focused on testing of full-size simulations of elements found in the built environment, such as doorways, environmental controls, furniture and fixtures. Research findings from many of the field tests used pre-established sizes and features to measure barriers and problems. The research was focused on testing the adequacy of current standards. Many of the findings therefore could not be used to make generalizations or to determine the ideal spaces needed for access. Much of Bails’ data was reported in an incomplete and disorganized manner. For example, hand printed lists of results from each sub-study were included in his report which were difficult to decipher.
Seeger et al.
Seeger et al. (1994) studied only device size. Participants included 240 individuals. About 73% of the sample lived in nursing homes and other institutions. Forty-five percent were over 65. Eleven percent used power chairs and 2% used scooters. Both unoccupied and occupied dimensions of device width and length were measured as well as a set of other basic dimensions. Measurements were taken manually using a tape measure, spirit level and, in some cases, a steel square. No reliability study was completed but the “accuracy” of the measurements is reported to be within 5 mm.
DETR
The DETR study (Stait et al., 2000) was limited to measurement of device size and weight. Participants were recruited at a “Mobility Roadshow,” an exposition of equipment for people who use wheeled mobility devices for traveling around the community. Of the 745 participants whose data was acceptable, 59% of the sample used self-propelled manual chairs, 9% used attendant powered chairs, 25% used power chairs and 9% used scooters. Nine percent of the sample were judged to be 16 years of age or younger.
The method of data collection was designed to be completed in a very short participation time. A low profile stand was constructed with a weight pad underneath and two cameras mounted above and to the side. Participants were recruited as they walked by the apparatus. They rolled onto the stand and were photographed while their weight was recorded. Then they rolled directly off the stand. A checkerboard was mounted behind the stand from which dimensions could be scaled from photographs. Parallax was corrected during the calculation of the dimensions using scaling from the checkerboard and trigonometry. Prior to data collection the reliability of the method was checked by comparing dimensions taken directly from the person with those calculated from the photographs. The differences between the two sets of dimensions in the reliability study were less than 1%. Although 943 people were photographed, 198 participants’ data were omitted due to camera failure, inability to take accurate dimensions from the photographs, or because the participants had rental wheelchairs.
Wheelchair dimensions were defined clearly. Length was measured from the most anterior to posterior dimension, either body part or device part. Width was the unoccupied width. Height was taken from the ground to the highest point, either chair or person. A major limitation of this study is that, although a wide variety of accessories were observed on the devices, they were not measured as part of the width calculation.
BS8300:2001 Research
Annex D and E to the BS8300:2001 Standard includes informative charts and tables from the results of research commissioned to obtain information on anthropometry of wheeled mobility devices. They include information on space required for “kneeholes,” reaching abilities of wheeled mobility users, clear floor area space requirements and maneuvering clearances. Unfortunately, without a research report with details about the research protocols, it is difficult to interpret and compare the results of this interesting study to the others.
Knee height measured from “floor to top of knee” but it is not clear what anatomical body landmark was used in the knee area and how knee height and location relates to lap height. Footrest depth was measured from “front of wheelchair seat to the front of the toes” but an anatomical landmark on the toes was not identified and information was not provided about how measurements were made when the toe was not as far forward as the footrest or other part of the device (e.g. scooter body) or when footrests did not extend as far as the front wheels. An armrest height landmark is illustrated in the document but it is not clear whether the top was defined as the top of the metal structure of the armrest or an armrest pad. The illustration shows the former. It is also not clear what was measured if the chair had no armrests or slanted armrests.
Reach ranges were measured using a fixed counter height at 750 mm and at three angles of arm reach with respect to the counter. Two conditions, “comfortable” and “extended” were measured. The former did not include stretching or bending from the waist and the latter included stretching and bending but it is not clear whether all participants could do the latter and which hand was used. It is also not clear how individuals were positioned with respect to the counter. No information is given about how the protocol dealt with individuals who could not reach at the specified angles, the landmark on the body used to measure the reach nor the conditions of reaching, e.g. free reach, with a weight, reach to target, open hand, closed fist, etc. No information is provided on the landmark used to measure reach, e.g. tips of fingers or other landmark on the hand.
Clear floor area included the space needed to accommodate wheelchair accessories and the projection of toes beyond footrests and arms and elbows beyond the armrests. It is not clear whether other body parts were included, e.g. knees and legs on scooters. No information is given on the details of the protocol for measuring clear floor area or maneuvering clearances. In particular, it is not clear whether the maneuvers were performed in open space or within some sort of confined space, what constituted a successful trial, how many trials were performed and how the space clearance required was measured. From an illustration, it appears that the protocol for the 180-degree turn did allow participants to perform either a U turn or a K turn.
It appears, from the report of data on the maneuvering trials that some scooters and attendant propelled chairs were included in the sample. It is not clear whether these individuals were included in the device, body or reach measurements.
From basic information gathered with human participants, the researchers developed computer aided design simulations to identify clearances needed for access aisles at vehicles.
UDI
The research sample was recruited from disability and senior organizations in Winnipeg by written invitation. The organizations were not reported. Participants were measured in their own devices. All participants were paid $50 and travel expenses. Of the 50 individuals studied, 35 used power chairs and 15 used scooters. The cause of disability for individuals in the sample included a wide range of conditions. The largest group represented was Cerebral Palsy (15 individuals or 24% of the sample). The research was conducted in February.
All dimensions were taken to the extremes of the equipment including any object attached to the device like a ventilator. However, the actual landmarks on the devices are not well documented. Measurements were made with rulers and tape measures but no information is given on the accuracy and reliability of these techniques. Maneuvering trials were recorded using overhead video cameras while participants completed standardized movements in simulated environments built with plywood floors and wood framed dividers. Measurements were later taken off the videotapes although the method used to do this and the reliability of the technique are not described. An observer rating was used to determine successful trials.
Maneuvering trials were recorded using overhead video cameras. Except for one, the maneuvering experiments were completed within simulated environments built with plywood floors and wood framed dividers faced with fiberboard and covered with construction paper. The starting clearance for each trial was the minimum clearance of the Canadian CSA B651-95 Standard. Each participant completed two trials for each clearance but which was used for analysis is not reported. Observers rated the level of accessibility of each trial on a scale devised by the researchers. No information is provided regarding the inter-rater or intra-rater reliability of the scale. “Very accessible” as defined by the scale meant that the participant was able to drive the device through the test environment without stopping, reversing or touching walls/obstacles. No hesitation or reduction in speed was allowed to achieve that rating. If the trial was not rated “very accessible” the clearance between dividers was increased an increment of 25 mm until, presumably, they reached that level of performance.
The width of travel required for passage was studied for the device user alone, for two device users and for a “pedestrian” and a device user. No information is provided on the size of the other person or how close to the adjoining wall they passed. Although shoulder “widths” was measured, the report does not define that dimension. Several different types of turns were studies: a 360 degree turn in free space, a three point (K turn) between two corridor walls, two 90 degree turns around an obstacle that was 1200 mm wide, two 90 degree turns around an obstacle that was narrower than1200 mm, 90 degree turn on a ramp landing, and a 180 degree turn on a ramp landing. The 360 degree turn was conducted both in the clockwise and counter clockwise direction. The 360 degree turn diameter was estimated by using the video image and the measured size of the wheelchair. It was noted that arms and elbows often protruded outside the arc of the chair. The additional space required for limbs was estimated. No indication as whether the estimates were corrected for parallax or distortion in the video lens. Video lenses tend to distort the scene more toward the outside of the lens than toward the middle.
Reach measurements were obtained without touching the individual. Reaching abilities were measured both with and without “bending” although a definition of “bending” was not provided. Side reaching abilities were measured from the center seat back where it met the seat to the “tip of the furthest extended finger or the furthest reach of the participant’s hand.” Forward reach was measured similarly from the point where the seat back meets the seat. No information is provided how the actual reach was completed, e.g. to a target, at a specified angle, with a weight, etc. It is also not clear whether the seat cushion was considered part of the seat or not. And, no mention is made of how measurements were taken in conditions where there was a space between seat back and seat. The accuracy and reliability of the measurements is of particular concern here since standard anthropometric measuring tools were not used and the wheeled mobility device users often have very limited reaching abilities and may not be able to hold their hand and arm in position long enough for an accurate measurement in free space. Without more specific information on the angle or direction of reach, it is very difficult to interpret the results of this research. Furthermore, measuring the point at which the seat back meets the seat is very difficult when an individual is occupying the chair. No information is provided on how that was accomplished.
IDEA Center
The IDEA study (Steinfeld, Paquet, Feathers, 2004; 2005; Feathers, Paquet, Steinfeld, 2004; Paquet and Feathers, 2004) included static anthropometry of occupied wheeled mobility devices, reach measurements and measurements of maneuvering clearances. At the date of the analyses conducted for this report, 275 participants with a wide range of chronic conditions had been recruited through outreach efforts with several organizations in Western New York and mass media. Fifty-three percent of the sample was male and 47% female. The mean age of the sample was 51.5 with a range of 18-94 years of age. Fifty-five percent used manual wheelchairs, 36% used power wheelchairs and 9% used scooters. Three-dimensional locations of body and wheelchair landmarks were collected with an electromechanical probe (Feathers, Paquet and Steinfeld, 2004). A reliability study was completed before data collection (Feathers, Paquet and Drury, 2004).
Participants were recruited through presentations at organizational meetings, television news, mailers, posters, flyers, brochures and cooperative outreach efforts with several organizations in Western New York that serve people who use wheeled mobility devices. Organizations that helped to recruit participants included the Western New York Independent Living Center, the United Cerebral Palsy Association of Western New York, the Western New York Veterans Administration Medical Center, Eastern Paralyzed Veterans of America and DeGraff Skilled Nursing Facility. Some employees of the University at Buffalo were also recruited. Only those who relied on a wheeled mobility device for their primary means of mobility were eligible for participation. Participants had to be at least 18 years of age. All participants were paid $50 plus travel expenses.
Participants were asked to bring in the chair that they use on a regular basis. Most of the individuals in this study had more than one chair (60%), and many of these people had another type of chair as their alternate (52%). Most of the individuals brought the chair that they would normally use when out in public. Informally, most respondents reported that they had smaller and more maneuverable chairs for use at home. Some individuals did not bring in their footrests (4%) because they prefer not to travel with them.
Analysis of individual participants with very large measurements for length identified two clear “outliers” who were excluded from the sample. One of these individuals needed to have one of his legs extended fully during the measurements. The second had spastic tendencies that made it impossible for him to remain still long enough to take the length measurement accurately. Uncorrectable data conversion problems with software caused additional outliers for several analyses.
The measurement protocol included the collection of wheelchair specifications, demographic information, structural anthropometric information and functional anthropometric information for each participant. Three-dimensional locations of body and wheelchair landmarks were collected with an electromechanical probe. A single origin point on the floor was used to identify the location of all landmarks. Thousands of dimensions can be computed from a limited set of landmarks. This reduced the amount of trials and measurements needed significantly. Photographs were taken of each participant in a variety of positions and video recordings were made of all maneuvering trials.
Body and device landmarks were defined in detail in a manual (Feathers, Paquet and Steinfeld, 2004), which also described how the definitions relate to generally accepted anthropometric landmarks and how they differed for this population. The probe used to record body and device landmark locations with respect to one another and to reference planes (e.g., floor, seat, arm support) was an articulating arm with six degrees of freedom that had a precision of 0.3 mm. The three-dimensional coordinates of each landmark point were recorded by pressing the probe’s activation button three times in rapid sequence.
For the reference planes, a minimum of five points on different locations of the physical plane such as on the floor or on the top of a footrest were recorded to define the plane. Distances between points or reference planes were used to derive estimated widths, heights, and depths of key device characteristics and body dimensions. A reliability study showed that this method of obtaining anthropometric dimensions is reliable but measurements may differ from those obtained with conventional anthropometric measuring devices (Feathers, Paquet and Drury, 2004). This occurs mostly with dimensions near the hands and other body parts that may move slightly during data collection.
Occupied length of devices was calculated by computing the dimension from the extreme rear and forward points on the body or chair. This was usually a toe in the front and the trailing edge of the wheel, backpack or edge of the power base in the rear for manual and power wheelchairs. For scooters, the extreme front point was usually a basket that hung off the handlebars or part of the scooter housing and the extreme rear point was usually the rear edge of the housing. Occupied width of devices was calculated by computing the dimension from the extreme left and right points on the body or the chair with hands in resting position. For manual wheelchairs, including attendant propelled models, this could be the outside edge of the wheel guide, the elbow or the hand. For power chairs it could be the outside edge of the control box, an elbow or other body part extended over the side. For scooters, it could be the outside edge of the device housing, the elbows or the outside surface of the hips or shoulders, if they hung over the housing.
The reach protocol utilized a standardized procedure in which participants utilized an apparatus with a series of five shelves that could be moved in and out from the main part of the device and positioned at 100 mm (4 in.) increments while lifting .46, 1.4 and 2.3 kg (0, 1, 3 and 5 lb.) weights. Reach limits were digitized with the mechanical probe, and, from the data, a reach envelope for each individual was constructed. Standard cylindrical canisters 75 mm (3.5 in.) in diameter were used to assess reaching ability. These weights were empirically derived through a study of common bathroom products. If an individual could not grip the canister, a cuff around the palm and attached to the canister was used. If the cuff could not be used, the individual did not complete the reach protocol except for free reach. If a person was unable to reach above the shoulder, they were excluded from all reaching tasks. This eliminated bias in results due to the inclusion of individuals who could not perform a functional reaching task. In all reaching trials except free reach, individuals were asked to reach as far as they could without endangering their safety or causing pain. Free reach trials were completed without bending or stretching.
An envelope of reaching ability was measured with the individual’s preferred hand. To determine maximum reach, the individual held the canister in their preferred hand and placed it on a shelf at the extreme of reach. Reach was recorded using the probe at the “MCP5”, a bony protuberance at the outside of the hand below the pinky finger. This landmark was used because functional reach involves grasping and manipulating objects and the tip of the fingers does not give a measure of reach that reflects grasping tasks. In calculating the actual reach, we computed the location of the target on the shelf itself using the known dimensions of the target and the reach dimension to the MCP5. Similar trials were completed for high reach, mid range reach and low reach. A shelf location closest to the highest vertical free reach was used to measure high reach; mid level was set at or near the shoulder and the shelf for the lower reach was set at the MCP5 height while an individual was asked to reach as low as they possibly could at the side (lateral). The lowest possible shelf was 390 mm (15.3 in). This limit was set for safety reasons.
Three sets of reach trials were completed at three different positions – forward, laterally and at a 45 degree angle. There were no obstructions under the shelves because they projected out from the main part of the apparatus. The order of the trials was counterbalanced to control for fatigue but participants were told to stop and rest whenever they felt tired. Data is not reported here for the 45 degree reach.
Three-dimensional digital data has many advantages in reach studies. The distance between any pair of three-dimensional landmarks or reach coordinates can be computed. Moreover, projections of the coordinates to virtual planes at any orientation provide additional flexibility. As an example, reach limits can be computed from precise landmarks on the shoulder, parts of the mobility device, like the most leading edge (anterior most) or trailing edge (posterior most) of the person or device. Reaching abilities can also be projected onto planes inserted at any location in the reach envelope.
The uniform variables for forward reach in the standards assume that an individual is reaching to a plane that is at the anterior (forward) most point on the device or the body (e.g. toes) or set back from a counter edge (reach over obstruction). For side reach, the uniform variables assume that an individual is reaching to a plane at the extreme lateral (side) most point of the body or device or set back from a similar counter edge. A computational procedure was used to identify the locations where forward and side reaching abilities, as measured by the three dimensional reach envelope, intersect virtual planes at the anterior most point and the lateral most point. For lateral reach we also calculated reach to a second plane set 254 -610 mm (10 - 24 in.) back from the lateral most point (not reported here). For the purpose of this report, all reach limits were calculated to the acromion, a bony protuberance on the shoulder.
Maneuvering clearances were measured while participants conducted standardized maneuvers inside a set of lightweight movable walls. The walls were gradually moved further apart until the maneuver could be completed without the participants moving the walls. Clearances were pre-measured on the floor of the test site using tape and marker and the locations of walls were recorded after each trial. Maneuvering trials included an L or 90 degree turn and a 360-degree turn within a confined space. The latter could be completed as a “K”-turn or a “U”-turn or any other maneuver as long as the participant wound up facing in the same direction as their starting position. Clearances were pre-measured on the floor of the test site using tape and marker.
In the L turn, the starting width of the clearance was the closest pre-measured clearance to the occupied width of the individual’s device (leaving no more than 50 mm of clearance to either side). In the 360 degree turn in a confined space, the starting clearance was an 1100 mm (43 in.) wide square space. Each participant was asked to complete the trial and, if a wall was moved in the course of the trial, the clearance was increased 50 mm and another trial completed until the participant was able to complete a trial without moving a section of wall. In the 360-degree turn in a confined space, two adjoining sections of wall were moved out as one unit along the diagonal so that the space stayed square in proportion. All trials were videotaped for later observation although the minimum clearance required was noted during the trials.
Appendix 2- Photos of Participants in the IDEA Center Research
Examples of High Seats:
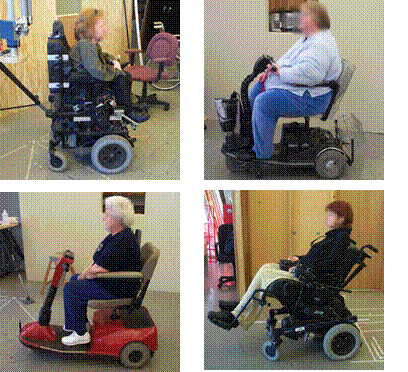
Examples of Very Large and Small Clear Floor Area Widths:
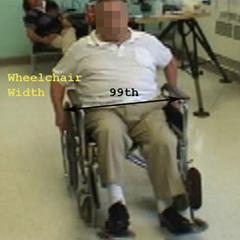
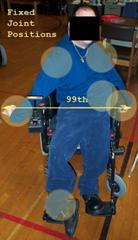
Examples of Very Long Clear Floor Area Lengths:
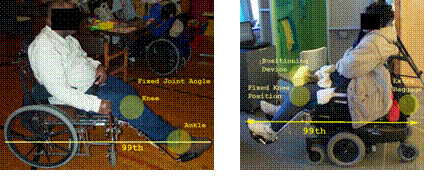
Examples of People with Very Limited Reaching Ability:
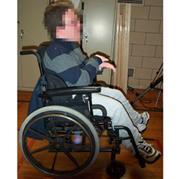
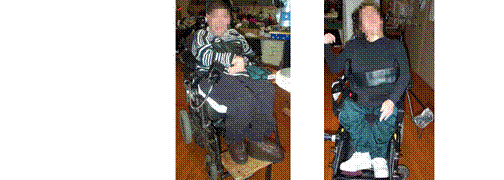
Examples of People with High Lap Heights:
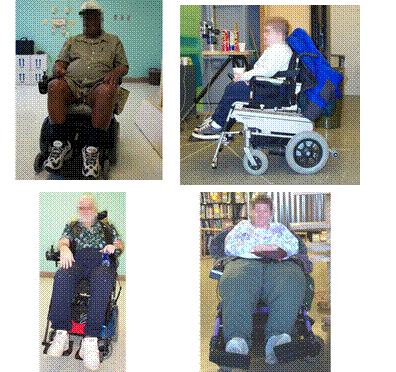
Examples of People Requiring Deep Knee Clearances:
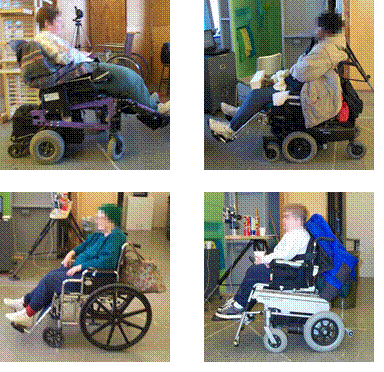
Examples of People Who Need Deep Toe Clearances:
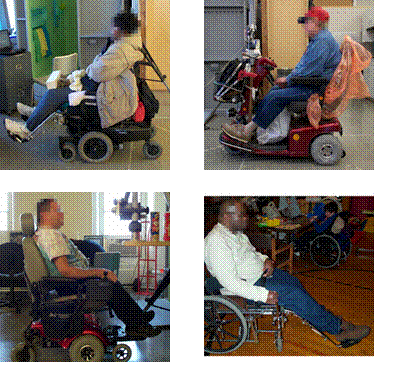
Appendix 3 - Comparison of US Standards to IDEA Center Research
|
|
Dimension |
U.S. Standard |
Standard Deviation |
Median |
5th Percentile |
95th Percentile |
|
Wheelchair Dimensions |
|
|
|
|
|
|
|
|
Unoccupied Width |
660 |
77 |
609 |
475 |
712 |
|
|
Unoccupied Length |
1065 |
106 |
1066 |
900 |
1218 |
|
|
Handle Height (HH) |
915 |
80 |
895 |
754 |
1024 |
|
|
Armrest Height (AH) |
760 |
65 |
713 |
598 |
817 |
|
|
Seat Height (SH) |
485 |
49 |
528 |
454 |
607 |
|
|
Eye height (EH) |
1090-1295 |
75 |
1174 |
1047 |
1288 |
|
Clear Floor Space |
|
|
|
|
|
|
|
|
Occupied Width (W) - all devices |
760 |
60 |
669 |
596 |
800 |
|
|
Manual |
|
63 |
667 |
591 |
796 |
|
|
Power wheelchair |
|
129 |
752 |
592 |
801 |
|
|
Scooter |
|
71 |
714 |
625 |
810 |
|
|
Occupied Length (L) - all devices |
1220 |
105 |
1166 |
1009 |
1336 |
|
|
Manual |
|
104 |
1170 |
875 |
1299 |
|
|
Power wheelchair |
|
123 |
1253 |
1100 |
1361 |
|
|
Scooter |
|
86 |
1248 |
1110 |
1373 |
|
Reach Ranges |
|
|
|
|
|
|
|
|
High Forward Reach |
1220 |
299 |
1401 |
683 |
1702 |
|
|
Low Forward Reach |
380 |
125 |
609 |
884 |
464 |
|
|
High Side Reach |
1270 |
119 |
1597 |
1347 |
1704 |
|
|
Low Side Reach |
380 |
89 |
602 |
792 |
485 |
|
|
High Side Reach with Obstruction (255mm) |
1220 |
174 |
1517 |
1182 |
1702 |
|
|
High Side Reach with Deep Obstruction (610mm) |
1170 |
203 |
1245 |
926 |
1519 |
|
Knee and Toe Clearance |
|
|
|
|
|
|
|
|
Knee Clearance Height (KCH) |
685 |
69 |
640 |
515 |
742 |
|
|
Knee Clearance Depth (KCD) |
280 |
81 |
185 |
53 |
309 |
|
|
Toe Clearance Height (TCH) |
230 |
121 |
190 |
35 |
349 |
|
|
Toe Clearance Depth (TCD) |
150 |
94 |
188 |
143 |
386 |
|
Maneuver-ing Clearance |
|
|
|
|
|
|
|
|
90 Degree Turn ("L-Turn") |
915 |
|
|
|
|
|
|
Manual |
|
81 |
900 |
788 |
1000 |
|
|
Power wheelchair |
|
65 |
875 |
800 |
1000 |
|
|
Scooter |
|
26 |
1000 |
950 |
1000 |
|
|
180/360 Degree Turn (diameter-circular) |
1525 |
|
|
|
|
|
|
Manual |
|
266.9 |
1500 |
1300 |
2020 |
|
|
Power wheelchair |
|
303 |
1700 |
1300 |
2130 |
|
|
Scooter |
|
234 |
2300 |
1950 |
2500 |
Recommended value
Appendix 4 – References
American National Standards Institute, Inc. (1998). A117.1-1998 Accessible and usable buildings and facilities. New York: International Code Council, Inc.
American National Standards Institute, Inc. (1980). A117.1-1980, Specifications for making buildings and facilities accessible to and usable by physically handicapped people. New York: ANSI.
Australian Standard. (2001). AS1428.1-2001 Design for access and mobility—Part 1: general requirements for access—new building work. Sydney, Australia: Standards Australia International.
Australian Standard. (1992). AS1428.2-1992 Design for access and mobility—Part 2: enhanced and additional requirements—buildings and facilities. Sydney, Australia: Standards Australia International.
Bails, J.H. (1983). Project report on the field testing of the Australian standard 1428-1977 part 1—Recommended amendments and index to part 2 detailed reports. Adelaide South Australia, Public Buildings Department.
Bails, J.H. (1983). Project report on the field testing of the Australian standard 1428-1977 part 2—Details of field testing of AS1428. Adelaide South Australia, Public Buildings Department.
British Standards Institution. (2001). BS8300:2001 Design of buildings and their approaches to meet the needs of disabled people—Code of practice. London, U.K.: BSI.
Canadian Standards Association. (2004). CAN/CSA B651-04 accessible design for the built environment standard. Mississauga, Ontario, Canada: Canadian Standards Association.
Feathers, D., Paquet, V., and Drury C. (2004). Measurement consistency and three-dimensional electromechanical anthropometry. International Journal of Industrial Ergonomics Special Issue on Anthropometry and Disability 33(3); 181–190.
Feathers, D., Paquet, V. and Drury, C. (2002). Effects of automation of measurement error and consistency in anthropometry. Proceedings of the Human Factors and Ergonomics Society 46th Annual Meeting, 1215-1219.
Feathers, D., Paquet, V. and Steinfeld, E. (2004). Anthropometry manual for three dimensional measurement. Buffalo, NY: Center for Inclusive Design and Environmental Access.
Paquet, V., Feathers, D. (2004). An anthropometric study of manual and powered wheelchair users. International Journal of Industrial Ergonomics 33(3); 191 - 204.
Rapoport, A. and Watson, N. (1972). Cultural variability in physical standards. In Gutman, R. (ed.) People and Buildings. New York: Basic Books, pp. 33-53
Ringaert, L., Rapson, D., Qui, J., Cooper, J., and Shwedyk, E. (2001). Determination of new dimensions for universal design codes and standards with consideration of powered wheelchair and scooter users. Manitoba, CA: Universal Design Institute.
Seeger, B., Costi, J., and Hartridge, M. (1994). Final report of consultancy on wheelchair user requirements for the National Accessible Transport Committee Commonwealth Department of Transport. Kilkenny, South Australia: Regency Park Centre for Young Disabled.
Stait, R.E., Stone, J., and Savill, T.A. (2000). A survey of occupied wheelchairs to determine their overall dimensions and weight: 1999 survey. Berkshire, U.K.: TRL Limited.
Steinfeld, E., Feathers, D., and Paquet, V. (2005). Space requirements for wheeled mobility. Buffalo: NY: IDEA Center.
Steinfeld, E., Paquet, V., Feathers, D. (2004). Space requirements for wheeled mobility devices. In: Proceedings of the Human Factors and Ergonomics Society 48th Annual Meeting.
Steinfeld, E. Schroeder, S. and Bishop, M. (1979). Accessible buildings for people with walking and reaching limitations. Washington, DC: U.S. Department of Housing and Urban Development.
U.S. Access Board. (2004). Americans with Disabilities Act accessibility guidelines for buildings and facilities. Washington, DC: Federal Register 35455-35541.
U.S. Access Board. (1994). 28 CFR part 36 Nondiscrimination on the basis of disability by public accommodations and in commercial facilities. Washington, DC: Department of Justice.
User Comments/Questions
Add Comment/Question