Anthropometry of Wheeled Mobility Project: Final Report
Prepared for the U.S. Access Board
December 31st, 2010
Center for Inclusive Design and Environmental Access (IDeA)
School of Architecture and Planning
University at Buffalo
The State University of New York
Buffalo, NY 14214-308
Credits
Authors
Edward Steinfeld, Arch.D. Co-Project Director
Victor Paquet, Sc.D. Co-Project Director
Clive D’Souza, M.S. Research Assistant
Caroline Joseph, M.Sc.A. Research Assistant
Jordana Maisel, M.U.P. Research Associate
Graphics
Jonathan White, M.Arch. Research Intern Architect
Heamchand Subryan, M.A., M.Arch., Research Design Associate
Funding for this project was provided by:
U.S. Access Board
National Institute for Disability and Rehabilitation Research, U.S. Department of Education
Acknowledgement
The authors would like to thank the following people for their foresight in perceiving the value of this work:
William Peterson, RERC Project Manager at NIDDR who perceived the need for the project and insured that it was part of the RERC on Universal Design’s mission.
Katherine Seelman, Director of NIDRR during the time the project was conceived.
Lois Thibault, Research Director of the U.S. Access Board who saw the value of continuing the work.
Lawrence Roffee and David Cappozi, Executive Directors of the Access Board during the project period.
Marsha Mazz, Director, Office of Technical and Information Services, who managed the project for the U.S. Access Board when Lois Thibault retired.
Disclaimer
This report was developed with funding from the U.S. Access Board (contract # TPD-ABA-07-C-001). The research was initially funded by the National Institute on Disability and Rehabilitation Research (NIDRR), U.S. Dept. of Education (grant ). The contents of the report do not necessarily represent the policy of the U.S. Access Board or NIDRR, and readers should not assume any endorsement by the Federal government.
Contact Information
For further information, contact:
Edward Steinfeld, Director
Center for Inclusive Design and Environmental Access (IDeA Center)
School of Architecture and Planning
University at Buffalo
3435 Main Street, 378 Hayes Hall
Buffalo, NY 14214-3087
716.829.5899 (phone)
arced@buffalo.edu (email)
This document is available free of charge from the IDeA Center website at: http://www.udeworld.com/anthropometrics
© Copyright, Center for Inclusive Design and Environmental Access, 2010
Unlimited use of this document for educational and research purposes are permitted without written permission but altering the contents and distribution for sale is not allowed without prior written permission from the IDeA Center.
Executive Summary
Anthropometry is the study of human body characteristics and abilities. Wheeled mobility devices (WhMDs) that are used by people with disabilities include manual wheelchairs, power chairs and scooters. Standards for accessible design include many requirements based on the anthropometry of WhMD users. Key requirements apply to clear floor area, knee and toe clearances, maneuvering clearances, reach limits, grip force requirements and door usability factors. Reference information is also often included on the characteristics of mobility devices like illustrations and dimensions of unoccupied or occupied wheelchairs. This reference information often forms the basis of requirements like clear floor area. Thus, they are as important as the requirements themselves.
The anthropometric data on WhMD users that underlies the technical requirements of the ICC/ANSI A117.1 (1998) Accessible and Usable Buildings and Facilities (ICC/ANSI) were generated from research completed from 1974 −1978 using a research sample that included about 60 individuals who used wheelchairs (see Steinfeld et al., 1979). In 1982, the U.S. Access Board developed the first Federal guidelines for facility accessibility in the U.S. Under the Americans with Disabilities Act of 1990 (ADA), the Board continued this work, publishing the ADA Accessibility Guidelines (ADAAG) in 1991 which were updated in 2004 by the ADA and ABA Accessibility Guidelines for Buildings and Facilities (ADA-ABA Standards). The latter was adopted in place of the ADAAG by the Department of Justice in 2010. Provisions for WhMDs in both guidelines were largely derived from the research conducted in the 1970’s (Steinfeld et al., 1979). Research in other countries, comments from the public, and demographic, social and technological trends indicate that there is a need for new current information on the anthropometry of WhMD users to bring standards up to date. Recognizing this need, the National Institute on Disability and Rehabilitation Research initiated a research study through the Rehabilitation Engineering Research Center on Universal Design at the IDeA Center, University at Buffalo, SUNY, to obtain the needed information in 2000. The initial research activities developed new anthropometric measurement methods and collected data on over 200 WhMD users. In 2006, the U.S. Access Board funded this project to expand the database and develop it further.
This report documents the research conducted at the IDeA Center from the initiation of the project in 2000, including analysis of data on a sample of almost 500 individuals who use WhMDs. Our findings are compared to those in three other countries and to the current standards in all four countries. Many differences exist in both the standards and research studies. Although details of the research results differ from study to study, trends in the data support the need to make many important revisions to the U.S. standards. This report provides a description of the research, an analysis of the results and a discussion of the implications.
The research included the collection of demographic information and WhMD characteristics, and the measurement of structural and functional anthropometry. The demographic and WhMD characteristics were recorded for approximately 30 variables using a checklist, along with digital still photographs of each WhMD user. The structural anthropometric measurements required the measurement of the body and devices size at rest. The methods incorporated the use of a 3-dimensional (3-D) digitizing arm that allowed us to capture the location of body and device landmarks in three dimensions. This technology provided data that we used to develop static 3-D human models. Conventional structural and functional measurements can be also be derived from the 3-D information. The functional anthropometric measurements required measuring reaching ability, grip strength and the minimum space needed for turning. Reaching performance was measured in 3-D with the digitizing arm; grip strength was measured with conventional hand dynamometers; and maneuvering was measured through systematic measured observations of performance and video analysis. We also measured performance during door use tasks via the use of observational rating scales.
We selected measurement variables and procedures for measurements that were based on advice provided by experts in anthropometry and ergonomics, human modelers, architects and designers, and clinicians. Preliminary studies were completed at the University at Buffalo, SUNY to assess and demonstrate the accuracy and reliability of the measurement method. Focus groups with WhMD users were also conducted to ensure that the protocols for the research, which involved intimate contact with the body, were acceptable to the participants. Institutional Review Board approval for the research activities, including recruitment methods and confidentiality, was obtained at three universities.
Software was developed to facilitate expansion of the database and data collection at multiple sites. This software included quality assurance routines to identify errors in datasets and routines to merge other data sets into the database. Most of the research participants came from the Buffalo metropolitan area. But, two other research sites were contracted to provide data during Anthropometry of Wheeled Mobility the research activities to increase the diversity of the overall sample, test the software and test the feasibility of sharing methods. The expansion of the database was quite successful. Thus the database can be augmented over time with new data collection activities.
Data were collected for a total of 495 WhMD users to ensure a diverse sample of WhMD users: Buffalo and its suburbs (n=351), Pittsburgh (n=100) and Ithaca (n=44). The quality assurance software was used to check the quality of the 3-D data collected at each of the sites. All of the acceptable demographic, WhMD and anthropometric information was compiled in a database.
Prototype software was developed to allow designers and standards developers to access the data using a graphical interface. For example, a user can set parameters for width of occupied device and identify the extent of participants accommodated. Menus also provide the ability to display frequency distributions and percentile data for each variable and to access case data. Menu driven settings enable the user to select different groups for analysis, e.g. males or females, to compare the results.
Although the interactive database provides a significant resource for researchers and standards developers, our dissemination activities and other research demonstrated that this tool is unlikely to be utilized by most designers, particularly architects, interior designers and landscape architects. Thus, we also developed information tools in the form of graphic representations of the results that are more consistent with reference materials these professionals utilize in practice. These tools are available on the IDeA Center’s website under design resources (http://udeworld.com/dissemination/design-resources.html). An online educational module has also been completed to explain the research and introduce these design tools to professionals.
This report includes results of analyses of data on the basic aspects of wheeled mobility anthropometry. The topics covered include: selected dimensions of unoccupied and occupied devices, knee and toe clearance, reaching abilities, gripping strength and turning spaces. We also completed a study on the usability of several doors for a sub-sample of our participants. This study provides information on the effectiveness of current standards in meeting the needs of WhMD users.
Dissemination activities included the publication of 8 refereed journal articles, 24 refereed conference papers and one encyclopedia article. Standards development activities have been Anthropometry of Wheeled Mobility initiated with four standards development organization in the U.S., Canada and Ireland. An online self-instructional course on the research has been completed and is now available for the public. A textbook on universal design, under contract with a major commercial publisher, is under development and will include a section describing the research and its implications.
The key findings of the research are:
1. Sample composition: There are important differences in the sample based on recruitment methods. This emphasizes the importance of multi-site studies for this population.
2. Diversity: There are often large differences in the body and chair sizes and in the functional abilities of manual chair, power chair and scooter users, and men and women.
3. Measurement parameters: There are no generally accepted and shared definitions of variables for both anthropometric research and standards development, which impedes integration of research and practice.
4. International comparison: Different countries use different approaches to developing standards based on anthropometry. None of the standards reviewed had a comprehensive and explicit approach to evidence based practice.
5. Landmarks: Some dimensions in standards do not correspond to clear measurement landmarks on the body and device, creating barriers in translating research findings to standards development.
6. Reference WhMD: The U.S. standard reference wheelchair does not represent the sizes of unoccupied wheelchairs in our sample well. Contemporary wheeled mobility devices are much more diverse in size and features than the reference wheelchair.
7. Clear floor space: A large minority of participants in our research would not be accommodated by the current U.S. standard for clear floor space, especially for length. The people excluded include those who use any of the three types of WhMD. Other countries have already increased the clear floor space used in their standards.
8. Seat height: Seats for a majority of our sample have seat heights above that shown in the reference wheelchair in the U.S. standard, especially the power chairs and scooters.
9. Knee and toe clearances: The current U.S. standards for knee and toe clearances do not accommodate a majority of participants in our sample.
10.Maneuvering clearances: A significant proportion of WhMD users, scooter users in particular, are not accommodated by current maneuvering clearances in U.S. standards, although the proportion differs for different clearances. In particular, the current standards do not accommodate most of our sample for completing a 360-degree turn. There are also a small number of participants in all categories who require much larger clearances than current standards provide.
11. Reaching ability: A significant percentage of WhMD users have very limited functional reaching abilities.
12. Reach limits: A majority of WhMD users cannot complete a forward reach to the minimum forward reach height in U.S. standards on a vertical plane in front of their anterior most point (toes or device). The current high side reach limit accommodates WhMD users. The low reach limit, as defined, is currently inappropriate for safety reasons.
13.Operating forces: The maximum operating force in the current standards is too high for the majority of WhMD users.
14. Door usability: The usability study confirmed many of the existing clearance requirements for doors but also identified the need for improving some others, especially the door clearance width. Findings support the increased use of automated doors and the development of improved closer technologies.
The research findings highlight the importance of integrating research with standards development, organizing research collaborations and the need to develop standardized research methods. Now that a foundation of tools and procedures has been developed and extensively tested for systematic scientific research in this field, the cost of implementing future research using these methods is significantly reduced.
There is still much knowledge to be gained from further analysis of the data collected. We intend to continue to analyze and publish the results of this work. We will continue to reach out to human modeling software companies to augment their databases of ambulant people with our database of WhMD users. The research team anticipates the development of future research collaborations, dissemination activities and standards development initiatives to advance the work that has already been completed.
1.0 Background
Relevance
The standards used to ensure accessibility for people who use wheeled mobility devices (WhMDs) like wheelchairs and scooters are based on research in anthropometry, the measurement of body sizes and physical abilities. The anthropometric data on WhMD users that underlies the technical requirements of the ICC/ANSI A117.1 (1998) Accessible and Usable Buildings and Facilities (ICC/ANSI) were generated from research completed from 1974 −1978 using a research sample that included about 60 individuals who used wheelchairs (see Steinfeld et al., 1979). In 1982, the U.S. Access Board developed the first Federal guidelines for facility accessibility in the U.S. Under the Americans with Disabilities Act of 1990 (ADA), the Board continued this work, publishing the ADA Accessibility Guidelines (ADAAG) in 1991, which were updated in 2004 by the ADA and ABA Accessibility Guidelines for Buildings and Facilities (ADA-ABA Standards). The latter was adopted in place of the ADAAG by the Department of Justice in 2010. Provisions for WhMD users in both guidelines were largely derived from the research conducted in the 1970’s (Steinfeld et al., 1979). Comments from people who use powered mobility devices indicate that increases in space and maneuvering requirements and decreases in reach ranges are needed in the Board’s guidelines to accommodate the use of such devices, which are generally larger, heavier, and less finely maneuverable than manual wheelchairs. Since the 1970’s, research on the anthropometry of WhMD users has been conducted in Australia, the United Kingdom (U.K.) and Canada. All of those countries have revised or are revising their standards based on that research.
In 30 years, many changes have occurred in nature of the U.S. population, the characteristics of people who use WhMDs and the characteristics of equipment that they use. Many more power chairs are in use now than in the 1970’s. Significant advances in wheeled mobility technology,health care, public health and demography have occurred that impact the body sizes and functional abilities of those who use wheeled devices for mobility. For example, power wheelchairs and scooters are often larger in size than manual chairs. In addition, improved health care technology has allowed people with more serious disabilities to survive longer than in earlier decades. These individuals may have conditions that affect their abilities to maneuver devices in small spaces or reach objects. A significantly broader range of devices is now available, from highly-adjustable battery-powered wheelchairs to 3- and 4-wheeled scooters with front tillers. Anthropometry of Wheeled Mobility Scooters also are growing in popularity. Yet, the technical requirements in U.S. standards have not changed. It is likely that the current U.S. standards do not reflect the actual dimensions and abilities of contemporary WhMD users.
Very few studies of the anthropometry of WhMD users were conducted in the 1980s and 1990s, especially in the U.S. In response to this lack of current information, the IDeA Center, with funding from the National Institute on Disability and Rehabilitation Research, developed a new set of anthropometric measurement methods and a comprehensive anthropometric data set of over 200 WhMD users was created (Feathers et al., 2002, 2004; Paquet and Feathers, 2004; Steinfeld et al., 2005). Rigorous scientific procedures were used in the development of the research methods and new software was created to organize and analyze the results. While much was accomplished in that study, there were important research needs that were unmet. First, a larger sample was needed to provide a more accurate characterization of the anthropometry of WhMD users. Second, a more diverse sample in terms of ages and WhMD technologies was needed to help improve the representativeness of the sample. Third, new dissemination products were needed to help ensure that the research findings could be translated to design practice and standards development.
Additionally, comparisons of international standards and research were needed to assess the adequacy of the current U.S. accessibility standards and help set priorities for improving regulations. Comparisons are also useful to identify best practices and differences related to cultural factors. Thus, in addition to collecting anthropometric data, we also completed a comparative analysis of research and standards on wheeled mobility in the U.S., the U.K., Australia and Canada. The analysis was limited to WhMD dimensions, minimum clear floor areas, space requirements for maneuvering, knee and toe clearances, and reach limits.
Objectives
The objectives of this study, supported by the U.S. Access Board were to:
1. Collect data on an extended sample with a target of a total of 500 individuals.
2. Collect and compare anthropometric research studies on wheeled mobility in Canada, the U.K. and Australia, with the U.S. standards and the research results from the current study.
3. Develop dissemination products including a final research report, tools for using the database and an online educational module.
The scope of the research analysis was limited to key anthropometric issues in accessibility standards:
-
Unoccupied device width and length
-
Clear floor space, or occupied footprint
-
Seat height*
-
Knee and toe clearances:
-
Knee height and depth
-
Toe height and depth
-
-
Maneuvering clearances on level surfaces:
-
90-degree turn
-
180-degree turn
-
180-degree turn around a barrier*
-
360-degree turn
-
-
Reach ranges:
-
Forward reach
-
Side reach
-
Side reach over an obstruction
-
-
Grip Forces*
-
Door use
Note, scope items with asterisks were added by IDeA Center.
Report Organization
This report documents the basic findings of the research and compares them to the national standards from the three countries and the U.S. It also compares the research findings to the research underlying the standards of these three other countries. Section 2.0 describes the methods we used to collect the data and make the comparisons. Section 3.0 describes the research results. Section 4.0 discusses the implications of these findings for design and standards development. Section 5.0 describes related dissemination and knowledge translation activities, and Section 6.0 provides some general conclusions, including recommendations for future research and knowledge translation activities. The Appendix includes a list of publications on the project and a set of information tools for designers and standards makers.
Units
The scientific practice of anthropometry is conducted using Metric units. However, in the U.S., accessibility standards are developed in Imperial units. Thus, in this report, we have used Metric units as the primary form for all dimensions. Some tables only have Metric units for space reasons. We included Imperial equivalents in parentheses in the text to assist the reader who is familiar with the dimensions in the standards. The ADA-ABA and other U.S. standards use a “soft’ conversion method in which Metric equivalents are rounded off to the nearest 5 mm except for very small values. Thus, in this report, where we refer to values in the ADA-ABA, we use the soft conversion to avoid confusion with the original source. Elsewhere, including our recommendations for revising the ADA-ABA, we use a “hard” conversion, rounded off to the nearest 1 mm. One exception to the Metric units as primary is in Section 3.0 on grip forces, and these dimensions are reported in pounds-force (lbf) as they were collected.
Text Descriptions
To facilitate comprehension of the report by people who use screen readers, we have included descriptive captions for all figures and tables, alt tags in digital versions and long text descriptions for figures. In Section 3.0, there are graphs of results but, each graph is simply a graphic summary of the data in the accompanying table that appears below it. The tables are readable by screen readers. Thus, there is no need for a further text description of the summary figure since the data is fully accessible to all readers.
2.0 Methodology
2.1 Participant Recruitment and Sampling
A sample of 495 WhMD users was recruited for the study. These included sub-samples of manual wheelchair users, conventional powered wheelchair users and scooter users. We intentionally oversampled powered wheelchair users in order to capture the sizes and space requirements of this group.
It would be useful to know how our sample compares to national estimates of the WhMD population. The most recent published estimates on the type of device are provided by LaPlante and Kaye (2010), and Cooper and Cooper (2003). LaPlante and Kaye (2010) used data from the 1994‒95 National Health Interview Survey on Disability (NHIS-D). More recent data available on the utilization of WhMD’s (e.g. the 2010 U.S. Census Bureau’s Survey of Income and Program Participation) do not distinguish between the types of electric WhMDs. Based on estimates by LaPlante and Kaye (2010), powered wheelchair users and scooter users each comprise about 9% of the WhMD user population not residing in institutions. A representative sample of 495 WhMD users would therefore include only 45 powered wheelchair and 45 scooter users.
In a review on wheeled mobility demographics, Flagg (2009) cites estimates by Cooper and Cooper (2003) on the proportion of mobility devices in the three categories. They estimated powered wheelchairs and scooters each to be about 15% of the WhMDs in use. The estimates by Cooper and Cooper (2003) were based on their own research and experience in the field, and include wheelchairs used in institutional settings like long term care facilities, rehabilitation hospitals and assisted living facilities. In our research, we recruited from assisted living facilities and day care programs for frail older adults but only people who could propel a chair independently were eligible to participate.
Based on this larger estimate, a sample of 495 WhMD users representative of the U.S. in terms types of WhMD used would include only about 74 power wheelchair and 74 scooter users. Even this larger estimate would not allow an accurate characterization of the sizes and functional abilities of these user groups in our study, which we expected to be quite diverse and different than manual wheelchair users.
Our approach allowed us to accurately describe the range of body sizes and functional abilities of conventional powered wheelchair users and manual wheelchair users. A sub-sample of scooter users was recruited to provide us with preliminary anthropometric data for this group but we were not able, despite great efforts, to recruit a large number of scooter users. It should be noted that it is possible to manipulate our current sample with the use of statistical simulation methods to develop samples that representative in terms of device type, age, and gender (Paquet et al., in preparation).
Data were collected in three different locations to help ensure a diverse sample of WhMD users: Buffalo and its suburbs (n=351), Pittsburgh (n=100) and Ithaca (n=44). Researchers at each of these sites were trained in the data collection methods and used the same measurement equipment to ensure consistency in measurement methods across sites.
2.2 Key Measurement Variables and Procedures
We selected measurement variables and procedures for measurements based on advice provided by experts in anthropometry and ergonomics, human modelers, architects and designers, and clinicians.
The measurement variables include the following:
1. Demographic information and wheelchair description: Approximately 30 variables recorded with a checklist, along with digital still photographs of the user and mobility device.
2. Body and wheelchair dimensions: Approximately 125 locations of body and wheelchair points recorded in three dimensions.
3. Reaches and lifts: One-handed maximum reaches recorded at 5 different heights in three different directions for up to four different weight conditions (maximum of 60 reaches total).
4. Maneuverability: Four tasks related to propulsion in confined spaces.
5. Grip Strength: Three repetitions of maximal power grasp recorded for two different upper extremity postures and three repetitions of maximal pinch grip for two types of finger posture (lateral and thumb-forefinger pinches) (12 measurements total).
6. Door use: The level of observed effort was rated as participants used three different doors.
2.2.1 Demographic Information
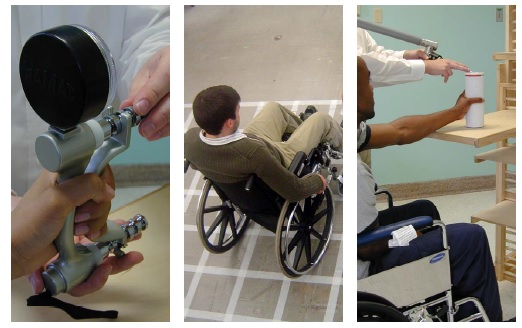
A survey, checklist and photography were used to capture the demographic and wheelchair characteristics for each WhMD user. Demographic variables included: gender, age, disability status (category), years with the disability, and years using the mobility aid. Key variables associated with the mobility aid included device type (e.g., power chair, scooter), and within each type: make, model, age, armrests, footrests, drive wheels, controller, seat support surfaces and overall condition of the seating surface. A checklist was used to evaluate these device attributes (see Figure 2‒1). Digital photographs of the user and device were taken from the front and side views to document the wheelchair accessories and configurations of WhMD user.
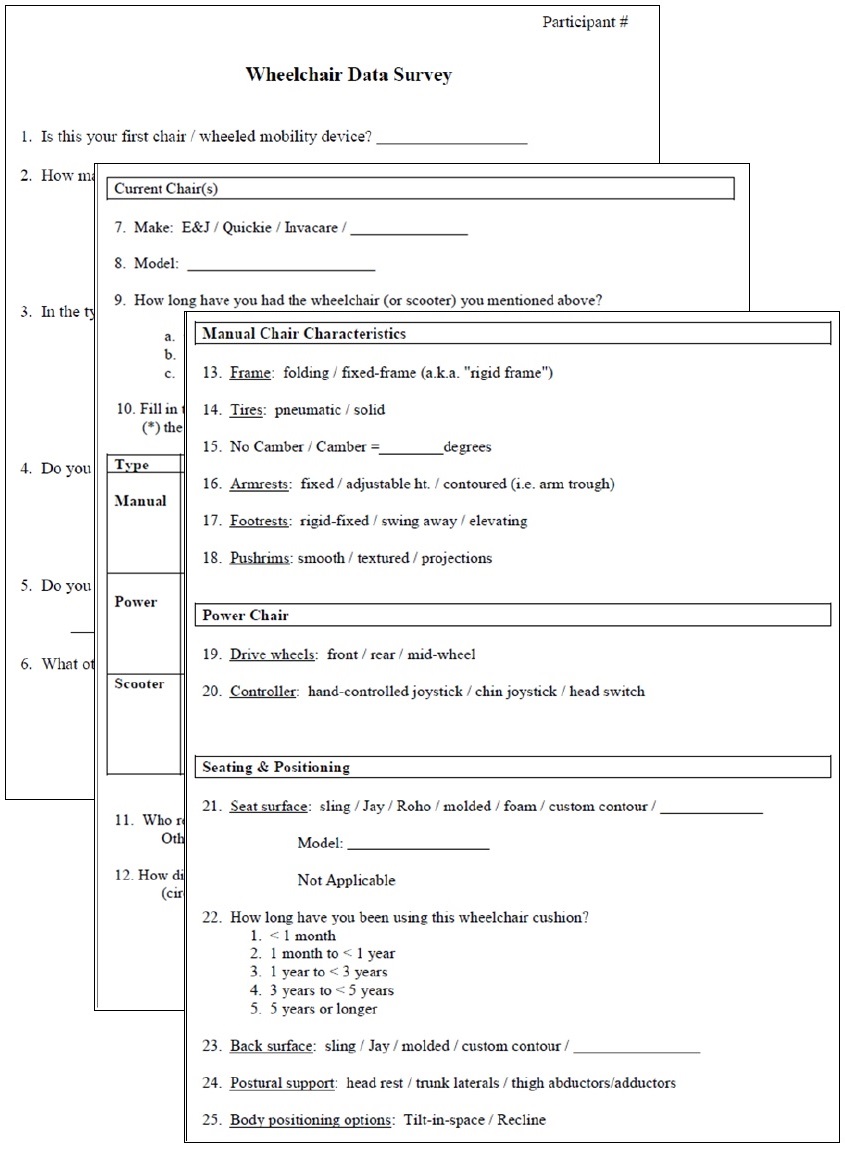
Figure 2-1. Portions of the checklist used to evaluate wheelchair characteristics
2.2.2 Structural Anthropometry (i.e. Body and WhMD Dimensions)
A three-dimensional (3-D) electromechanical probe (i.e. FaroArm, Faro Technologies Inc.) was used to record the 3-D location of body and WhMD device points (Figure 2‒2). The 3-D points were used to estimate body and WhMD heights, widths and depths and to construct static 3-D digital human models of WhMD users.
Figure 2‒2. Data collection with an electromechanical probe allows quick and accurate measurement of the widths, heights and depths of the body and mobility device characteristics.
The 3-D measurements required the measurement of reference points and planes, as well as the measurement of key body and WhMD points with respect to the environment. The IDeA Center has developed a detailed manual that defines each of the points in 3-dimensions, includes illustrations and explains applications for each of the points (Feathers et al., 2004). The reference points and planes, body points and WhMD points, and some of their application are listed in Tables 2‒1 and 2‒2.
Table 2‒1. Wheelchair and environment reference points and planes, and uses.

[Click image above to view HTML version]
Table 2‒2. Body points and important anthropometric dimensions associated with each point.

[Click image above to view HTML version]
2.2.3 Functional Reach
One-handed reach and lift capability data made at different heights, angles and object weights were collected in 3-D. Determining an individual’s 3-D reach envelope required that the reach envelope be measured relative to certain environmental, wheelchair and personal features (e.g. 3-D envelopes measured relative to a point on the floor, forward most portion of a person or wheelchair and/or from a reference point on wheelchair’s arm support surfaces). Data can be presented in 3-D, in the form of 2-D charts along key planes (e.g. sagittal plane to represent forward reach abilities), or described for a standard reach (e.g. maximum forward reach from a reference point).
The one-handed lifting tasks required individuals to move weighted cylinders that were empty or weighted with filler. Cylinders of 75 mm (3 in.) diameter were chosen because they required participants to use one-handed power or lateral pinch grasps, which are commonly used to hold and manipulate products. The size of the cylinders was held constant across conditions and participants. The four weight conditions were no weight, 1 lb, 3 lb and 5 lb.
Those individuals unable to grasp and/or lift any of the cylinders above shoulder height did not complete the reaches. Further, if a particular weighted canister could not be lifted above shoulder height then reaches involving that particular weight were avoided for reasons of participant safety.
Reaches and lifts were completed in 15 different directions (3 different angles of asymmetry from the orientation of the WhMD at 5 different heights). The angles of asymmetry included 0, 45 and 90-degrees from the sagittal plane that passes through the acromion process on the individual’s dominant side (i.e. forward, asymmetric and side reaches, respectively). The five heights were normalized to the individual's vertical reach capabilities so that reaches were performed at, above and below shoulder height.
Three-dimensional reach data were collected with the electromechanical probe (FaroArm, Faro Technologies). Use of the electromechanical probe required manually digitizing the 3-D location of the maximum reach point after the cylinder was positioned (Figure 2‒3). The point data were used to measure reach distances from reference points (e.g. maximum forward reach from the front of the WhMD, or maximum side reach from the lateral-most point of the WhMD), and construct reach envelopes that illustrate the reaching capabilities of the sample in 2-D and 3-D space.
A computation procedure was developed for performing analyses on reaches that involved combining 3-D reach information from the measured WhMD users in relation to a common reference plane. For instance, a vertical plane at the anterior-most point was used a reference to analyze forward reaches. This is similar to a wheelchair occupant facing a wall such that the forward-most aspect of their foot and/or wheelchair was touching the wall. Likewise, a vertical plane at the lateral-most point was used as a reference for analyzing lateral reaches, similar to a situation where a wheelchair occupant were right alongside a wall.
The percentage of WhMD users able to reach to or beyond a particular reference plane (either forward or lateral) was then computed. The data were analyzed in 100 mm (4 in.) increments from the floor. The reference planes could also be moved away or towards the occupant to simulate different obstruction depths to estimate the relative increase or decrease in reach capability. It should be emphasized that our data depict, in percentages, the reaching capabilities of only those individuals who could grasp and lift a particular cylinder above shoulder height.
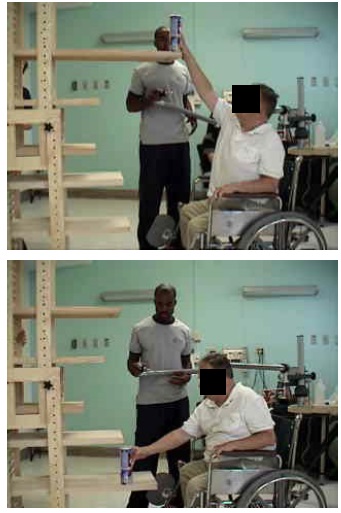
Figure 2‒3. Participants moved cylinders in 3 different directions at 5 different heights. Shown are forward reaches for two different heights. The electromechanical probe is used to record the 3-D location of the maximum reach distances from body and wheelchair reference points.
2.2.4 Maneuverability
WhMD users were video recorded while completing the following tasks:
• 90-degree turn,
• 180-degree turn with no restrictions on length of the maneuver,
• 180-degree with a center barrier,
• 360-degree rotation within a space with four walls.
The tasks were performed in restricted space conditions with the maneuvering performed within the confines of temporary barriers that are made of cardboard. Widths of the restricted space were set at a minimum of 750 mm (30 in.) for the 90-degree turn, 750 mm (30 in.) passage width for the U-turn with a barrier, and 1300 mm (51 in.) for the 180-degree and 360-degree turning activities.
WhMD users were asked to complete the tasks without touching the walls. The separation between walls was increased at increments of 50 mm (2 in.) if passage through the mock environment was not cleared without touching the walls (Figure 2‒4).
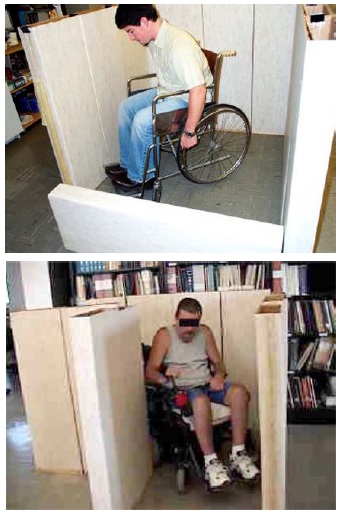
Figure 2‒4. Two examples of WhMD users completing restricted space experimental conditions.
2.2.5 Grip Strength
Four types of grip strength measurements for the dominant hand were assessed. These included a power grip with the elbow in full extension (i.e. shoulders flexed 90-degrees and upper extremity fully extended), power grip with the elbow flexed 90-degrees, lateral pinch (i.e. with the pinch gauge between the thumb pulp and the radial aspect of the forefinger), and thumb-forefinger pinch (i.e. with the pinch gauge between the tips of the thumb and forefinger). These measurements are important to the design of and/or standards development for some types of hand tools, hardware and electrical controls (e.g. scissors, some types of door latches, knob controls). Grip strength was recorded with manual hand and pinch dynamometers (Jamar, Inc). WhMD users were required to perform three maximal efforts in each of the four types of grips with their dominant hand, with the mean value considered as the maximal force value for analysis. Force measurements were not obtained for those WhMD users that were unable to perform a grip or exert a grip force, or declined from grip measurements (e.g. due to pain or discomfort in the hand). If the person could not complete all three force repetitions, force data for that particular grip was not included in the analysis.
Prior analysis of a subset of this data (D’Souza et al., in review) showed maximal power grip forces to be greater on average by approximately 1% to 5% with the arm in full extension as compared to with the elbow flexed 90-degrees on average across gender and mobility device type. In light of this marginal difference, only the power grip data measured with the elbow flexed 90-degrees along with data on pinch grips are included in this report. Additional analyses of this data to study potential differences in grip strength capabilities by age and medical condition that may clinical relevance have also been reported (e.g. Joseph et al., 2010).
2.2.6 Door Use
Our study of door use had three main objectives all intended to provide groundwork for future studies aimed at design guidelines and standards that would make doors more accessible to WhMD users:
1. Identify door use tasks that present WhMD users with the most difficulty,
2. Evaluate how different aspects of door design effect door use difficulty, and
3. Identify which WhMD user groups experience the greatest difficulties with doors.
The door use tasks required the use of three different doors in the building housing the IDeA Center. Trials in both directions were performed (i.e. from push and pull sides) using a forward approach. Each door presented different types of challenges to WhMD users. The door characteristics are summarized in Table 2‒3.

[Click image above to view HTML version]
For each trial, use of the door was divided into six task components: Opening Maneuver, Operating Latch, Opening, Through Passage, Closing Maneuver and Closing (See Figure 2‒5). For each phase, the level of difficulty experienced during each task was assessed using a 4 point scale and definitions previously developed and tested by Danford and Steinfeld (1999):
1. Minimal effort: The task was performed successfully on the first attempt, without an expression of frustration, smoothly without interruption, and in no more time than it would take for a member of the general population.
2. Moderate effort: The task was performed successfully on the first attempt, with no more than a brief expression of frustration and infrequent pauses or slight difficulties that increase the task time slightly as compared to a member of the general population.
3. Maximal effort: The task was performed successfully after multiple attempts, often with some expression of frustration and frequent pauses or difficulties that dramatically increases task time as compared to a member of the general population.
4. Impossible: The task was not performed successfully or there was a refusal to complete the task.
5. Blocked View: The effort could not be assessed due to visual obstruction between observer and WhMD user (e.g., door in the way for closing maneuvers, the WhMD user’s body orientation with the observer prevents an assessment).
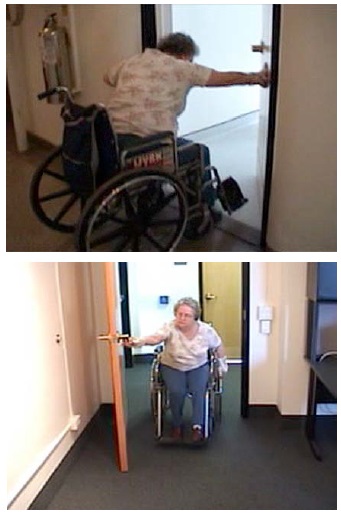
Figure 2‒5. Two examples showing physical requirements of door use for two of the doors used by WhMD users.
2.3 Analysis
2.3.1 Comparison of Demographic Characteristics of Our Sample and U.S. Population of WhMD Users
The size and functional abilities of WhMD users was hypothesized to differ significantly across gender, device type and age of the individual. A comparative analysis between our sample and the population of U.S. WhMD users provided information about the generalizability of our pooled results with the U.S. population of WhMD users. Demographic information about the U.S. population of WhMD users was obtained through summary reports of the 1994‒95 National Health Interview Survey on Disability (Flagg, 2009; Kaye et al., 2000).
The relative percentages of WhMD users stratified by gender, device type and age categories were compared between our sample and the U.S. population of WhMD users. Cases in which our sample was not considered representative on these variables suggest a “stratified analysis” (i.e. presentation of results for sub-samples, rather than the pooled data set) or other statistical modeling methods (e.g. Paquet et al., in preparation) would provide opportunities for a more valid application of our results to U.S. standards. Population-based data about percentage of WhMDs users with different types of disability were not available for the analyses.
2.3.2 Comparison of Demographic Characteristics of Subsamples by Data Collection Location
Because each of the data collection sites had access to different sub-populations of WhMD users and slightly different methods of participant recruitment, we believed it would be important to understand the differences in the demographic characteristics of the sub-samples of each site.
Therefore the relative percentages of WhMD users stratified by gender, device type and age categories were compared across the study’s three data collection sites.
2.3.3 Comparison of Dimensions with Standards and other Anthropometric Studies
The results of our study were compared to the Americans with Disabilities Act Accessibility Guidelines (ADAAG) and the Americans with Disabilities Act – Architectural Barriers Act Accessibility (ADA-ABA) Guidelines for Buildings and Facilities, standards of several countries and findings from several other large non-U.S. anthropometric studies of WhMD users. To identify the dimensions to compare, we first identified the relevant item in the U.S. standards to identify the common underlying anthropometric variables. Our analysis then focused only on those variables. The list below identifies the items in the standards and the anthropometric variables which were used for comparison:
• Unoccupied Device Width: Compared to the horizontal distance between the most extreme lateral points of the WhMD.
• Unoccupied Device Length: Compared to the horizontal distance between the most extreme posterior and anterior points of the WhMD.
• Clear Floor Space Width: Compared to Occupied Width.
• Clear Floor Space Length: Compared to Occupied Length.
• Seat Height, maximum: Compared to the vertical distance measured from the floor to the height of the seat support surface when occupied.
• Knee Clearance Height, minimum: Compared to the vertical distance measured from the floor to the superior aspect of the right knee.
• Toe Clearance Height, minimum: Compared to the vertical distance measured from the floor to the highest point on the right foot (i.e. higher of either the dorsal or distal foot point). This measure was only considered for manual and power wheelchair users.
• Knee Clearance Depth, minimum: Compared to the horizontal distance measured from the distal aspect of the right knee to the anterior-most point on the occupant and/or wheelchair. This measure was only considered for manual and power wheelchair users.
• Toe Clearance Depth, maximum: Compared to the horizontal distance measured from the dorsal aspect of the foot (i.e. crease of the foot and lower leg) to the anterior-most point on the occupant and/or wheelchair. This measure was only considered for manual and power wheelchair users.
• Wheelchair Turning Space to make a 90-Degree Turn: Compared to the maneuvering clearances required for performing a 90-degree (L-shaped) turn.
• Circular and T-shaped Wheelchair Turning Space: Compared to the maneuvering clearances required to make a 180-degree turn in a space confined on three sides.
• Wheelchair Turning Space to make a 180-Degree Turn around an Obstacle: Compared to the maneuvering clearances required to make a 180-degree turn around a center barrier.
• Circular and T-shaped Wheelchair Turning Space: Compared to the maneuvering clearances required to make a 360-degree turn in a space confined on all four sides.
• Forward Reach Height Lower and Upper Limits: Compared to the measured heights that WhMD user could reach beyond the anterior (forward) most point of the WhMD user or device.
• Side Reach Height Lower and Upper Limits: Compared to the measured heights that WhMD user could reach beyond the most lateral point of the WhMD user or device.
• Side Reach Height Lower and Upper Limits over an obstruction of 610 mm: Compared to the measured heights that WhMD user could reach 610 mm beyond the most lateral point of the WhMD user or device.
• Maximum Forces for Hand-operated Controls: Compared to the maximum hand grip strength in a power grip, and lateral and thumb-forefinger pinch grips.
In order to accomplish the comparative analysis with the standards and other studies, we reviewed ICC/ANSI A117.1 (2003) Accessible and Usable Buildings and Facilities, which serves as the model for the technical requirements in the federal guidelines in the U.S., the Americans with Disabilities Act Accessibility Guidelines (ADAAG) and its eventual replacement, the Americans with Disabilities Act – Architectural Barriers Act Guidelines (ADA-ABA). For the United Kingdom (U.K.), we reviewed BS 8300:2001 Design of Buildings and Their Approaches to Meet the Needs of Disabled People – Code of Practice. For Canada (CA), we reviewed B651‒04 Accessible Design for the Built Environment. For Australia (AUS), we reviewed AS 1428.2 – 1992 Design for Access and Mobility Part 2: Enhanced and Additional Requirements – Buildings and Facilities. Table 2.4 summarizes Accessibility Standards that were used for the comparisons.
Table 2.4 Comparison of Accessibility Standards across Four Countries.

[Click image above to view HTML version]
* This standard also includes an appendix with information on device size and maneuvering spaces for power chairs and scooters derived from the UDI research.
Since the findings of anthropometric research are often voluminous, journal articles and book chapters do not usually include a full documentation. Thus, we obtained the original research reports from Ringaert et al. (2001) from Canada, Stait et al. (2000) from the United Kingdom, Bails (1983) and Seeger et al. (1994) from Australia. The research underlying BS8300:2001 in the U.K. was summarized in an Annex to the standard itself but we were unable to obtain a more comprehensive report that described the details of the methodology. Each of the studies is briefly described below. See Steinfeld et al. (2010c) for a more complete summary of each.
In his study, Bails (1983) recruited participants from attendees at disability support centers and institutions. Eligible participants were between 18 and 60 years of age and used a manual or powered wheelchair. Scooter users were not included in the study. The research focused primarily on testing of full-size simulations of elements found in the built environment, such as doorways, environmental controls, furniture and fixtures that were configured to meet the Australian standards at the time.
Seeger et al. (1994) studied only device size. About 73% of the 240 individuals in the sample lived in nursing homes and other institutions. Forty-five percent were over 65 years old. Eleven percent used power chairs and 2% used scooters. Both unoccupied and occupied dimensions of device width and length were measured as well as a set of other basic dimensions. Measurements were taken manually using conventional measuring tools including a tape measure, steel square and spirit level.
The Department of Environment Transport and the Regions (DETR) (Stait et al., 2000) and the Department for Transport (DfT) (Hitchcock et al., 2006) studies were the two most recent in a series of three large-scale wheelchair anthropometry surveys conducted in the U.K. The studies were limited to the measurement of device size and weight. The DETR survey conducted in 1999, recruited participants solely at an exposition of equipment for people who use wheeled mobility devices for traveling around the community. The subsequent DfT survey was widened to include 12 schools and retail centers in the U.K., in addition to the 2005 Mobility Roadshow. Of the 745 participants in the DETR study whose data was acceptable, 59% used self-propelled manual chairs, 9% used attendant powered chairs, 25% used power chairs and 9% used scooters. Nine percent of the sample were judged to be 16 years of age or younger. The DfT study sample comprised of 1098 adults and 247 children. Among adults, 41% used self-propelled manual chairs, 10% used attendant-propelled wheelchairs, 27% used power chairs, and 22% used scooters. The DETR study used two photographs of each participant, while the DfT study employed seven photographs taken with a camera from pre-determined angles after participants wheeled into position on a scale. A checkerboard pattern on the floor and wall provided references to take measurements off the photographs. Although a wide variety of accessories were observed on the devices, they were not measured as part of the width calculation.
The research used as a basis for revisions to the U.K. BS8300:2001 standards covered clear floor area space requirements, knee clearances and maneuvering clearances. A total of 164 individuals were included in the sample but only 90 participated in the research on space allowances. Due to the lack of a full research report, it is not clear how the measurements were collected and, in many cases, the landmarks used to define them. From the information available, it appears that some scooters and attendant propelled chairs were included in the sample but it is not clear whether these individuals were included in the device or body measurements.
The Universal Design Institute (UDI) study (Ringaert et al., 2001) included a sample of individuals recruited from disability and senior organizations in Winnipeg by written invitation. Of the 50 participants, 35 (70%) used power chairs and 15 (30%) used scooters. The cause of disability for individuals in the sample included a wide range of conditions. Device size and maneuvering spaces were measured. All dimensions were taken to the extremes of the equipment including any object attached to the device like a ventilator. However, the actual landmarks on the devices were not well documented. Measurements were made with rulers and tape measures but no information is given on the accuracy and reliability of these techniques. Maneuvering trials were recorded using overhead video cameras while participants completed standardized movements in simulated environments built with plywood floors and wood framed dividers. Measurements were later taken off the videotapes although the method used to extract the measurements and the reliability of the technique was not described. An observer rating was used to determine successful trials.
The common variables were defined graphically in illustrations and with abbreviations, e.g. Knee Clearance Height (KCH), Knee Clearance Depth – Upper (KCD), and Extended Depth (ED). In many cases, variables underlying the U.S. standards are not included in other standards. Thus, in our comparisons, we omitted values for those variables. We did not, however, report variables from other standards that are not included in the U.S. standards.
The standards did not always use the same variables (or parameters), terminology or measurement conventions. For example, the U.S. standards include both Imperial and “soft” conversions to Metric units, but all the other standards are in Metric units only; there are at least three different terms used for a “wheelchair turning space”, and the U.K. standards report reach ranges for both a “maximum” and “minimum” reach while the U.S. standards have only one range delimited by a minimum and a maximum value.
These differences present several problems to researchers. For example, the definition of a “wheelchair turning space” determines the protocol used to study the clearance needed. Different results are obtained if that space is bounded or unbounded or whether the protocol calls for a smooth continuous turn or includes a series of smaller movements or allows either. Since the standards do not define variables clearly, researchers have made their own interpretations and developed different protocols to study the same variables. Thus, to make comparisons, we standardized all the values from standards and research as much as possible based on a common definition of variables and measurement conventions. We reported the U.S. values in both Imperial and Metric units but did not convert the other countries’ values to Imperial nor did we do “hard” conversions of the Imperial values found in the U.S. standards.
We then reviewed the research completed in each study. In many cases, this required some interpretation because the research studies did not always use the same terms or definitions as the standards in the respective country. Different approaches were also used to report findings. Some results were reported in percentiles. Other results were reported as minimum or maximum values. Still others were reported as the “percentage of subjects accommodated” – those who could perform a task at a certain criterion level.
We devised a graphic method to compare the results of the research studies to each other including our own and to the standards. Most of the studies reported at least a minimum or maximum value and a mean value for each variable studied. These three points were displayed on a graph and coded by study. Where available, percentile data were added to the graph in between the minimum and maximum values and the mean to provide more detail. All the values for each study that represented a distribution were connected by line segments.
For clarity, we pooled data for all mobility devices. However, this can confound comparisons across studies due to differences in the proportion of manual wheelchairs, power chairs, and scooters. Therefore, we also provided tabular data stratified by mobility device type.
2.3.4 Analysis of Door Use Difficulty
The measurement of door use performance was designed as a quasi-experimental study that involved systematically observing and coding WhMD user performance during door use tasks. It therefore required different analysis and comparison approaches.
First, an analysis of the demographic variables for the subset of WhMD users who completed the door use tasks was completed to describe the percentages of men and women, and types of WhMDs used in this sub-group. The mean, median and range of WhMD user age, occupied width, occupied length and maximum power grip were also reported as we thought that these variables might help explain the door use performance among the sub-group.
The level of difficulty experienced for each of the phases of door use was then compared across the three different doors and WhMD types for each of the tasks. Specifically, the percentage of each of the rating scores (minimum effort, moderate effort, maximum effort and impossible) was calculated for each of the three doors and six door use tasks. Those doors and door use tasks having a relatively large percentage of scores exceeding minimum effort were identified as potentially problematic, and a follow-up analysis of these conditions was performed to determine which WhMD user groups had the greatest difficulty with these tasks.
3.0 Study Findings
3.1 Comparison of Our Sample to U.S. Population of WhMD Users
Our sample of WhMD users was younger in age, had a much higher percentage of powered wheelchair users and a somewhat larger sample of male WhMD users than the estimated U.S. population of WhMD users (Table 3‒1). As stated in the previous section, we deliberately over-sampled powered device users in order to be able to accurately describe the anthropometric characteristics of this group. The higher frequency of male WhMD users recruited for this study is not very surprising as two of our data collection sites (Buffalo and Pittsburgh) recruited some of their study participants through VA medical centers that had extremely high percentages of male patients. As a result, our overall sample, when compared to the overall population of WhMD users is likely to have lower upper extremity and torso function, and be somewhat larger (i.e., taller, longer arms, wider, etc.). As stated in the previous chapter, these sample differences can be accounted for by stratifying the data by WhMD and/or by gender, or through the use of statistical modeling methods (Paquet et al., in preparation).
In terms of the medical conditions, Kaye et al. (2000) reported orthopedic impairments of the lower extremity (17% when combined with arthritis and other polyarthritis to conform with the classification used in the current study), cerebral vascular diseases (e.g. stroke, 11%), and central nervous system disorders (8%, including multiple sclerosis and cerebral palsy) as being the most frequently reported conditions leading to the use of a WhMD in the U.S. population. The most frequently reported medical conditions in our study were found to be central nervous system disorders (32%, including multiple sclerosis and cerebral palsy), spinal cord injuries (20%), cerebral vascular diseases (16%), followed by orthopedic impairments of the lower extremity (12%). The higher prevalence of spinal cord injuries in our study sample is expected given that two of the study locations recruited substantially through local VA medical centers.
Table 3‒1. Comparison of the percentages of WhMD users by gender, device type and age based on the estimated U.S. population of non-institutionalized WhMD users (Kaye et al., 2000) and our sample of WhMD users (n=495).

[Click image above to view HTML version]
3.2 Comparison of Sub-samples across Data Collection Sites
The primary purpose of expanding data collection to different sites was to increase the diversity of the overall sample. The Buffalo site, having recruited participants for close to 10 years had a relatively diverse sample of individuals recruited through the local Independent Living Center, a local VA medical center, and local adult care facilities. The Pittsburgh site recruited primarily through a local VA medical center. The Ithaca site recruited through local adult care facilities.
Not unexpectedly, large differences in WhMD users in terms of gender, age, years with disability and device type used were found (Table 3‒2). Pittsburgh had a much higher percentage of men WhMD users (73%) as compared to Ithaca (57%) and Buffalo (46%). It has been our experience that men are more likely to participate in the study, and the Buffalo site specifically targeted female WhMD users in our last phase of data collection to improve the representativeness of the data set in terms of gender. The median age of WhMD users was highest for the Ithaca site (74 years) followed by Buffalo (57 years) and Pittsburgh (44 years). Ithaca, and Buffalo in the later stages of data collection, recruited primarily from adult care facilities in order ensure that older WhMD users were well represented in the sample.
The disparities in the time WhMD users had their disabilities can also be explained by the differences in sampling approaches across the sites. By concentrating on veterans, the Pittsburgh site recruited WhMD users with disabilities for the largest number of median years (20 years) as compared to Buffalo (15 years) and Ithaca (10 years). This illustrates that the WhMD users recruited by Pittsburgh were more likely to experience their disability at an earlier age than the other two sites, while the WhMD users recruited by Ithaca were likely to have first experienced their disabilities at a much older age.
Table 3‒2: Gender, age and number of years with disability across sites.

[Click image above to view HTML version]
There were also large differences in the medical condition reported as being responsible for the need to use a WhMD across data collection sites (Table 3‒3). Pittsburgh by far had the largest percentage of spinal cord injured WhMD users and lowest percentage of orthopedic injuries and deformities. The greater percentage of acute injury related mobility impairments such as spinal cord injuries for the Pittsburgh site is expected given that most of its sample was recruited through a VA medical center. The Buffalo and Pittsburgh sites each had sub-samples with a diverse set of medical conditions.
Table 3‒3: Reported primary medical conditions among WhMD users across sites.

[Click image above to view HTML version]
* “Other” includes amputations, traumatic brain injuries, respiratory diseases and diabetes.
The disparities across the three sites in terms of the percentages of WhMD technologies were largest between the Ithaca and the other two sites (Table 3‒4). The Ithaca site measured a much higher percentage of manual wheelchair users than Pittsburgh and Buffalo, which is not surprising given the distribution ages and reported medical conditions for the Ithaca site.
Table 3‒4. Primary mobility device used among WhMD users across sites.

[Click image above to view HTML version]
Some of the research participants could not complete all of the functional anthropometric tests (i.e. grip strength, reach and maneuvering). The participation rates in these tests were evaluated for each of the sites. The participation rates for the reach and grip tests are summarized in Table 3‒5. Participation rates for the reach tests were lowest in Ithaca where the WhMD users tended to be much older than those of the other sites. The participation rates for the power grips were lowest in Pittsburgh, where there was the highest percentage of WhMD users with spinal cord injury.
Table 3‒5: Participation rates in the functional anthropometric tests for each site.

[Click image above to view HTML version]
3.3 Comparison of Dimensions with Standards and other Anthropometric Studies
3.3.1 Unoccupied Device Width
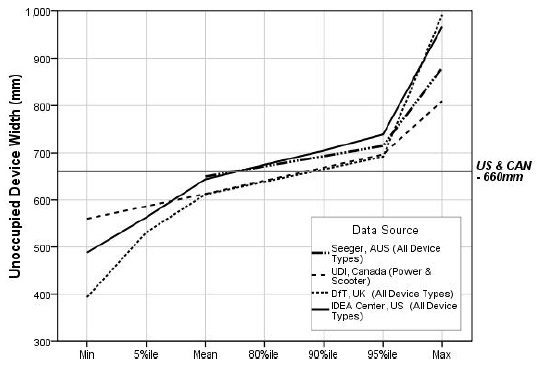
The unoccupied widths of devices were similar for the mean and 80th percentile values across research findings from different countries (Figure 3‒1). Our sample overall had, on average, larger mean and 80th percentile values for unoccupied device width than other countries. This was in part due to the larger percentage of powered wheelchair users and manual bariatric wheelchair users that were included in our study.
The unoccupied widths of devices used for the “reference wheelchair” described in the U.S. and Canadian standards are smaller than many of the WhMD users in our sample. For example, our results for mean unoccupied width are just under the U.S. standard reference wheelchair of 660 mm (26 in.). But, the widest device measured (a manual wheelchair) was over 300 mm (12 in.) wider than the U.S. standard’s reference wheelchair. The U.S. standards, generally accepted by the other countries, were derived from manufacturers’ data in the 1970’s and did not include many of WhMD technologies that are in use today.

[Click image above to view HTML version]
* Indicates data plotted in the graph.
Figure 3-1. Unoccupied WhMD width: research findings versus the standards.
3.3.2 Unoccupied Device Length
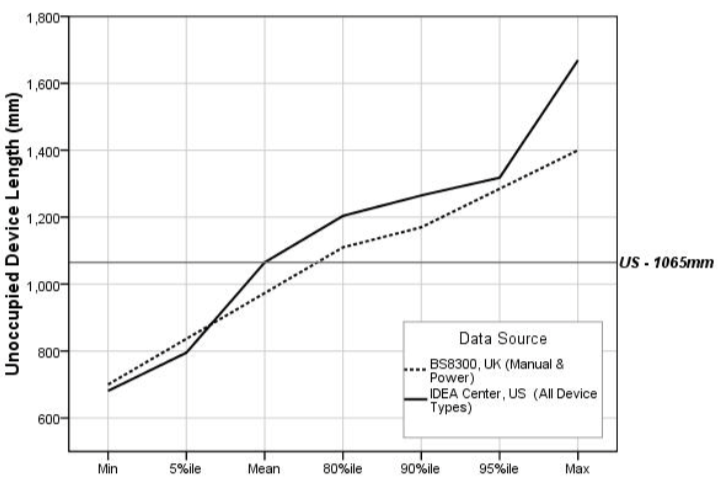
The unoccupied length of devices could be compared only between our study and the U.K. study (Stait et al., 2000). Our findings for mean, 80th percentile and 90th percentile values were somewhat larger than those of the comparison study (Figure 3‒2). This again was likely due to the larger percentage of powered wheelchairs and manual bariatric wheelchairs that were included in our study.
The unoccupied lengths of devices used for the “reference wheelchair” described in the U.S. standard equals the average value obtained from our overall sample. The mean unoccupied length for a powered wheelchair in our sample was 52 mm (2 in.) greater than the unoccupied length of the reference chair given in the standards, and the longest unoccupied length measured in our study was over 600 mm (23.6 in.) greater than the unoccupied length of the “reference wheelchair”!
There are a few reasons for the disparity in our unoccupied length data and the unoccupied length of the “reference wheelchair” currently provided in the standards. First, the available WhMD technologies of today are structurally different than those from which the standards were derived. For example, powered wheelchairs and scooters are generally longer than manual wheelchairs. Second, we measured the unoccupied length of the WhMD while it was in use; thus devices measured with elevated leg supports would be “lengthened.” Third, many of today’s mobility users attach accessories to the back of their device; we included the accessories in our length measurements.

[Click image above to view HTML version]
* Indicates data plotted in the graph.
Figure 3-2. Unoccupied WhMD length: research findings versus the U.S. standards.
3.3.3 Clear Floor Width
The findings on clear floor width are based on the findings on occupied width from anthropometric studies shown in Figure 3‒3. Neither the DfT or DETR studies collected data on occupied width but did measure the unoccupied device width. The authors argued that individuals can bring their arms and legs inboard when entering transportation vehicles and passing through doorways. We found, however, that many individuals do not have the physical ability to position their upper and lower extremities “inboard”. Moreover, in situations where an individual might remain stationery for a relatively long time, for example, at a concert or sporting event, it is unrealistic to assume that an individual would keep their upper and lower extremities in such a constraining position. The BS8300 research did not report occupied widths larger than 800 mm but the BS8300 standard, as we interpret it, requires an additional 100 mm (4 in.) more than that for the clear floor area width (900 mm). The BS8300 standard’s developers may have added 100 mm to provide additional maneuvering room at clear floor areas.
Due to recent revisions, the minimum required clear floor width standard in Australia and the U.K. now exceeds that in U.S. and Canada (Figure 3‒3). The U.K. standard accommodates the occupied widths of most everyone in all of the studies, except for a small sample of the largest widths measured in our study. Approximately 90% of manual wheelchair users, 85% of scooter users and 80% of powered chair users in our sample had occupied widths that were less than the U.S. clear floor width standard. Therefore, 10‒20% of individuals measured in our study have an occupied width that is greater than the U.S. standard of 760 mm (30 in.).
* Indicates data plotted in the graph.
Figure 3-3. Clear floor width (occupied width): research findings versus the standards.
3.3.4 Clear Floor Length
The mean value of clear floor length for our study (1250 mm or 49 in.) is above the clear floor length provided in the U.S. standards (1220 mm or 48 in.). Australian and U.K. have also recently increased the clear floor length standards (Figure 3‒4). The U.K. requirements for clear floor length exceed the U.S. by 130 mm (5 in.). The results of our study and other anthropometric studies support larger lengths to accommodate the vast majority of occupied WhMD lengths. The largest occupied lengths reported in all the anthropometric studies exceed the current standards, even the U.K. BS8300 standard of 1350 mm (53 in.). However, the results show that the 95th percentile values of occupied length are between 1250 mm. (49 in.) and 1480 mm (58 in.).
The difference between the maximum length in the UDI and Seeger studies and the others is so great that they are probably due to the presence of unusually large people and/or devices, or measurement error. The maximum length (occupied) recorded in the UDI study, for example, was over 2000 mm (6 ft.- 8 in.)! In the case of Seeger et al.’s work, we know that most of the sample was recruited from institutions and many may have had extended foot-rests or reclined backs on their chairs. No information was provided in the reports to assess whether individuals in either study could be considered outliers. For example, since the other studies together included over 1200 individuals and no other study reported a device as long as 2000 mm (78 in.), such a large value is likely a measurement error or a very rare occurrence. In fact, by coincidence, we met an individual who served as an advisor and participant in the UDI research. She recalled that there was one individual who had a “trailer” attached to her wheelchair that carried ventilator equipment which would not be required anymore due to advances in technology.
* Indicates data plotted in the graph.
Figure 3-4. Clear floor length (occupied length): research findings versus the standards.
3.3.5 Seat Height
Height dimension standards for seats prescribed in the Australian, Canadian and U.S. standards were very similar (480 mm or 18.9 in., 480 mm or 18.9 in. and 485 mm or 19 in., respectively). The values in the current standards for seat height are below the means for people we measured and those in the UDI study (Figure 3‒5). This is probably due to the increasing use of positioning systems, thick cushions and the availability of a wider range of wheel sizes since the 1970’s.
Comparisons of research findings on the seat heights for power chairs and scooters showed that mean seat heights measured in the UDI study were comparable to seat heights for the power chairs and scooters of our study; however, the differences grew larger toward the higher percentiles. Further, our study findings also revealed that occupied seat heights for manual chairs were much lower than seat heights for power chairs and scooters.
The reference points used for measurement can yield quite different results for seat height. The height of the seat can be measured at the edge and at the middle, under the cushion, on top of the cushion, etc. Thus, specifying exactly how it is measured is important for comparing results. We computed the occupied seat height by measuring a point underneath an individual’s buttocks using an extension of the electromechanical probe that we slipped in from the side between the occupant and seat interface. Our results would be different compared to other measurements not made in a similar manner.
* indicates data plotted in the graph
Figure 3-5. Seat height: research findings versus the standards.
3.3.6 Knee Clearance Height, minimum
Knee clearance heights for the four sets of standards range from 650 mm (25.6 in.) (Australia) to 700 mm (27.6 in.) (U.K.) (Figure 3‒6). The U.S. standard for knee clearance height is 685 mm (27 in.). The U.K. BS8300 results for knee clearance height suggest that current U.K. standard generally accommodates most wheelchair users in that country. In the case of the U.S. and Canadian standards, however, the level of accommodation drops to 80% in relation to measured knee heights among wheelchair users in their respective countries.
A review of photographs of participants in the IDeA sample indicated that the largest individuals are not always the ones who need the greatest knee clearances. Smaller individuals who have large thighs, those with high seats and scooter users also have high lap heights. Individuals with extended footrests and scooter users have deep knee clearances but not necessarily high knee clearances.
* Indicates data plotted in the graph.
** Does not include individuals with an above-knee right leg amputation (n=6) or with the right leg constrained in fully extended position (n=3) such as in an orthopedic cast.
Figure 3-6. Knee clearance height: research findings versus the standards.
3.3.7 Toe Clearance Height, minimum
There is relatively large disparity between the standards for toe clearance height, with the U.S. having the lowest (230 mm or 9 in.), followed by Australia (280 mm or 11 in.) and the U.K. (300 mm or 12 in.) (Figure 3‒7). Our study suggests that the standards required in each of the countries, do not accommodate the vast majority of WhMD users, especially in the U.S. The mean toe height for the overall sample of WhMD users in our study was 230 mm (9 in.).
In particular, the 80th percentile of toe clearance height for manual chairs (276 mm or 10 in.) suggests that over 20% of manual chair users exceed the minimum required toe clearance height of 230 mm (9 in.). Corresponding clearance heights for power chair users were typically greater than manual chair users, and with over half the sample exceeding the minimum toe clearance height requirement.
* indicates data plotted in the graph
** does not include individuals with a below-knee right leg amputation (n=10) or with the right leg constrained in fully extended position (n=3) such as in an orthopedic cast
Figure 3-7. Toe clearance height: research findings versus the standards.
3.3.8 Knee Clearance Depth, minimum
Knee clearance depths for the four sets of standards range from 200 mm (8 in.) in Canada to 280 mm (11 in.) in the U.S. (Figure 3‒8). None of the comparison studies used for this report provided anthropometric information about knee clearance depth. The results of our study suggest that a large percentage of WhMD users are not accommodated by the standards. The U.S. standard on knee clearance depth accommodated just over 50% of our overall sample, and was well below the 80th percentile values of maximum knee height for manual wheelchair users (369 mm or 14.5 in.) and power chair users (345 mm or 13.5 in.). Even fewer would be accommodated by the standards of the U.K., Australia and Canada. A knee clearance depth of over 400 mm (16 in.) is needed to accommodate close to 95% of our sample’s manual and powered wheelchair users.
* indicates data plotted in the graph
** does not include individuals with an above-knee right leg amputation (n=7) or with the right leg constrained in fully extended position (n=3) such as in an orthopedic cast.
Figure 3-8. Knee clearance depth: research findings versus the standards
3.3.9 Toe Clearance Depth, minimum
Toe clearance depths for the standards range from 150 mm (6 in.) in the U.S. to 230 mm (9 in.) in Canada (Figure 3‒9). None of the comparison studies used for this report provided anthropometric information about toe clearance depth. While the Canadian standard accommodates over 85% of our WhMD users, the U.S. standard accommodates fewer than 50% of our sample.
* Indicates data plotted in the graph.
** Does not include individuals with a below-knee right leg amputation (n=10) or with the right leg constrained in fully extended position (n=3) such as in an orthopedic cast.
Figure 3-9. Toe clearance depth: research findings versus the standards.
3.3.10 90-Degree Turn
While all of the standards compared in this report have requirements for “wheelchair turning spaces”, only the U.S. and Canada have requirements specifically for 90-degree or L-Turn clearances. These are similar for both countries, 915 mm (36 in.) and 920 mm (36.2 in.) for the U.S. and Canada, respectively.
The width required for all participants to complete a 90-degree turn in our sample was much smaller than the UDI findings (Figure 3‒10), due to differences in the abilities of people or/and WhMD technologies included in each of the studies or due to the different measurement procedures employed.
An increase in the 90-degree turning width criterion from 915 mm (36 in.) to 1000 mm (39 in.) would accommodate at least 95% of our sample. It also appears that there are some manual chair, power chair and scooter users who require much larger spaces than the 95th percentile values.
* indicates data plotted in the graph
Figure 3-10. 90-degree turning width: research findings versus the standards.
3.3.11 180-Degree Turn
The mean width required for all participants to complete a 180-degree turn in our sample was smaller than the UDI findings (Figure 3‒10), but our 95th percentile values for power chair and scooters users were larger than the maximum values obtained in the UDI study. The disparities are likely due to the differences in the studies described previously.
The space requirements for a 180-degree turn are similar across countries, ranging from 1500 mm (59 in.) in the U.K. and Canada to 1540 mm (60.6 in.) in Australia. The U.S. standard of 1525 mm (60 in.) accommodates just over 80% of the manual and powered wheelchair users, but less than 50% of the scooter users in our sample. An increase in the 180-degree turning width of at least 175 mm (7 in.) would be needed to accommodate 95% of manual and powered wheelchair users and 90% of the scooter users. Again, there are some manual chair users, power chair users and scooter users who require much larger spaces than the 95th percentile values, exceeding 500 mm (almost 20 in.) beyond the current U.S. standards!
* indicates data plotted in the graph
Figure 3-11. 180-degree turning width: research findings versus the standards.
3.3.12 180-Degree Turn around a Barrier
The U.S. has requirements for a 180-degree turn around a barrier that makes the width of the turn-around space dependent on the width of the passageway. If the barrier is less than 1220 mm (48 in.) wide, the standard calls for a minimum passage width of 1065 mm (42 in.) and a minimum turn-around space depth of 1220 mm (48 in.). If the passageway is narrower, the turn-around depth must be 1525 mm. (60 in.).
Our study was the only one of those compared in this report to evaluate 180-degree turning performance around the barrier. The results show that the current standards accommodate at least 90% of the powered chair users and manual wheelchair users, and almost 80% of the scooter users in our sample. However, they also demonstrate that the depth of the turn-around space could be reduced if the passageway width is at least 1095 mm. (43 in.).
* indicates data plotted in the graph
Figure 3-12. 180-degree turning width around barrier: research findings versus the standards.
3.3.13 360-Degree Turn
The standards on the space requirements for a 360-degree turn are quite similar across countries, ranging from 1500 mm (59 in.) in Canada and the U.K. to 1525 mm (60 in.) in the U.S.
Less than 50% of our manual and powered wheelchair users completed a 360-degree turn within the United States standard turning diameter (Figure 3‒12). None of our sample’s scooter users were able to complete a turn within the U.S. standard. In fact, the tightest 360 turn performed by a scooter user was 1900 mm (75 in.) in diameter! The 360-degree turning diameter would have to be increased to 2500 mm (a little over 98 in.) to accommodate our entire study sample.
In comparison, the UDI participants utilized a much larger space for the 360-degree turn in which no sides were blocked. A diameter of about 4200 mm (165 in.) would be needed to accommodate their entire sample. In our sample, scooter users overall require more space but the largest values for scooters, power chairs and manual chairs were very close. In the UDI sample, at least one power wheelchair user required a much larger clearance for the 360-degree turn (most likely the person with the “trailer” mentioned previously).
* indicates data plotted in the graph
Figure 3-13. 360-degree turning width area: research findings versus the standards.
3.3.14 Grip Strength
There were large differences in the percentage of individuals capable of completing the gripping tasks and, for those able to complete the tasks, the distribution of the grip strength for the three different grips were different between men and women, and across WhMD types (Figure 3‒14). For power grips, the percentage capable of completing three repetitions of maximal grips ranged from 77% (male power wheelchair users) to 100% (male scooter users). Overall, fewer WhMD users were able to complete the lateral pinching tasks (e.g. 73‒74% of power wheelchair users) and thumb-forefinger pinching tasks (e.g. 68‒69% of power wheelchair users).
For those individuals able to complete the pinching tasks, the results showed that both the ability to perform a grip and the magnitude of maximum grip force are substantially affected by the type of hand grip being considered. In particular, the magnitude of maximum power grip forces was noticeably greater in a power grip than in a pinch grip. Further, between the two pinch grip postures, the data show lateral pinch grips to be marginally greater than thumb-forefinger pinch grips.
Hand grip forces were typically greater for men than women, across users of the three different WhMD types. When compared across WhMD types, users of manual chairs typically produced the greatest magnitude of grip force, followed by scooter users and then lowest for power chair users. An exception to this trend was the lateral pinch grip forces among women. Not included in this analysis, are the effects of arm posture (e.g. elbow flexed at 90-degrees vs. an outstretched arm) (see D’Souza et al., in review), medical condition and age (see Joseph et al., 2010).
A comparison with the ADA-ABA permissible force limit for operating controls showed that more than 95% of the sampled WhMD users who were able to perform a power grip could exert a maximum power grip force exceeding 5 lbf.
However, the 5 lbf force limit substantially exceeds the 5%tile values of grip for the pinch postures. For the WhMD users who were able to perform a power grip in this study, approximately 25% of the WhMD users could not exert a maximum lateral pinch force that exceeded 5 lbf. About 25% of male WhMD users and 50% of female WhMD users could not exert a thumb-forefinger grip that exceeded 5 lbf.
* Percent capable indicate the percentage of the sample (grouped by gender and device type) capable of successfully forming a hand grip and exerting a force for three repetitions of the prescribed grip postures.
** 95th percentile value same as maximum value due to small sample size.
Figure 3-14. Grip force: research findings versus the standard.
* Percent capable indicate the percentage of the sample (grouped by gender and device type) capable of successfully forming a pinch grip and exerting a force for three repetitions of the prescribed grip type.
** 95th percentile value same as maximum value due to small sample size.
Figure 3-14. Grip force: research findings versus the standard. (Cont’d)
3.3.15 Reach
3.3.15.1 Forward reach – unobstructed
A large percentage of WhMD users in our study could not reach beyond the most forward point of their WhMDs or foot, and the difference between users of different types of WhMDs was very large (Figure 3‒15). For example, from among the 371 (75%) WhMD users in our study that could perform a reach task, only 78% of the manual chair users, 55% of the power chair users and 48% of the scooter users could reach beyond their mobility device or foot for at least one point between 600 mm (23.6 in.) and 1100 mm (43.3 in.) from the floor. Lower percentages in a forward reach for scooter users partially resulted from having to overcome a greater distance to reach over and/or around the front tiller, particularly at lower heights. Forward reaching capabilities for the three groups declined rapidly for heights above 1200 mm (47.2 in.) and below 600 mm (23.6 in.). Only 32% of our study’s manual wheelchair users, 22% of power chair users and 8% of the scooter users could complete forward reaches beyond the mobility device or foot at heights of 500‒600 mm (19.7‒23.6 in.). The lower limit of the U.S. standard would need to be raised from 380 mm (15 in.) to at least 600 mm (23.6 in.) in order to accommodate over 70%, 50% and 38% of our study’s manual wheelchair users, powered chair users and scooter users, respectively.
Figure 3-15. Forward reach: research findings versus the standard.
3.3.15.2 Side (lateral) reach - unobstructed
For WhMD users in our study that could perform a reach task, over 90% of each of the WhMD user groups could reach beyond the lateral most point of their WhMDs for heights between 800 mm (31.5 in.) and 1400 mm (55 in.) (Figure 3‒16) suggesting a marked improvement over a forward reach. Reach abilities began to drop at 600‒700 mm (23.5‒27.5 in.) and fell dramatically for all WhMD user groups at heights of 500‒600 mm (19.5‒23.5 in.). For heights of 500‒600 mm only 48% of manual wheelchair users, 32% of power wheelchair users and 22% of scooter users could complete a reach beyond the most lateral portion of their WhMD. In order to accommodate over 90% of the manual and powered chair users, and over 80% of the scooter users in our sample, a shift from 380‒1220 mm (15‒48 in.) to 700‒1400 mm (27.5‒55 in.) is needed. The improvement in side reaching performance with increased lower and upper limits as compared to the current standard is likely a function of larger (i.e. higher) WhMDs, and in some cases larger individuals who are now able to use WhMDs.
Figure 3-16. Side reach, unobstructed: research findings versus the standard.
3.3.15.3 Side (lateral) reach – over an obstruction depth of 610 mm
The vast majority of WhMD users in our study that displayed some reach capability could not reach at or beyond a 610 mm (24 in.) obstacle, regardless of height (Figure 3‒17). There were also differences between users of different types of WhMDs. For heights that approximated the U.S. standard of 1170 mm (46 in.), only 31% of the manual wheelchair users, 24% of the power wheelchair users and 13% of the scooter users could reach 610 mm (24 in.) beyond the most lateral point of the WhMD. The results suggest that the recommended maximum depth of 610 mm (24 in.) obstruction would need to be reduced significantly in order to accommodate a majority of our study’s WhMD users.
Figure 3-17. Side reach, beyond a 610 mm obstruction: research findings versus the standard.
3.3.16 Door Use
A total of 144 WhMD users completed door use tasks for at least one of the doors. In some cases, WhMD users were not able to complete tasks involving other doors due to scheduling issues (i.e., lack of time) and building renovations.
The differences in the sub-sample composition compared to the overall sample on demographic and anthropometric variables were generally small. Table 3‒5 summarizes the descriptive statistics for the sub-sample. The sub-sample was on average younger than the overall sample (see Table 3‒2). The differences in age are not unexpected since latter data collection efforts in Ithaca and in Buffalo involved targeting older adults who were not measured at the IDeA Center and therefore could not complete the door use tasks. Differences between the gender composition, occupied width, occupied length and maximum power grip strength were fairly modest. For example, the mean occupied width of the sub-sample was 10 mm (0.4 in.) less than the occupied width of the overall sample, and the occupied length of the sub-sample was only 6 mm (0.2 in.) less than the overall sample (See Figures 3‒3 and 3‒4).
Table 3-5. Descriptive statistics for the sub-sample that completed the door use tasks.

[Click image above to view HTML version]
The “Opening Maneuver” and “Operating Latch” door use tasks posed difficulties for very few WhMD users, requiring “minimal effort” for more than 85% of the trials (Table 3‒6 a-b). Door use tasks that were found to present WhMD users with difficulty were “Opening”, “Through Passage”, “Closing Maneuver” and “Closing”. For these tasks, a significant percentage of trials were rated at “maximal effort” or “impossible” for at least one of the three doors (Table 3‒6 c-f).
WhMD users had more difficulty “Opening” door 3, as compared to doors 1 and 2. Fifty-two percent of the pushing trials were rated at “maximal effort” or “impossible” for door 3, as compared to 12% for door 1 and 9% for door 2 (Table 3‒6 c). Forty percent of the pulling trials were rated at “maximal effort” or “impossible” for door 3, as compared to 13% for door 1and 27% for door 2. The additional effort required of door 3 for the “Opening” task was expected because door 3 had a mechanical closer that had a resistance of 7‒8 lb-f.
A higher percentage of WhMD users also had greater difficulty with “Through Passage” for door 3 than doors 1 and 2. Forty-four percent of the pushing trials were rated at “maximal effort” or “impossible” for door 3, as compared to 11% for door 1 and 6% for door 2 (Table 3‒6 d). Eighteen percent of the pulling trials were rated at “maximal effort” or “impossible” for door 3, as compared to 14% for door 1 and 11% for door 2. This was expected because of the closer and also because door 3 had a 6 mm (1/4 in.) threshold, and was the narrowest of the three doors (755 mm or 29.75 in.). The door most often rated as requiring “minimal effort” was door 2. It did not have a closer or threshold and was the widest (1040 mm or 41 in.). The presence of the closer requires the user to continue to apply pressure to the door while passing through the opening.
The “Closing Maneuver” presented problems to WhMD users for each of the 3 doors studied. “Closing Maneuver” was rated at “maximal effort” or “impossible” for 36%, 26% and 100% of the pushing trials and 57%, 42%, and 100% of the pulling trials for doors 1, 2 and 3, respectively (Table 3‒6 e). However, the very high number of “blocked view” trials for door 3 (103 for pushing and 100 for pulling) is worth noting. Trials for this door were often not observable when the participant successfully passed through the door to the space beyond because the mechanical closer closed the door while the researcher remained on the side of the door where the trial started. Most, if not all, of these trials would have required minimal effort. If the “blocked view” trials for door 3 were categorized as either “minimal” or “moderate” effort, then only small percentage of the trials (19% for pushing) and (4% for pulling) would have been rated as “maximal effort” or “impossible” for the “Closing Maneuver).
Similar results were found for the “Closing” task, although this task was the one likely to be rated as “maximal effort” or “impossible” (Table 3‒6 f). One interesting finding, however, was that “Closing” trials were more likely to be rated as “minimum effort” for door 2 than door 1, despite door 2 being 215 mm (8.5 in.) wider than door 1. The difference in rating was therefore more likely to have been influenced by the latch side clearance than door size, especially on the pull side. Door 1 only had a 76 mm (3 in.) latch side clearance.
Differences in observed ratings of effort were also found between different device types for some of the door use tasks. For example, “Closing” trials involving scooter users were more likely to be rated “minimum effort” than trials involving manual or powered chairs for doors 1 and 2 (Table 3‒7 a, b). This may be because scooter users in general have greater upper extremity function and strength and can more easily close doors than those who use manual or powered wheelchairs.
| Table 3‒6 Observed level of effort for each of the tasks (a-f). | ||||||
| a. | ||||||
| Opening Maneuver | Push | Pull | ||||
| Door 1 | Door 2 | Door 3 | Door 1 | Door 2 | Door 3 | |
| Minimum effort (1) | 92% | 94% | 92% | 88% | 94% | 92% |
| Moderate effort (2) | 3% | 2% | 1% | 5% | 4% | 2% |
| Maximal effort (3) | 5% | 3% | 6% | 7% | 2% | 5% |
| Impossible (4) | 0% | 0% | 1% | 0% | 0% | 0% |
| Subtotal sample size (rated) | 119 | 89 | 101 | 121 | 114 | 92 |
| Blocked view (5) | 25 | 39 | 26 | 21 | 14 | 12 |
| Missing data | 0 | 16 | 17 | 2 | 16 | 40 |
| Total sample size | 144 | 144 | 144 | 144 | 144 | 144 |
| b. | ||||||
| Operating Latch | Push | Pull | ||||
| Door 1 | Door 2 | Door 3 | Door 1 | Door 2 | Door 3 | |
| Minimum effort (1) | 86% | 92% | 87% | 94% | 94% | 91% |
| Moderate effort (2) | 5% | 4% | 5% | 4% | 3% | 5% |
| Maximal effort (3) | 7% | 4% | 8% | 2% | 3% | 3% |
| Impossible (4) | 3% | 0% | 1% | 0% | 0% | 1% |
| Subtotal sample size (rated) | 104 | 106 | 119 | 109 | 103 | 88 |
| Blocked view (5) | 40 | 22 | 8 | 33 | 25 | 16 |
| Missing data | 0 | 16 | 17 | 2 | 16 | 40 |
| Total sample size | 144 | 144 | 144 | 144 | 144 | 144 |
| c. | ||||||
| Opening | Push | Pull | ||||
| Door 1 | Door 2 | Door 3 | Door 1 | Door 2 | Door 3 | |
| Minimum effort (1) | 60% | 72% | 28% | 67% | 50% | 19% |
| Moderate effort (2) | 28% | 20% | 20% | 20% | 23% | 41% |
| Maximal effort (3) | 9% | 9% | 39% | 13% | 27% | 37% |
| Impossible (4) | 3% | 0% | 13% | 0% | 0% | 3% |
| Subtotal sample size (rated) | 141 | 123 | 127 | 140 | 128 | 103 |
| Blocked view (5) | 3 | 22 | 8 | 33 | 25 | 16 |
| Missing data | 0 | 16 | 17 | 2 | 16 | 40 |
| Total sample size | 144 | 144 | 144 | 144 | 144 | 144 |
| d. | ||||||
| Through Passage | Push | Pull | ||||
| Door 1 | Door 2 | Door 3 | Door 1 | Door 2 | Door 3 | |
| Minimum effort (1) | 58% | 69% | 22% | 55% | 67% | 50% |
| Moderate effort (2) | 31% | 25% | 33% | 30% | 22% | 32% |
| Maximal effort (3) | 7% | 6% | 25% | 13% | 10% | 14% |
| Impossible (4) | 4% | 0% | 19% | 1% | 1% | 4% |
| Subtotal sample size (rated) | 144 | 127 | 126 | 141 | 127 | 102 |
| Blocked view (5) | 0 | 1 | 1 | 1 | 1 | 2 |
| Missing data | 0 | 16 | 17 | 2 | 16 | 40 |
| Total sample size | 144 | 144 | 144 | 144 | 144 | 144 |
| e. | ||||||
| Closing Maneuver | Push | Pull | ||||
| Door 1 | Door 2 | Door 3 | Door 1 | Door 2 | Door 3 | |
| Minimum effort (1) | 37% | 45% | 0% | 21% | 33% | 0% |
| Moderate effort (2) | 27% | 29% | 0% | 22% | 25% | 0% |
| Maximal effort (3) | 32% | 25% | 0% | 53% | 40% | 0% |
| Impossible (4) | 4% | 1% | 100% | 4% | 2% | 100% |
| Subtotal sample size (rated) | 144 | 122 | 124 | 137 | 124 | 4 |
| Blocked view (5) | 0 | 6 | 103 | 5 | 4 | 100 |
| Missing data | 0 | 16 | 17 | 2 | 16 | 40 |
| Total sample size | 144 | 144 | 144 | 144 | 144 | 144 |
| f. | ||||||
| Closing | Push | Pull | ||||
| Door 1 | Door 2 | Door 3 | Door 1 | Door 2 | Door 3 | |
| Minimum effort (1) | 37% | 42% | 0% | 13% | 23% | 0% |
| Moderate effort (2) | 17% | 31% | 0% | 11% | 16% | 0% |
| Maximal effort (3) | 40% | 26% | 0% | 66% | 56% | 0% |
| Impossible (4) | 6% | 1% | 100% | 10% | 5% | 100% |
| Subtotal sample size (rated) | 142 | 125 | 24 | 136 | 122 | 4 |
| Blocked view (5) | 2 | 3 | 103 | 6 | 6 | 100 |
| Missing data | 0 | 16 | 17 | 2 | 16 | 40 |
| Total sample size | 144 | 144 | 144 | 144 | 144 | 144 |
| Table 3‒7 Observed level of effort for the “Closing” task by WhMD (a-b). | |||||||||
| a. Level of effort for the closing task by type of mobility device | |||||||||
| Closing - Push | Door 1 | Door 2 | Door 3 | ||||||
| Man-ual | Power | Scoot-er | Man-ual | Power | Scoot-er | Man-ual | Power | Scoot-er | |
| Min-imum effort (1) | 33% | 35% | 56% | 42% | 37% | 53% | 0% | 0% | 0% |
| Mod-erate effort (2) | 17% | 16% | 19% | 30% | 33% | 33% | 0% | 0% | 0% |
| Maximal effort (3) | 43% | 41% | 25% | 28% | 28% | 13% | 0% | 0% | 0% |
| Im-possible (4) | 7% | 8% | 0% | 0% | 2% | 0% | 100% | 100% | 100% |
| Sub-total sample size (rated) | 75 | 51 | 16 | 67 | 43 | 15 | 17 | 5 | 2 |
| Blocked view (5) | 2 | 0 | 0 | 1 | 2 | 0 | 51 | 40 | 12 |
| Missing data | 0 | 0 | 0 | 9 | 6 | 1 | 9 | 6 | 2 |
| Total sample size | 77 | 51 | 16 | 77 | 51 | 16 | 77 | 51 | 16 |
| b. | |||||||||
| Closing - Push | Door 1 | Door 2 | Door 3 | ||||||
| Man-ual | Power | Scoot-er | Man-ual | Power | Scoot-er | Man-ual | Power | Scoot-er | |
| Min-imum effort (1) | 12% | 11% | 25% | 18% | 24% | 43% | 0% | 0% | 0% |
| Mod-erate effort (2) | 11% | 9% | 19% | 20% | 12% | 14% | 0% | 0% | 0% |
| Max-imal effort (3) | 67% | 72% | 44% | 61% | 55% | 36% | 0% | 0% | 0% |
| Im-possible (4) | 10% | 9% | 13% | 2% | 10% | 7% | 100% | 100% | 0% |
| Sub-total sample size (rated) | 73 | 47 | 16 | 66 | 42 | 14 | 2 | 2 | 0 |
| Blocked view (5) | 3 | 3 | 0 | 2 | 3 | 1 | 51 | 39 | 10 |
| Missing data | 1 | 1 | 0 | 9 | 6 | 1 | 24 | 10 | 6 |
| Total sample size | 77 | 51 | 16 | 77 | 51 | 16 | 77 | 51 | 16 |
Section 4.0 Implications for Standards and Design
4.1 Introduction
The research demonstrated that there is a need to revise the standards for wheeled mobility access to reflect the body structure and functional abilities of this population and the devices they use today. The U.S. standards are in greater need of change but the basis for many of the changes previously made to the standards in Canada, the U.K. and Australia can also be questioned in light of the research findings. Findings must be evaluated very carefully when used to make changes to standards. In particular, the impact of the methods used in research on findings needs to be studied in depth. Yet, the consistency of trends across the various research studies is quite good, given the wide variety of methods used.
One obvious example of the need to revise standards is that WhMD users who require the highest knee clearances cannot be accommodated without making some radical changes to the design of counters, drinking fountains and other design features where knee and toe clearance is provided specifically to provide accessibility. Policy makers have to make a decision about who should be accommodated by knee and toe clearances or identify alternative solutions like providing side access as well as front access or at least one fully accessible unit in a building or department. The results clearly provide evidence that adjustable and adaptable counters are a valuable design strategy. They suggest that more emphasis should be placed on adjustability and that the range of adjustment should be fairly large.
As a second example, the reach limits also require some significant rethinking. The idea that a control or operable hardware located on a plane in front of the user can be accessible with a forward reach, regardless of the height, is not substantiated by this research. Knee and toe clearance must be provided under the plane of the device so that WhMD users can get closer to their target in order to provide an accessible forward reach. The safety problems we noted for low side reach questions the use of low side reach limits in accessibility standards. This reach limit should be used to identify the low range of safe reach but not to specify the location of all outlets or other devices. The result would be that outlets and other devices would all be so high that they would be dysfunctional. As an alternative, perhaps one outlet in a room or a work station area could be required to be within the safe reach range.
A third example is that the reference WhMD that has been used as the basis for standards, as depicted in the U.S. ADA-ABA, AS1428 and BS8300:2001 are manual wheelchairs. The Canadian standard, however, includes illustrations and data on scooters and power wheelchairs. This information can be very valuable to designers who are seeking to ensure full accessibility beyond minimum required levels and should be included in all accessibility standards. Designers could benefit from more information on device size to plan spaces like storage areas for wheelchairs, the design of counter edges in relationship to armrests, spaces, elements not explicitly covered by standards and new products. Additional illustrations and data are needed to convey the diversity in the devices and their occupants, especially other types of WhMDs.
To provide realistic guidance for designers, information on wheeled mobility dimensions should include occupied sizes as well as device size; both in percentile form, and also include accessories as they are used in everyday life. Occupied device sizes are clearly preferable and more useful for designers than unoccupied sizes but it is not uniformly provided in the standards. For example, the U.S. standards are inconsistent, showing occupied length but unoccupied width. Although data on device sizes is available from manufacturers, it does not include actual dimensions as set up for individuals nor does it provide data on added equipment like seating systems, cushions, control boxes, ventilators, carrying baskets and other accessories. The studies reviewed for our comparative analysis did not always include accessories as part of their dimensions and measurements (e.g. Stait et al., 2000; Hitchcock et al., 2006). A more comprehensive list of key findings can be found later in this section.
4.2 Applications of Findings in Design and Standards Development
It is unrealistic to assume that standards and designs should accommodate every single individual in the world. A decision always has to be made to draw the line somewhere because there are diminishing returns in terms of benefits and increased costs associated with expanding the target population for design. Even dimensions that accommodate our entire sample might not accommodate someone who is larger or smaller than the people we measured.
The recommendations in this section, in most cases, are based on accommodating all but 5% of the WhMD sample we studied. We believe that this is a reasonable target and a cost effective approach because it will benefit everyone in most cases, even people without disabilities. Also, the changes required are often minimal and the cost is usually only a small percentage of total building costs, if any. It generally means increasing dimensions in existing standards by 2‒6 inches. However, there are some cases in which the implications are much broader, for example, length of clear floor area, knee and toe space clearances, 360-degree turning space, and front reach limits. In these cases, we believe that the existing knowledge base at the time that the standards were developed led to guidelines conceived in a way that is not appropriate for the current era. At the time, standards developers had limited data on a limited population. Since that time, the problem has been compounded by significant changes in the population and mobility technologies. Thus, rather than making revisions to design criteria that are based on ideas that are completely obsolete, in our recommendations we sought to identify innovative solutions to provide increased accessibility without a major cost impact. In other cases, we deferred making recommendations for further study, and when possible we have proposed several options that could be considered.
The decision to adopt these recommendations is really up to others. Policy makers and standards developers could decide that some of our recommendations are not cost effective. In other words, for the cost required, they would benefit a relatively small group of people. But, it is important that those involved in such decisions be fully informed about the impact of their decisions. To help stakeholders understand the implications of the findings and of the decisions they might make based on our work, we have prepared charts that demonstrate the degree to which our sample is accommodated by any particular dimension listed in the current accessibility standards. These “accommodation models” provide easy to use tools for standards developers and design professionals; in particular, they help to understand the degree to which their decisions will exclude use by some part of the WhMD user population.
We developed separate accommodation models for the three types of WhMDs covered in our study so that stakeholders can understand the differences and similarities across device types. In our research, we oversampled power wheelchair users in order to better characterize their sizes and functional abilities and to more accurately identify differences in performance between that group and the others. Manual wheelchair users represent a much larger proportion of the entire population of WhMD users than either power chair users or scooter users. Thus, accommodating a larger proportion of the latter two groups has less of an impact overall than accommodating a larger proportion of manual chair users. The full set of charts is found in Appendix 3. In addition to these accommodation models, we have also developed an interactive software application that allows stakeholders to access the entire dataset in a variety of useful ways. This tool could be very useful to standards developers and designers with the assistance of our research team. It is described in the next section (5.0) in more detail.
The design and standards implications of our findings are presented below. By organizing all the implications in one place, readers who are not interested in the research details can obtain a comprehensive understanding of the results.
4.3 Specific Recommendations
4.3.1 Reference WhMD Users
The original ADAAG included, in its Appendix, only one reference WhMD user – a male in a manual wheelchair, while the ADA-ABA does not have any. Our results demonstrate that the WhMD population is quite diverse in terms of sizes and functional abilities and that there are significant differences between users of different types of WhMDs. Including Reference WhMD Users in the document helps designers and officials understand the basis for many design criteria in standards and also to address design issues that may not appear in the standards at all. Having a set of multiple Reference Users as opposed to one can benefit designers significantly, and our data can be used to develop many different Reference WhMD Users. We recommend that at minimum three be provided, one each for manual wheelchairs, power wheelchairs and scooters. The Reference Users should include plan and elevation drawings and have key dimensions coded with a corresponding table of values for each code showing the 5th, 25th, 50th, 75th and 95th percentile for both men and women. At minimum, the Reference WhMD Users should have data on unoccupied and occupied length and width, total occupied height, eye height and armrest height. They should also have data on accessories and equipment often attached to WhMD.
Three examples illustrate the need for the incorporation of this information in standards:
1. Occupied Height: Information on the occupied height of WhMDs is often needed in design of amusement attractions, playground equipment, museum exhibits and vehicles.
2. Lines of Sight: Currently, the ADA-ABA has requirements for clear sight lines from seating areas reserved for WhMD users. But, there are no anthropometric data provided to evaluate compliance with those requirements. Basic data on eye height is needed in the standard to help designers determine whether lines of sight are adequate.
3. Armrest height: The height of armrests on WhMD is useful for design of work stations, dining areas and other equipment and furnishings that WhMD users approach as close as possible. A Reference WhMD User could provide that information which is currently unavailable.
Tables showing results from the structural measurements of these three dimensions are provided in Appendix 2.
4.3.2 Seat Height
Seat height is an important dimension for establishing the height of built-in seating, toilet heights, tub heights, shower seat heights and other transfer related surfaces. Keeping the height of a transfer surface close to the height of a wheelchair seat reduces the effort necessary to transfer and provides a safer environment, especially in bathing and toilet rooms. However, seat height for wheelchair users can be significantly different than comfortable seat height for ambulant people. Seat heights for transfer surfaces in the ADA-ABA are 430 mm - 485 mm (17 in. - 19 in.) for water closets, shower seats and tub seats and 405 mm - 485 mm (16 in. −19 in.) for pool transfer lifts.
Our research results indicate that a range of seat heights is appropriate to accommodate the wide variety of different needs. Ranges for built elements should accommodate ambulatory individuals as well because they are the vast majority of the population. Designing only for WhMD users would cause discomfort and safety problems for too many people. Our findings show that the values of the current U.S. accessibility standards are below the mean values of each of the three WhMD user groups. The mean occupied seat heights were 495 mm (19.5 in.) for manual chair users, 538 mm (21.2 inches) for power chair users and 549 mm (21.6 in.) for scooter users. For the manual chair users, the 5th −95th percentile range was 430 mm - 566 mm (17 in. - 22.3 in.). Therefore, the current accessibility standards are more accommodating to those WhMD users with low occupied seat heights. If the goal is to accommodate the mean seat height for each of the WhMD user groups, a range of 495 mm – 549 mm (19.5 in. - 21.6 in.) is likely to be more accommodating. An application of these results could be in the design of fixed toilet heights. If the goal is to accommodate the 5th percentile occupied manual chair user seat height and the 95th percentile scooter user seat height, a range of 430 mm - 635 mm (17 in. - 25 in.) is needed. Conventional seating heights are within a ranch of 381 mm - 406 mm (15 in. −16 in.) for adults. Thus, designing even for the range of WhMD users would cause a problem for everyone else. This finding suggests that the solution to the problem should be sought in technology rather than building standards, just like it has with ergonomic office chairs. The findings could be applied to establish the range of height adjustable seat and support surfaces. Meanwhile, we recommend that the current top of the acceptable range be increased to 508 mm (20 in.) and that consideration be given to providing an assistive technology solution, a seat riser, in temporary lodging settings.
4.3.3 Clear Floor Area
Clear floor area dimensions are the basis for the minimum required size of spaces used by wheeled mobility users (e.g. platform/wheelchair lifts) and for spaces/locations that are designated for wheeled mobility users such as in seating areas of movie theatres and sports stadiums and in securement spaces of vehicles like transit buses. The clear floor area width also informs the minimum clearance width for successful passage through corridors, doorways and ramps. In some of these applications, adding more space for maneuvering may be required.
The accommodation model (Figure 4‒1) illustrates the 50th, 75th, 90th and 95th percentile values for the research results computed for occupied length and width across manual chair, powered chair and scooter users using data from our study. The 95th percentile dimension values for occupied length and breadth provide a reasonable threshold value for determining the dimensions for clear floor area length and breadth. Details about the measurement methodology and study sample can be found in (D’Souza et al., 2010b; Steinfeld et al., 2010a; 2010b).
To accommodate the 95th percentile values of both occupied width and length requires a minimum clear floor area dimensions of 786 mm x 1362 mm (31 in. x 54 in.) for manual chairs, 827 mm x 1415 mm (33 in. x 56 in.) for powered chairs, 837 mm x 1435 mm (33 in. x 56 in.) for scooters. These sets of dimensions are most applicable when the objective is to accommodate one of the dimensions, i.e., either occupied length or occupied width. For example, when designing an alcove at the side of a large open space where the length of a device must be addressed but the width is not an issue because there is plenty of room to one side.
But, one individual may have a very wide occupied length but narrow occupied width. Thus, use of results from an analysis that considers both dimensions at once when computing percentiles (a bi-variate approach) is more preferable when the goal is to accommodate 95% of the total population (see D’Souza et al., 2010b). Using this method, the minimum clear floor area dimensions recommended for accommodating 95% of the WhMD users based on a bi-variate analysis are: 820 mm x 1420 mm (32 in. x 56 in.) for manual chair users, 850 mm x 1480 mm (33.5 in. x 58 in.) for powered chair users, and 860 mm x 1440 mm (34 in. x 57 in.) for scooter users.
For applications where all of three types of mobility devices (i.e., manual chair, powered chair and scooters) need to be accommodated, the largest of the occupied length and width values across the three device categories should be used. Thus, a “universal space” to accommodate 95% of the total population would be 860 mm x 1480 mm (34 in. x 58 in.).
The implications of these dimensions are that most of the current dimensions used in the ADA-ABA are inadequate for the larger mobility device users, especially power chair and scooter users. The basic clear floor space requirement, 760 mm x 1220 mm (30 in. x 48 in.), should be increased. However, the required wheelchair seating space sizes in public assembly areas are actually about the same size as the “universal space” with one exception, the front or rear entry condition. The depth of this space should be increased from 1220 mm (48 in.) to 1480 mm (58 in.), or, to be consistent with the side entry condition, 1525 mm (60 in.) required by the ADA-ABA. While this would still make it a tight fit for maneuvering into the space for the largest users, it would only inconvenience a few people. Requiring some rear or front entry seating areas in each facility could be an alternative strategy.
Where aisles and other spaces adjoin the clear floor area, the real need for the “universal space” may be minimal. For example, the occasional very long occupied device can be accommodated without too much inconvenience to people passing by or interference with minimum egress requirements. Also, where several wheelchair seating spaces are provided at once, it is unlikely that all the occupants approach or exceed the 95th percentile in both length and width. In other words, a certain amount of overlap with other spaces and between spaces could be provided to reduce the impact on space utilization without serious consequences. Thus, in the ADA-ABA clear floor space for two devices, a lower overall width of 1676 mm (66 in.) is probably sufficient.

Figure 4-1: Accommodation model depicting the clear floor space for users of manual wheelchairs, powered wheelchairs, and scooters.
Long Description: This data provides the minimum dimensions for the rectangular floor area required by occupied wheeled mobility devices (i.e., with the occupant seated in their own wheeled mobility device) when stationary. Clear floor area dimensions are used for determining the size of spaces designated for wheeled mobility users (such as on buses, in movie theaters, sports stadiums). The clear floor area width dimension also informs the minimum clearance width for successful passage through corridors, doorways, and wheelchair ramps. Currently, the ADA accessibility guidelines prescribe a minimum floor area of 760 x 1220 mm (30 x 48 in.) for wheeled mobility access. Dimensions are based on length and width measurements obtained from occupied wheeled mobility devices as part of the Anthropometry of Wheeled Mobility Study. These data suggest minimum clear floor area dimensions of 786 x 1362 mm (31 x 54 in.) for manual chairs, 827 x 1414 mm (33 x 56 in.) for powered chairs, and 837 x 1435 mm (33 x 56 in.) for scooters when needing to accommodate 95% of users.
4.3.4 Knee and Toe Clearances
Adequate space without an obstruction under a design element to the floor is essential for WhMD users to approach sufficiently close in a forward direction to access equipment, controls, goods and other items, and to participate effectively in activities such as eating and work. Such clearance space is also critical when using building elements like bathroom sinks, drinking fountains, kitchen countertops, information kiosks and ATM machines.
In the current ADA-ABA standards, the clearances for knee and toe space are treated separately. But, in other countries, they are addressed together. We believe that they work together and that it would be more effective to present them in this way to avoid confusion in design application and compliance reviews. None of the standards we reviewed addressed the relationship of knee and toe clearances to anatomical and equipment reference points or landmarks. This makes it difficult to take anthropometric data and apply it to the existing standards. For example, the ADA-ABA has a sloped line indicating the depth of knee clearance at the plane of the knees and the depth somewhere above the ankles. But neither top nor bottom landmark is clearly specified. In fact, up to now, we did not have research information on the angle of the slope. Moreover, the standards do not address this design issue in practical terms. For example, the ADA-ABA has a minimum knee clearance depth of 280 mm (11 in.), but the combined knee and toe clearance depth required for an individual to bring their torso to the edge of a table or counter is not specified.
Therefore, we developed a new representation method for knee and toe clearances that can be related directly to landmarks on the body and device. Four different accommodation models were developed depicting knee and foot clearance spaces for different positions of the individual in relationship to the built element:
1. The forward-most point of the body or equipment touching a facing wall (Anterior-most point as reference);
2. The crease of the foot and lower leg in contact with the built element (Dorsal foot point as reference);
3. The forward-most point of the knee in contact with the element (Distal Knee point as reference);
4. The forward-most point of the abdomen in contact with the element (Anterior-most abdomen point as reference).
Shown below are the first (figure 4- 2) and fourth (figure 4‒3) accommodation models developed for manual wheelchair users. The shaded areas in the figures depict the envelope of the space required by a specified proportion of manual wheelchair users. These graphical representations provide information on the minimum knee and foot clearance height and depth needed in order to accommodate a specific proportion of the sample (e.g. 95%, 90%, 75%, etc.).
Each model applies to a different design scenario. The designer should select the model that is most appropriate for the task or activity to be conducted at a location and physical constraints in the environment. For example, a safe under an ATM may restrict the depth of the toe clearance, thus the first model would be used. But, in designing a desk for filling out a job application, there is no technical reason for restricting the depth of toe clearance but the leading edge of the desk should be as close to the abdomen as possible. Thus the fourth model is more appropriate.
The accommodation models are very useful for designers and product manufacturers. For simplicity, it would be good if standards had only one illustration. The following dimensions on knee and toe clearances should be used to accommodate 95% of our study sample on all four dimensions:
• Toe clearance depth: 127 mm (5 in.) maximum, measured from wall
• Toe clearance height: 356 mm (14 in.) minimum , measured from the floor
• Knee clearance height: 711 mm (28 in.) minimum, measured from the floor
• Knee clearance depth: 305 mm (12 in.) minimum, measured from the leading edge of the toe clearance or 406 (16 in.) minimum, measured from the wall if there is no separate toe clearance.
• Knee clearance depth for workstations, lunch counters and dining tables: 813 mm (32 in.) minimum, measured from the wall.
Knee clearance should not be sloped, in other words, it should be the same depth throughout.
Toe clearances at cabinets and other locations without knee clearance should be a minimum 127 mm (5 in.) high but a minimum or maximum limit is not necessary.
Overlap of toe clearance and turning clearances can be allowed.
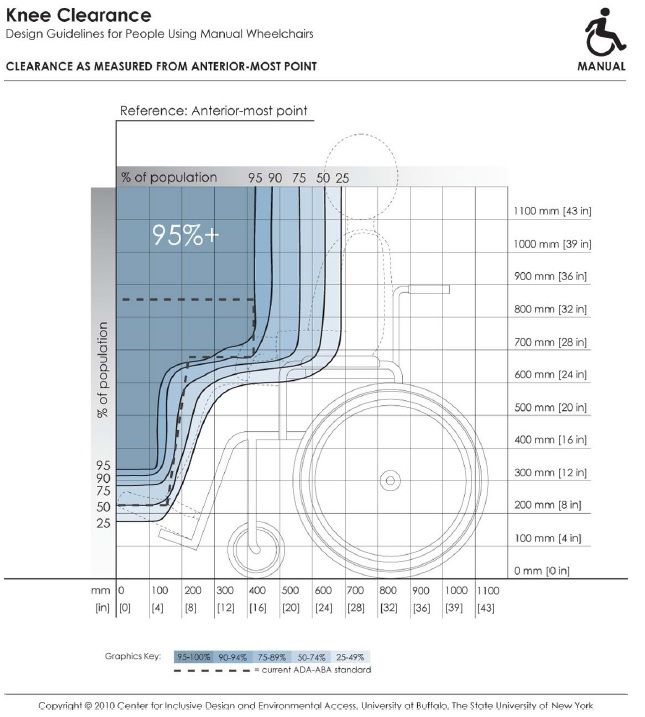
Figure 4-2: Knee and toe clearances with the forward‐most point of the body or equipment touching a facing wall (Anterior‐most point as reference)
Long Description: This depicts knee and toe clearance required by manual chair users for forward approach to elements in the built environment (e.g., light switches). It references dimensions of clearance height and depth to the forward-most point on the person or mobility device (e.g., toe, footrest). Shaded areas depict the envelope of space required by the specified percentage of people if positioned with the forward-most point touching the wall. Hence, to accommodate a particular percentage of users, the side profile of a design element (shown by dotted line) should not extend outside the corresponding shaded area.
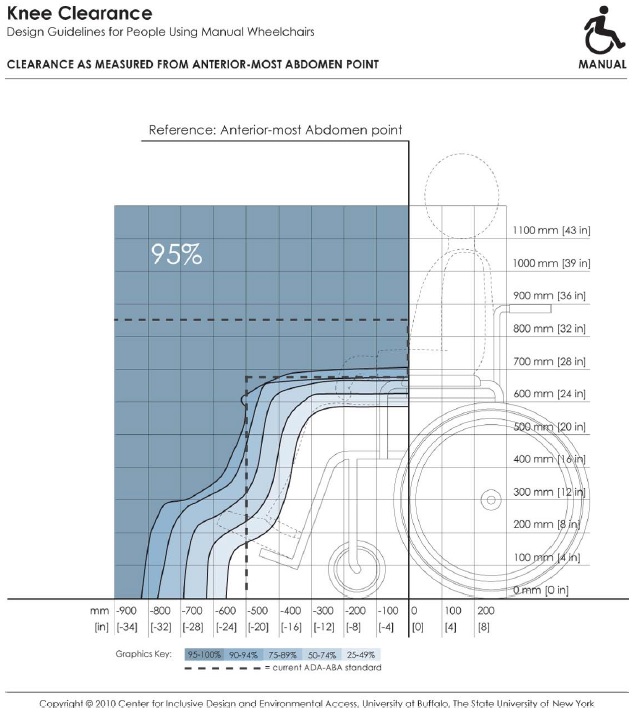
Figure 4-3: The forward‐most point of the abdomen in contact with the element (Anterior-most abdomen point as reference).
Note: In order to accommodate a specified proportion of users (e.g. 95% of the sample), the side profile of a design element shown by the dotted line should not extend beyond the corresponding envelope (e.g., the solid line marked 95%). For a given design scenario, specific dimension values for clearance height and depths can be read off the horizontal and vertical axis of the figure.
Long Description: This depicts knee and toe clearance required by manual chair users for forward approach to elements in the built environment (e.g., dining tables). It references dimensions of clearance height and depth to the forward-most abdomen point on a person. Shaded areas depict the envelope of space required by the specified percentage of people if positioned with the abdomen touching an obstruction. Hence, to accommodate a particular percentage of users, the side profile of a design element (shown by dotted line) should not extend outside the corresponding shaded area.
4.3.5 Turning clearance
The ADA-ABA Standards include requirements for a circular turning space, a T shaped turning space, a L-Turn (90-degree turn) and a U-Turn (180-degree turn) around an obstacle. In our research several turning maneuvers were studied: the 360-degree turn, the 180-degree turn, the 180-degree turn around a barrier and a 90-degree turn. In confined dead end spaces, a 360-degree turn should be used as the basis for the minimum space required since individuals often move around within small space without actually leaving it. A 180-degree turn is more appropriate as a basis for defining a minimum space bounded only on two sides and the individual has an open space to use along the axis of the turn. T shaped space is not included here because it can be derived from the 90-degree turn to establish the width of the arms of the T and the clear floor space to determine the length of each arm. The overall width should be the same in both arms. The same values should be used for the 90-degree turn and the T-turn.
The accommodation models and our recommendations are addressed individually below. In general, standards should give some guidance on where each of these turning spaces should be used. For example, the 180-degree turn around an obstruction should be used at ramp landings rather than the 180-degree unobstructed turn clearance.
4.3.5.1 90-Degree Turn
This turning clearance is applicable for exterior and interior circulation, aisles in seating areas, ramps and other locations. The width of circulation spaces should be wider to accommodate two-way traffic and egress requirements.
The mean values for scooters in our sample are in excess of the current standards. In addition, less than 80% of power and manual wheelchair users in our sample are accommodated by the standard. We recommend revising the ADA-ABA standard for 90-degree turning width to 1000 mm (39 in.) which would accommodate at least 95% of our sample. Figure 4‒4 shows the accommodation model of the minimum clear width required for the 90-degree turn.
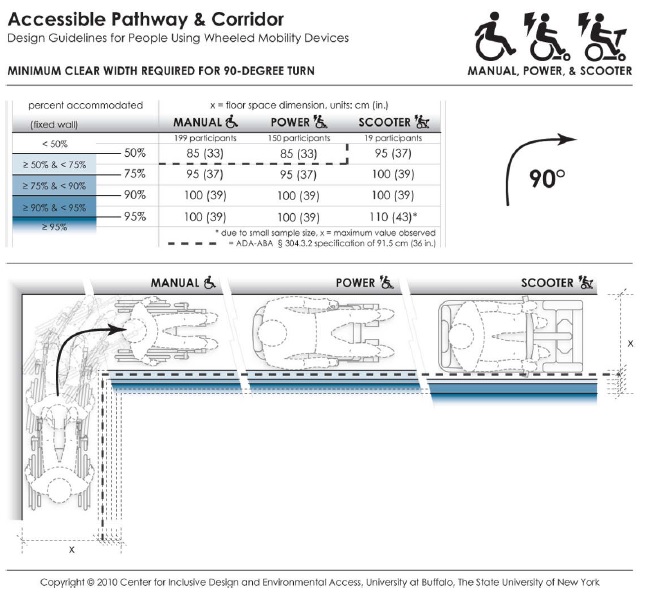
Figure 4-4: Accommodation model depicting the minimum clear width required by users of manual wheelchairs, powered wheelchairs and scooters to complete a 90-degree turn.
Long Description: This data depicts the amount of space required by users of wheeled mobility devices to perform a 90-degree turn ("L-Turn"). The bold dashed line in the table and figure indicates the current ADA requirement of a 91.5 cm (36 in.) passage width. Findings from the Anthropometry of Wheeled Mobility Study indicate that a width of at least 85 cm (33 in.) was required for 50% of the manual and power wheelchair users measured in this study to perform a 90-degree turn. A width of 100 cm (39 in.) was required in order for 95% of manual wheelchair and power chair users to complete the turn, with 95% of scooter users needing a width of at least 110 cm (43 in.) These data are based on measurements of wheeled mobility users performing 90-degree turns in a hallway, built with mock walls. The outside wall of the hallway was fixed. The other side of each leg had moveable walls. The enclosed space was incrementally increased until a user could pass through the turn successfully. The minimum space required for completing a 90-degree turn within moving or knocking down any of the walls was recorded. Use of multiple short turns was allowed in contrast to a single continuous turn.
4.3.5.2 180-degree turn
Currently, the ADA-ABA does not have a specific clearance for this type of turn. The 1525 mm (60 in.) turning space would be used instead. Our research findings for this turn apply to corridors and other circulation spaces are bounded by two parallel walls or three walls. Our findings indicated that a width of 1700 mm (67 in.) would accommodate 95% of manual and power wheelchair users and 90% of the scooter users. Accommodation of additional scooter users would increase this dimension by 18 mm (7 in.) (Figure 4‒5).
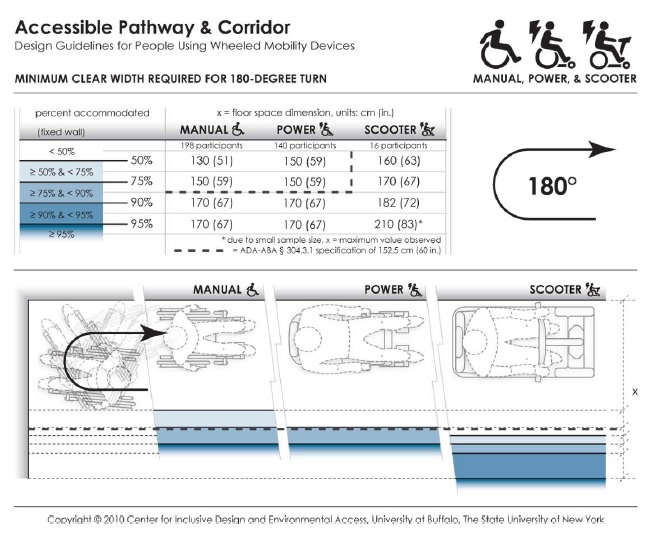
Figure 4-5: Accommodation model depicting the minimum clear width required by users of manual wheelchairs, powered chairs and scooters to complete a 180-degree turn.
Long Description: This data depicts the amount of space required by users of wheeled mobility devices to perform a 180-degree turn. The bold dashed line in the table and figure indicates the current ADA requirement of a 152.5 cm (60 in.) space for wheeled mobility users to turn around. Findings from the Anthropometry of Wheeled Mobility Study indicate that a width of at least 130 cm (51 in.) was required for 50% of the manual wheelchair users measured in this study to perform a 90-degree turn. A width of 170 cm (67 in.) was required in order for 95% of manual wheelchair and power chair users to complete the turn, with 95% of scooter users needing a width of at least 210 cm (83 in.) These data are based on measurements of wheeled mobility users performing 180-degree turns in a dead-end hallway, built with mock walls. The end wall and a second wall of the hallway were fixed. The other side of the hallway had a moveable wall. The hallway width was incrementally increased until a user could enter the space, turn around, and exit the space successfully. The minimum space required for completing 180-degree turn within moving or knocking down any of the walls was recorded. Use of multiple short turns was allowed in contrast to a single continuous turn.
4.3.5.3 180-degree turn around an obstacle
This type of turn is applicable to turning at a landing where one is reversing direction to move back along a parallel path, e.g. at the end aisles in library stacks or supermarkets, at switchback ramps or in a terminal queue. The current ADA-ABA standard for the space needed to complete maneuver is based on the width of the entry aisle and the width of the intervening obstacle, e.g. shelving. In our research, we studied the impact of keeping the depth of the turning area and the entry/egress aisle width identical. This provided the opportunity to discover if a wider aisle would lead to less required depth in the turning area. This was, in fact, the case. The accommodation model depicts the results with the condition that depth is the same as access and egress aisle width. We found that a width of 1065 mm (42 in.) for all three dimensions would accommodate more than 90% of the manual wheelchair and more than 95% of the power chair users but less than 80% of the scooter users. We recommend using this approach in future ADA-ABA standards with a minimum width of 1095 mm (43 in.) which would accommodate more than 95% of all WhMD users in the sample. This would increase the width slightly but reduce the depth of the turning area significantly. When the entry and egress aisles are less than this width, the 360-degree turn clearances should be provided at the turning area. In effect, this condition is a space bounded by three sides and requires a lot more space because WhMD users cannot cut the corner like they can with a wider aisle width (Figure 4‒6).
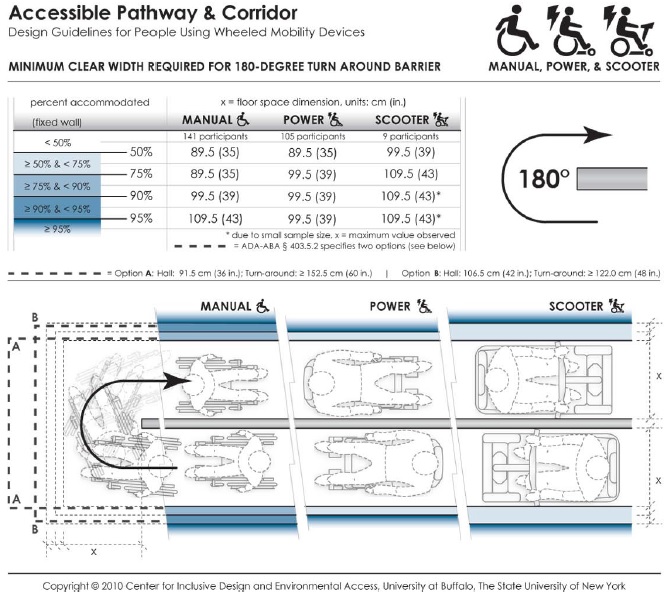
Figure 4-6: Accommodation model depicting the minimum clear width required by users of manual wheelchairs, powered wheelchairs and scooters to complete a 180-degree turn around an obstacle.
Long Description: This data depicts the amount of space required by users of wheeled mobility devices to perform a 180-degree turn ("U-Turn") around an obstruction. The bold dashed line in the table and figure indicates the current ADA requirements, which vary based on the passage width and space available at the base of the turn. Findings from the Anthropometry of Wheeled Mobility Study indicate that a uniform width of at least 89.5 cm (35 in.) was required for 50% of the manual and power wheelchair users measured in this study to perform a 180-degree turn around the obstruction. A width of 109.5 cm (43 in.) was required in order to accommodate 95% of all users. These data are based on measurements of wheeled mobility users performing 180-degree turns around an obstruction, built with mock walls. An obstruction of 11 cm (4 in.) was fixed at a central location. Three moveable walls were constructed around the central fixed wall to form a U-shaped hallway of equal passage width. The enclosed space was incrementally and uniformly increased until a user could pass through the U-turn successfully. The minimum space required for completing a 180-degree turn around an obstruction within moving or knocking down any of the walls was recorded. Use of multiple short turns was allowed in contrast to a single continuous turn.
4.3.5.4 360-degree Turn
Accommodation models for 360-degree turns have been developed for the three types of devices based on the results (e.g. Figure 4‒7). There are substantial differences between the device types. Scooters require the largest turning spaces and manual chairs the least although there are some manual chair users that required spaces as large as many power chair users. The use of the 95th percentile in the power chair findings would increase the current requirements by 575 mm (23 in.). The size of the space required for the 95th percentile of scooter users would create even larger increases. Thus, due to the potential impact, these findings require some policy decisions on who to exclude, or a new way to address this design issue.
Dimensions for 360-degree turning spaces are used to determine the minimum spaces needed for turning around in spaces with only one point of entry. To better represent these situations, we based our measurements on a square-shaped space rather than circular as the former allows WhMD users to use the corners thereby optimizing space utilization. In spaces in which turning around is not critical for usability, another basis for determining the minimum floor area can be used as in the Fair Housing Accessibility Guidelines which only require a clear floor space outside the arc of a swinging door. This strategy is also already used for elevators and toilet stalls in the ADA-ABA Guidelines. A second strategy is to provide a turning space in all covered public spaces like toilet rooms, laundries and shared kitchenettes to accommodate the 50th or 75th percentile and, in addition, require at least one of each type of space somewhere in a building to be large enough to accommodate the largest devices. For example, one companion toilet room could be required in every building that accommodates both assisted use and the largest devices while the other toilet rooms meet less space intensive requirements. The largest turning space could also be required in places where the impact of increasing turning spaces is insignificant, for example, in a lobby or outdoors. Obviously, better space planning can also be used to avoid dead end spaces entirely but that cannot be mandated in a standard.
The implications of these findings are so significant that the authors recommend starting broad discussion of options among stakeholders before a concrete proposal is made to adopt a particular strategy.
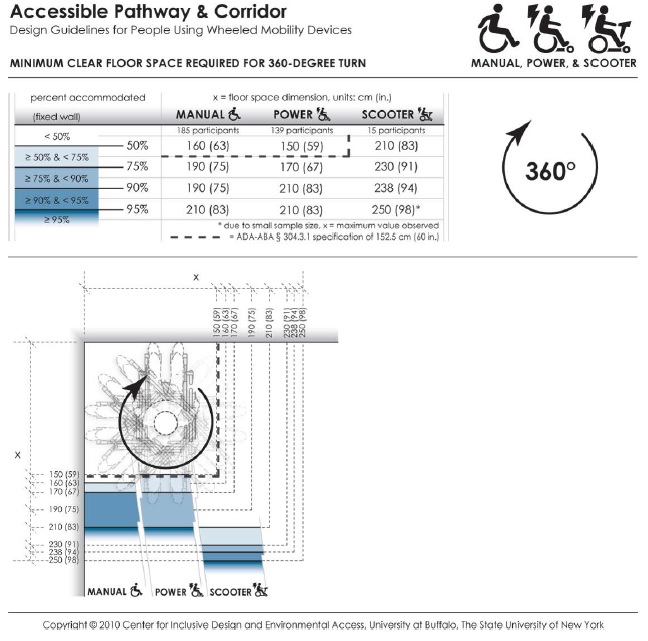
Figure 4-7: Accommodation model depicting the minimum clear space required by users of manual wheelchairs, powered chairs and scooters to complete a 360-degree turn.
Long Description: This data depicts the amount of space required by users of wheeled mobility devices to perform a 360-degree turn. The bold dashed line in the table and figure indicates the current ADA requirement of a 152.5 cm (60 in.) turn space. Findings from the Anthropometry of Wheeled Mobility Study indicate that a square space of at least 160 x 160 cm (63 in.) was required for 50% of the manual wheelchair users measured in this study to perform a 360-degree turn. A space of 210 x 210 cm (83 in.) was required in order for 95% of manual wheelchair and power chair users to complete the turn, with 95% of scooter users needing a space of at least 250 x 250 cm (98 in.) These data are based on measurements of wheeled mobility users performing 360-degree turns within an enclosed square space built with mock walls. The enclosed space was incrementally varied from a size of 130 x 130 cm (51 in.) to 250 x 250 cm (98 in.) The minimum space required for completing 360-degree turn within moving or knocking down any of the walls was recorded. Use of multiple short turns was allowed in contrast to a single continuous turn.
4.3.6 Reach Limits
Accommodation models were developed from the research findings for forward and side (lateral) reach in an empty 56 grams (2 oz.) cylinder (figure 4‒8) and a heavier 2.27 kg. (5 lb.) cylinder (see Appendix 3). In our research, only a subset of the individuals in the study sample who could lift a no-weight (56 grams or 2 oz.) cylinder above their shoulder were measured for reach limits. This insures that the accommodation models are not biased by individuals who have limited functional reaching abilities. Using these models, a designer can determine the percentage of wheeled mobility users with functional reaching ability that might be expected to reach (without a weight) to a 100 mm x 100 mm (3.9 in. x 3.9 in.) target location in space at a given height from the floor. The distance in each case can be measured from the location of the hands at the end of the reach to any number of reference points on the WhMD user’s body or chair. The corresponding percentages are color coded to differentiate regions of reach performance. Percentages of reaching ability drop significantly when the object mass is increased from 56 grams (2 oz.) to 2.27 kg. (5 lb.). With weights that weigh more than 56 grams (2 oz.), we found that 20‒25% of all three WhMD users could not reach to the same heights as to the no-weight condition. The dashed lines in the figures show the current ADA-ABA requirement which specifies a threshold value of 1220 mm (48 in.) when reaching to a target located in front of an individual at the plane of the toes or front of footrests, or “anterior most point” (for details on the development of the models, see D’Souza et al. (2009a).
The design and standards implications of the research findings are as follows:
1. Side reach access is far more preferable to forward reach access, which is quite restricted among the wheelchair user population. Targets at locations along the plane of the anterior most point will not be within the reach of a majority of wheeled mobility users, even if the maximum reach height limit were reduced to shoulder height.
2. When forward reach is the only alternative, knee clearance should be provided that allows an individual to extend their legs and front part of their wheelchair beyond the plane on which the target is located. This will allow many more individuals to reach to targets in a forward approach. For the accommodation model of forward reach, the depth of knee clearance needed to accommodate different proportions of the sample can be determined by the columns with negative offset distances and can be interpreted as the increase in ‘percent capable’ (e.g. 74% or 88% of the sample) for every 100 mm (3.9 in.) increase in available toe or knee clearance.
3. The upper height limit in the current ADA-ABA standard for unobstructed side reach, 1220 mm (48 in.) will accommodate the 99th, 95th and 96th percentile of manual wheelchair, power chair and scooter users in our sample. Thus, there is no need to change that dimension. However, a large percentage of the sub-sample of individuals who had functional reach could not safely reach to the lower limit of 380 mm (15 in.). Our results also indicate that the upper limit of reach could be increased for wheeled mobility users but this may result in limitations for people of small stature.
4. Standards developers should consider requiring either side reach access to all targets within the scope of standards or limiting front reach to locations where knee clearance is provided beyond the plane on which the target is located. The lower limit of side reach should be increased to 700 mm (28 in.). We recommend that the lower limit only be applied to controls and devices that are needed for business services (e.g. recharging station for mobile phones or wheelchairs). For long term use in work sites, power strips should be used to provide access to outlets.
5. When designing environments for tasks that require lifting objects, avoid designs that require people to reach to objects above counter height. Adjustable storage units that building occupants can customize to their own needs can improve usability. Devices like sliding shelves that reduce the length of reach tasks are another beneficial strategy.
6. Standards developers should give some consideration to the task in relationship to reach. Reach limits for storage units where lifting objects are inherent in their use, could be different than for other tasks. We believe that this issue requires discussion since there are other approaches to accommodating limited reach as noted above.
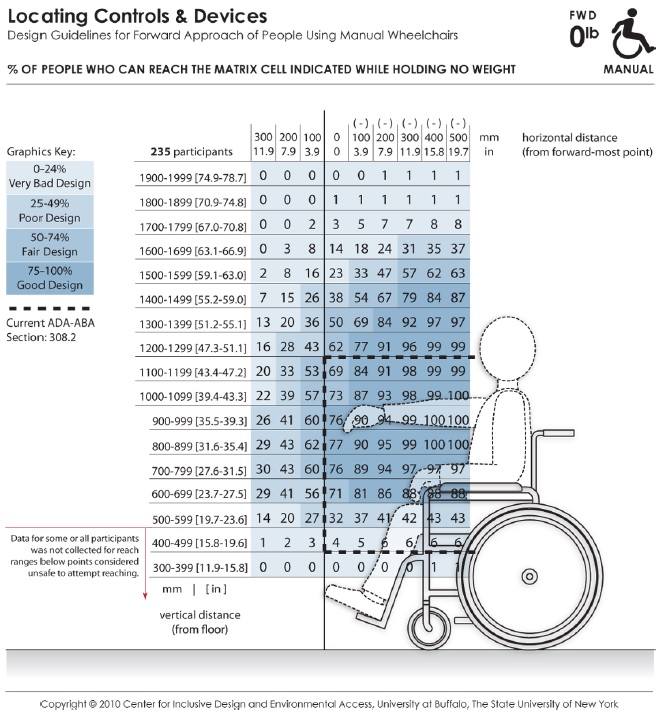
Figure 4-8: An accommodation model showing the abilities of the manual wheelchair users to complete a forward reach without lifting weight
Long Description: These data depict the reaching abilities of manual chair users represented as the percentage of users expected to reach to a target location in the forward reach direction for a given (a) height from the floor (shown the vertical axis) and (b) offset distance (shown on the horizontal axis) from the forward-most point of the person or wheelchair (e.g., toe, footrest). Horizontal distances in the positive range represent offset distance away from the body (or barrier depth) when reaching over an obstruction in relation to the forward-most point, and the negative range implying that the reach target is brought closer to the person (such as on a table with knee clearance). The percentages are color coded to differentiate regions in reach performance. The dashed lines indicate the current ADA-ABA requirement.
4.3.7 Clear Floor Space for Reaching
Clear floor space dimensions for reaching are different than for seating because they require a specific orientation to the target. This type of clear floor space should be used at light switches, wall outlets and other wall-mounted elements. Further, they can be applied to the operation of windows, access to items on a shelf or countertop, operating a telephone, automatic teller machines (ATM), information kiosks, and other places where reaching is required.
The longest reach distance from the WhMD will usually be at the approximate height and lateral direction of the shoulder joint. For forward reaches, the longest reach range will also be at the level of the shoulder unless the individual has an upper extremity impairment that affects range of motion. Reaching across the body will reduce the effective reach distance due to the reduced radius of reach. Generally, clear floor space for reaching should take into account how an individual will be oriented when reaching and seek to optimize the range of reach.
About 25% of the individuals in our sample were left-dominant, which is about double the frequency of left hand dominance in the population at large (Raymond et al., 1996). Bi-lateral access is desirable to insure adequate functional reach to targets, especially given that wheelchair users may only have functional reach and gripping ability in one arm and hand. Thus, we developed an accommodation model for clear floor space adapted for bi-lateral reach.
Accommodation models were developed for the three wheeled mobility device types, manual wheelchair users, powered chair users, and scooter users (figure 4‒9). The accommodation models provide guidance on the dimensions and location for clear floor space in relation to the reach target to accommodate:
• left and right hand users, and
• use of a forward or sideways (lateral) approach, when reaching or grasping.
For applications where all of three types of mobility devices (i.e. manual chair, powered chair and scooters) need to be accommodated, the largest of the occupied length and width values across the three device categories should be used. The models can be used to develop a right handed or left handed approach space but using the full space delineated in the model would result in a “universal approach space” that will allow all building users to perform tasks in a way that is most comfortable, i.e. using the right or left hand, and a forward or lateral approach direction. The 95th percentile values for the four measurement dimensions provide a reasonable threshold values for developing standards. As described above under Clear Floor Space, current clear floor space requirements for reaching in the ADA-ABA Standards do not accommodate the full range of contemporary wheelchairs.
The following recommendations should be implemented to specify the position of the clear floor space more appropriately than as in current standards:
1. Where reaching is critical for completing a task, e.g. an ATM machine, the universal clear floor space for reach (see accommodation model) should be provided and centered on the target. The size of the space should accommodate the 95th percentile of scooter users to accommodate the full range WhMD users.
2. For all other reach tasks, a square clear floor space, 1430 mm x 1430 mm (56 x 56 in.) should be provided, centered on the target. This will allow almost all device users to position themselves close to the target using either a front or a side reach and enough leeway for most device users to align their shoulder close to an axis on the target. But, it does not optimize for handedness.
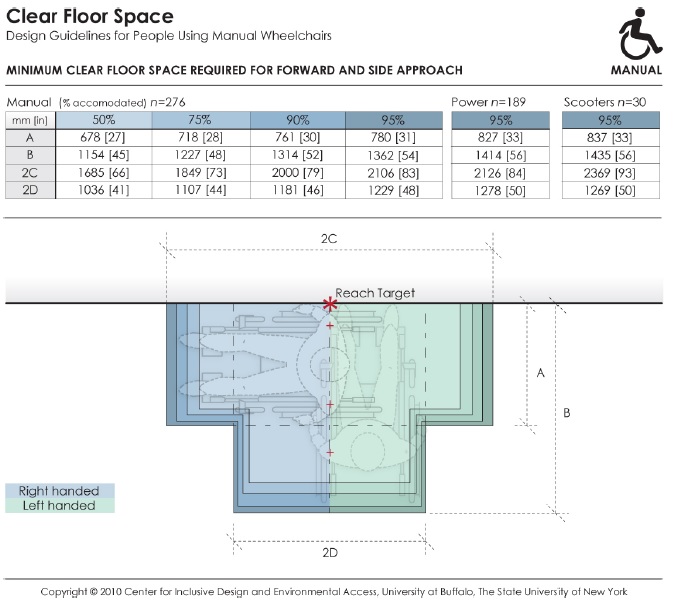
Figure 4-9: Accommodation model depicting the dimensions and positioning of the clear floor space required by manual wheelchair, powered chair, and scooter users when using either the right or left hand, for both forward and lateral reach.
Long Description: This data depicts the amount of clear floor area required by persons using wheeled mobility devices when performing a forward or side reach to a target location (e.g., reaching to a light switch on the wall) with either the right or left hand. The accompanying table provides dimensions values for clear floor area to accommodate 95% of manual chair (n=276), power chair (n=189), and scooter (n=30) users that were measured as part of the Anthropometry of Wheeled Mobility study. The dimensions of clear floor area are based on four anthropometry dimensions. These dimensions are: (A) occupied width, the horizontal distance between the side-most (lateral-most) points of the wheelchair or occupant on the right and left side; (B) occupied length, the horizontal distance from the front-most (anterior-most) point of the wheelchair or occupant to the rear-most (posterior-most) point of the wheelchair or occupant; (C)the horizontal distance from the reaching shoulder to the front-most (anterior-most) point of the wheelchair or occupant; (D) the horizontal distance from the reaching shoulder to the side-most (lateral-most) point on the opposite (contra-lateral) side of the wheelchair or occupant.
Although not specified in the ADA-ABA, the position of the clear floor space for reach in relationship to the target has been interpreted to be centered on the target. Centering, however, reduces functional reaching ability since the shortest reach is on an axis through the shoulder joint at a 90 or 180-degree reach angle. Centering requires a longer reach across the body. The universal clear floor space for reach, shown in the figure above, is designed to accommodate bilateral reach, thus it takes the offset of shoulder point to the lateral and anterior most points of the clear floor area into account and does not require a cross body reach.
To optimize for handedness using only enough space for a forward reach or side reach, the clear floor space has to be offset from either the lateral most edge of the space (front reach) or the anterior most edge of the space (side reach):
1. Front reach: Typically, the shoulder joint is about 175 mm (7 in.) inboard from the extreme lateral most point of occupied WhMD. This offset should be used for locating the clear floor space in relationship to the target. This means that the clear floor space would be offset, from the target, a distance of 175 mm (7 in.) to the right for a right-handed approach and 175 mm (7 in.) to the left for a left-handed approach.
2. Side reach: The anterior most edge of the clear floor space needs to be offset to one side of the target so that the shoulder is aligned with the reach target or slightly behind it. Offsetting the anterior most edge of the space by 1193 mm (45 in.) from the target will accommodate the 95th percentile of scooter users and, thus, provide sufficient room for everyone else to optimize their reach.
Note that using the offsets above is not feasible with the current ADA-ABA standard of 760 mm (30 in.) x 1220 mm (48 in.).
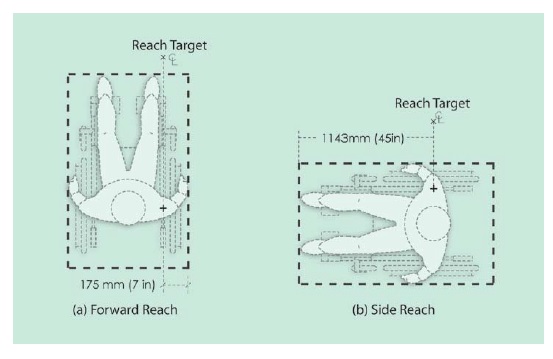
Figure 4-10: Offsets required when positioning the clear floor space in relation to the reach target in (a) forward reach, and (b) side reach.
Long Description: The figure shows two plan views of occupied WhMD, one for lateral and one for forward reach, with the target of reach positioned on axis with the shoulder joint of the device user. The forward reach plan shows the target offset 175 mm (7 in.) from the outside edge of the occupied device and the side reach plan shows the target offset 1193 mm (45 in.) from the anterior most point of the occupied device.
4.3.8 Operating forces
Operating forces are applied with a wide variety of grip forms (see Steinfeld, 1990). In this research we measured performance using three common grips – a power grip, lateral pinch and thumb-forefinger pinch grips. From these data, we can only make some broad conclusions for design and standards based on a large sample of people with relatively severe disabilities.
Designers should reduce the need for high precision grip postures and/or pinch forces given the lack of finger dexterity, motor control or pinching capabilities of persons with disabilities. This can be achieved by designs that allow operation using alternate grip configurations such as a flat hand, fist or a more convenient power grip or hook grip. Broader handles and larger gripping surface areas facilitate stronger grips.
When a precision pinch grip is required, a lateral pinch is recommended over a thumb-forefinger tip pinch grip because a lateral pinch grip provides a larger finger contact surface; the grip strength capabilities of our sample was higher for lateral pinch grip as compared thumb-forefinger pinch grip. Individuals with limited finger dexterity and strength are also more likely to be capable of forming this grip.
Use of operable parts that require fine grips preferably should not require exertion of lateral pinch grip forces in excess of 2 lbf (9 N) to accommodate the vast majority of WhMD users having at least some grasping capability. For other types of operable parts, the upper limit for operating force should be retained at a maximum of 5 lbf (22 N) to accommodate 95% of the sample.
Further, tasks and products that require operation of controls or object grasping should allow for both right and lefthanded operation, given that more than 25% of wheeled mobility device users in this study were lefthand dominant. Adequate clear floor space should be provided to access controls and switches from either the left or the right (see previous description of ‘Clear Floor Space for Reaching’).
A large proportion of wheeled mobility device users possess functional capabilities in only one hand. Hand-operated products and environmental features for use by the general public should be designed acknowledging that grip strength is significantly affected by gender, age and disability, and that a sizeable proportion of WhMD users (approx. 12% in our sample) have very limited or no grasping ability.
Grip strength data from our study can help designers employ more inclusive design criteria when developing new designs, as well as identify tasks that require pinch grip force exertion that exceed the capabilities of most users and need to be redesigned possibly through use of technological interventions and assistive devices. For example, many drawers or cabinets require tight pinching to open but adding a more ergonomically designed handle and rollers to the bottom of the drawer allows it to open with ease.
The ADA-ABA standards currently require operation with only one hand and without “tight grasping, pinching or twisting of the wrist”. This is a major step toward reducing demands on people with limitations of grip. However, the standards do not require left and right hand operation, and the maximum operating force allowed substantially exceeds the abilities of a large number of individuals in our sample for objects requiring a fine grip. Moreover, the standards preclude the use of a pinch grip, which is desirable to people who are able to use it effectively. Not allowing such grips at all may create usability problems for even more building users than it helps.
Our findings suggest developing a more detailed approach to grips and grip forces in the standards. This should include:
• Identifying maximum operating force requirements based on the types of grips and forces exerted.
• For small controls and hardware that normally would be operated with pinch grips, the maximum operating force should be 2 lbf (9 N).
• For larger controls and hardware that can be operated with a power grip, the maximum force requirements could be retained at 5 lbf (22 N) bearing in mind that this still does not address the needs of many WhMD users having very limited or no grasping ability.
• The 5 lbf (22.2 N) maximum force could be retained for operating forces for opening doors. This limit was based on the limitations of door closer technology.
• Developing specific requirements for alternative gripping options without precluding pinch grips, e.g. flat hand, knuckle push, based on existing research on hand anthropometry (e.g. Steinfeld, 1990)
• Retaining the requirement for use by only one hand.
• Utilizing standard terminology from anthropometry in reference to grip forms; the standards could list the types of grips and movements, including alternatives to standard grip forms that would be allowed. Information of this type is available from a previous Access Board study (Steinfeld, 1990; Steinfeld and Mullick, 1990).
Improving standards related to operating forces requires a careful examination of the availability of products that would be accessible to this population and the cost implications of new requirements. This would identify the limits to feasible improvements to the standards and may require adjusting the force limits to address feasible implementation.
4.3.9 Doorway Design
We did not obtain quantitative data on performance in our door use research. Thus there are no accommodation models for this topic. The results of the door trials identify relationships between structural anthropometry and identify needed modifications to current requirements.
The results of the door maneuvering studies confirmed the importance of many common accessibility code requirements. They also demonstrated a need to make some improvements to standards to provide access for the broad population of wheeled mobility users. The implications of the research findings are summarized below:
A wider clear opening than current ADA-ABA standards 815 mm (32 in.) would improve usability. Adopting a clear opening width of 860 mm (34 in.) would accommodate the widest occupied devices in our sample. This would also be small enough to allow a 91 cm (36 in.) door leaf, a size that is already used extensively for accessibility and fire safety. Consideration should be given to aligning U.S. requirements with the metric system. For example, a 90 cm door is slightly smaller than a 91 cm door but is standard elsewhere in the world and would accommodate our entire sample.
The very wide door that was tested 1041 mm (41 in.) clear opening did not increase the difficulty of using doors. The findings demonstrate that wider doors are better for accessibility and there is no need to put an upper limit on the size of doors in regulations at this time, although doors wider than this could pose some problems.
The lack of differences between the findings for the passage task on the pull sides of Doors 1, 800 mm (31.5 in.) latch clearance, and Door 2, 406 mm (16 in.) latch clearance, demonstrate that an 457 mm (18 in.) clearance required in recessed doors is acceptable although we do not have data to demonstrate whether the 305 mm (12 in.) latch clearance on other doors is satisfactory. In historic preservation, some allowances should be made for difficult renovation issues like the recess in Door 3 where the structure of the building would not only make adjusting the recess extremely difficult and costly but also would also impact its historic character.
Closers are not necessarily bad for accessibility. In fact, they reduce the difficulty of the most difficult maneuvering tasks, i.e. closing maneuver and closing tasks. Their impact on passage through the door indicates that they must be set to the lowest operating force possible to insure that they accommodate the broadest population.
Since the closing maneuver is the most difficult aspect of door use for wheelchair users, development of a low cost electromechanical closer that would not increase opening force would benefit wheelchair users significantly. It should have microprocessor control that would activate the closer only when a door is closing. When opened, a presence sensor could activate the closing cycle when an individual passed through the door.
Automating frequently used doors that are kept closed and require closers will increase accessibility substantially, especially on exterior doors where the operating forces are higher to conserve energy and insure positive latching. Requiring at least one automated door at primary entries would be highly desirable. This would increase usability for more than 10% of the wheelchair users in our sample and have multiple benefits for all building users: eliminating difficulty using the latch, enabling the opening maneuver, and eliminating difficulty closing the door. In addition, with proper placement of an activator to open the door, it eliminates the need for a latch side clearance.
Section 5.0 Dissemination Activities
Dissemination activities related to the project have included publications, conference presentations, standards development, an online course and knowledge translation activities. Some of these activities started prior to the beginning of the current contract and have continued. Others have only recently been started.
Completion of reports alone is not sufficient to ensure that the knowledge generated from research will be translated to practice. The IDeA Center uses a general model of knowledge translation called “knowledge to action” (KtA model) in all its activities (Graham et al., 2006). The basic idea of this model is that effective follow up activities are needed to insure that research knowledge is applied in the real world. Lane and Flagg (2010) developed a variation of the KtA model called the Need to Knowledge (NtK) model in which research is integrated into the development process. In this way, research and development activities inform each other and the knowledge to facilitate knowledge translation.
This project is an excellent example of the NtK model in practice. It started as a response to a recognized need for information to advance accessible design and standards development. At an early stage of the project, the research team gave attention to the future uses of the data that would be produced. Data collection was automated and methods of disseminating the database in digital form were investigated to facilitate applications of the knowledge. The project have short-, intermediate- and long-term goals. The primary short-term goals are to develop a prototype database that would serve as the foundation for continued anthropometry research on disabled people and produce dissemination products to apply the knowledge discovered. The intermediate-term goal is to provide knowledge to improve existing standards. The long-term goal is to produce a human modeling application that can be used in computer-aided design in everyday practice.
Other research at the IDeA Center has been investigating the needs for information in the design professions, in particular, how designers used knowledge on accessibility and universal design in their work (Paquet et al., 2008a; 2008b). This work helped us to understand how designers are currently using accessibility information and adjust our dissemination strategy. Through this work and our outreach activities, we learned that a database would not in itself produce knowledge in a form that could be easily adopted in design. Designers want information like that found in codes – “Tell us what we should do” they said. Although 3-D design is now common, few environmental designers use human modeling software. In some industries, like the transit bus industry, even 3-D design is rarely used except in the production process. Moreover, standards developers work within the framework of a rigidly defined process in which interested parties offer proposals for changes to standards, including precise wording changes, accompanied by supporting information. A database alone would not provide information in a form that could be used easily in that process. Thus, we decided we had to expand the types of dissemination products we would develop to fit more with the way designers and standards developers currently work.
We developed a strategy that included several parallel activities:
1. Publication of conference papers and delivery of presentations to disseminate information about the project and create a community of interest in the work through face-to-face contact.
2. Publication of a series of refereed journal articles to disseminate the findings of the research in a form that would be targeted to specific revisions of standards and have high legitimacy (through peer review and archival quality) to support proposals for revisions of standards.
3. Holding two international workshops that provided a forum in which people from around the world exchanged ideas about the anthropometric study methods, digital human modeling and the application of anthropometric data in design.
4. Engagement in standards development activities, including the initiation of proposals for revisions helped to make the standards development community aware of the knowledge discovered in our research and obtain insight into dissemination needs and methods.
5. Outreach to all stakeholders to develop a community of practice on the topic of anthropometry for people with disabilities.
6. Development of software that would facilitate the extraction of information for the activities above, facilitate use of the data in human modeling and support the expansion of data collection activities to other research groups.
These activities are described in more detail below.
Conference Papers and Journals
From the initial stages of the project, when it was funded by NIDRR, the research staff submitted and presented papers and presentations to annual and other periodic professional conferences. In all cases, our conference papers were peer reviewed and appeared in the proceedings of the conferences, if there were formal proceedings. We have presented 24 papers and additional presentations in the following associations and conferences:
1. Rehabilitation Engineering and Technology Society of North America (RESNA) annual conferences
2. Human Factors and Ergonomics Society annual conferences
3. Digital Human Modeling for Design and Engineering Symposium (annual)
4. International Applied Human Factors and Ergonomics (AHFE) annual conferences
5. INCLUDE (international bi-annual conference of design researchers interested in inclusive design)
6. International Conference on Aging Disability and Independence (internationalbi-annual conference)
7. Transportation Research Board annual conferences
8. TRANSED (international bi-annual conference of professionals interested in accessibility to public transportation)
9. American Institute of Architects annual conferences
In several conferences, we organized symposia or workshops on the topic of the anthropometry of disability. The latest examples were a workshop at the RESNA conference in June of 2010 that attracted an audience of about 100 rehabilitation professionals and scientists and a symposium at the AHFE. We have received extensive positive feedback on the quality and importance of the work.
Conference papers are short in format and thus are usually very focused. After developing conference papers, we expanded the papers and developed peer-reviewed articles for scientific journals. These articles are the gold standard of research publications because they are archived in research libraries and available through online searches. Rigorous peer review procedures insure a high quality. Acceptance for publication means that the article has been vetted by other experts and has reached or exceeded their standards of quality. We have published 8 peer reviewed journal articles and have several others in process. We edited two special issues of journals that included articles from both our research group and other colleagues working in this field. One appeared in the International Journal of Industrial Ergonomics (2004) and the other in Assistive Technology (2010). These two issues are now key resources for researchers in the field.
The published papers and journal articles are now available to provide evidence for proposed revisions to standards in a concise and carefully documented form. They provide background on the methods we developed for conducting the research, the importance of the specific topic to people with disabilities, the results of our research and the implications of those results for design, standards and policy. Topics addressed include the structural anthropometry methods, the functional anthropometry methods, clear floor area, reach, grip force, the interactive database, building design applications, transportation applications and the comparison of standards and research. The full list of publications is provided in the Appendix.
Workshops
With separate sponsorship from the U.S. Access Board prior to this project, we held two international workshops that focused on current issues of applying the anthropometric data of individuals with disability to design. These provided venues in which people from around the world exchanged ideas about the current issues in the collection of anthropometric data, digital human modeling and the applications of the data in design. In each, we also discussed the special nature of anthropometry of disability and wheeled mobility users in particular, for example, the limitations of using full body scanning due to occlusion of body landmarks by WhMD.
“The Anthropometrics of Disability” workshop was held in June of 2001 and was attended by 40 experts in the areas of anthropometry, human modeling, data fusion and population-based statistics. Participants included researchers, standards developers, experts in accessible design and wheelchair designers. A workshop report that summarizes the workshop’s outcomes is available at http://www.udeworld.com/anthropometrics.html. It describes advances in the state of the art in anthropometry, the challenges of measuring people with disabilities and recommendations made by the experts at the workshop. This report formed the foundation for a special issue of the International Journal of Industrial Ergonomics titled “Anthropometry and Disability” that was published in 2004.
“Space Requirements for Wheeled Mobility” workshop was held in 2003. It was attended by 70 experts from the U.S. and abroad. The participants represented the fields of anthropometry, biomechanics, human factors engineering, human modeling, rehabilitation engineering, standards development, wheelchair manufacturer and consumer advocacy. A second workshop report was produced and is available at http://www.udeworld.com/anthropometrics.html. It provides abstracts of commissioned and submitted papers as well as a description of the discussion that followed each paper presentation. The presentations made at this workshop formed the basis of what eventually became a special issue of Assistive Technology titled “Space Requirements for Wheeled Mobility” that was published in 2010.
Standards Development
Task 2 of this contract focuses on engagement in the International Standards Organization’s effort to develop an international standard on accessible building design. This task was included in the contract because a member of the Committee encouraged us to become involved in their activities with the goal of establishing an international research effort to utilize our methodology. The budget for the contract, however, only allocated travel funds to attend meetings. The staff effort was to be contributed by project staff. We first had to establish a vehicle for participating. We obtained approval to work through RESNA, which is the designated organization to represent the U.S. in ISO activities related to accessibility. But, after contacting the ISO committee leadership and talking to two other members, it turned out that our involvement was not particularly welcomed by committee members and leadership. They had almost completed their work and were reluctant to open their agenda to another round of development, revision and balloting. Thus, we terminated our effort on that task but also did not expend the travel funds allocated to it for international travel.
However, the project team has engaged in many other standards development activities:
1. Revisions to ICC/ANSI A117
2. Development of Standards for Universal Design
3. Development of new accessibility standards in other countries
4. Revisions to ADA regulations on accessible transportation
The ICC A117.1 standard initiated a round of revisions in 2003, which only recently has been completed. At the beginning of the revision process, the Committee invited Dr. Steinfeld to make a presentation of the project at one of its meetings. Early in the review process, based on evidence from the initial data collection activities, the staff prepared a series of proposals for changes to the existing standard. Dr. Steinfeld made another presentation about the progress of the project during the balloting process. The Committee voted to establish a Task Force on Anthropometry to consider the implications of the research. Dr. Steinfeld was appointed to this Task Force. However, the Task Force had only two meetings, by teleconference. At the first meeting, they decided to table our proposals until the current work was completed. At the second meeting, the Task Force voted to begin work immediately after they finished the current cycle. Recently, the cycle was completed and the plan is now to begin meetings of the Task Force sometime after January 1, 2011. We expect to work with this Committee over the next three years to develop a process for addressing the implications of our findings (see Section 4.0) for accessibility standards used in regulatory activities.
In 2008, an effort began to develop universal design (UD) standards through the newly formed Global Universal Design Commission (GUDC). The purpose of these standards is to complement minimum accessibility standards by providing the incentive of certification for achieving a higher level of accessibility and usability. Buildings will be certified based on the incorporation of universal design features. Designers will be accredited through an educational program. The first version of the GUDC standards, approved this past summer, utilized the findings of this research to incorporate higher levels of accessibility for wheelchair users than those that are currently incorporated into minimum accessibility standards. To support certification and accreditation efforts, the IDeA Center is developing a series of Design Resources summarizing knowledge from scientific research. One of the first sets of Design Resources is on the findings of this project. Although this is a voluntary effort, we expect that experience with the GUDC standards will identify best practice strategies for providing accessibility for the larger devices and individuals with more limited reaching and gripping abilities. Documenting these solutions will help to advance the field and build a base of support for improving mandatory standards. The first building designed with the new standards is under construction and we will be documenting and evaluating it over the next two years.
Through our dissemination efforts, knowledge about our work has been spreading around the world. The Province of Ontario (Canada) started an effort to revise its accessibility standards last year. The project team was contacted to provide input into the new standards. A presentation was made to the working committee developing policy recommendations. In the coming year, actual work on the standards will commence. We expect that the committee will utilize our findings to address the need for accessibility for larger devices. This standard will serve as a good model for drafting standards in the U.S. standards developers in Ireland are also working on improving their standards. They utilized our Design Resources and publications in their work and recently informed us that the new standards will incorporate larger turning areas that are based on our findings.
This year the Access Board issued an NPRM on changes to the ADA requirements for transit vehicles. We submitted comments on the proposed rules with documentation based on our research findings. We are currently conducting additional research and development activities through another grant in which we will initially be developing tools for the transportation industry that will include the accommodation models and digital models for design of new vehicles. The next step will be to develop a “standard of practice” for the industry in accommodating WhMD users that will include the use of these models as part of the design process. We hope to work with the American Public Transportation Association and/or SAE to develop those standards.
Database Development
Three goals drove the development of the database software:
1. Provide a flexible tool for standards developers to assess the implications of decisions in a “what if” mode.
2. Provide a resource that can support human modeling of wheeled mobility device users.
3. Provide a foundation for future multi-site and international research in this field.
Most anthropometry results are conveyed through tables and two-dimensional illustrations of the body. The availability of 3-D anthropometry tools like the ones we used and 3-D computer graphics provides the opportunity to develop much more sophisticated design tools that can be integrated into the design process for everyday use. Designers are rapidly adopting 3-D design software since lower cost products like SketchUp became available and increased competition. While most designers are not currently using digital human modeling software to test their designs for human fit on an everyday basis, there will someday be a market for low cost easy to use human modeling tools. Anticipating this eventuality, we developed a database with the ability to integrate the data with human modeling and 3-D design software. The 3-D coordinate data for each individual are archived as individual datasets in a relational database. This provides the ability to retrieve and analyze the data in many ways, including the ability to construct 3-D static digital representations of the individual and mobility device (D'Souza et al., 2007; 2010a), as well as generate summary statistics on a number of different body and device dimensions (Paquet & Feathers, 2004).
The visual interface software to the database was developed using Microsoft Visual C++ and OpenGL (D’Souza et al., 2010a). The software application generates in runtime both graphical and numeric displays such as histograms, summary statistics, percentile values, etc. for a sub-group of individuals based on user-selected demographic and anthropometric variables (Figure 5-1), or digital human models of specific individual cases. These individual cases can be selected from a sub-sample using an interactive histogram that helps identify individuals who possess extreme or ‘outlier’ values for a particular dimension, i.e. starting at the tails of the distribution. This provides designers and standards developers with in-depth information on the characteristics and functional abilities of certain individuals who present design needs beyond that of the typical wheelchair sub-sample.
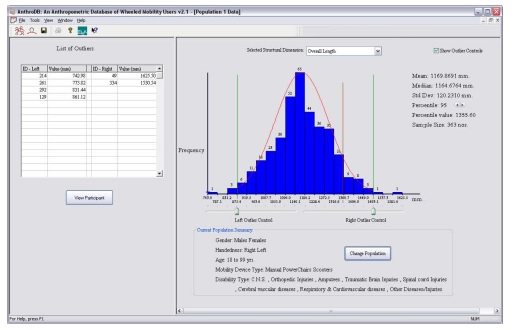
Figure 5-1. Example of interactive histogram of an anthropometric dimension (here overall length) that allows individuals (listed on the left) to be selected for additional analysis.
The user interface allows designers and standards developers to identify who could successfully fit in a clear floor space, or complete a maneuvering or reaching task in a particular environment in real time and who cannot (outliers). For example, in Figure 5-1 above, the histogram has two vertical lines on each side of the distribution. By sliding the lines right or left, the operator can define a target population by manipulating the parameters of the environment, in this case occupied length of the device. Data on that selected population appears at the top right as the bars are moved.
We have also integrated other information search capabilities. For example, a list of “outliers”, cases who are not accommodated by the parameters selected appear in the list at the top left of the screen in Figure 5-1. By clicking on any case, a window opens with the data for the individual selected. Photographs of that individual and the figure model can be accessed from that new screen (Figure 5-2). Using menu driven tools on the screen, operators can define sub-samples to analyze by selecting values for variables like age, gender, type of device used, etc., and the data for the selected sub-samples immediately appears. The data can be saved for comparison purposes. We developed interactive tools like this for device and occupant characteristics, maneuvering performance tasks, grip strength and reaching tasks (D'Souza et al., 2009a).
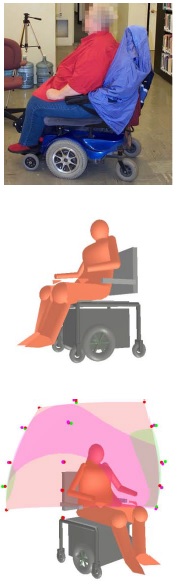
Figure 5-2. 3D human model and visualization of reach data of a female power wheelchair user.
Long Description: Figure 5-2 shows a photograph of a female power wheelchair user in the database along with the corresponding digital model and superimposed reach envelopes color-coded for different object weight conditions. Using 3-D coordinate data for constructing the model helps to create digital models that reflect the relative size, position and spatial orientation of individual body size and postures, and device size and shape. Reach envelopes are constructed using maximum reach distances recorded electromechanically in an object transfer task. These reach distances were measured in 3-D at five normalized shelf heights in three different directions (lateral, forward and an intermediate 45 degrees) resulting in 15 reach data points for each of four different weight conditions 0 kg, 0.45 kg, 1.36 kg and 2.27 kg (0, 1, 3, 5 lbs.) to simulate reach and object placement conditions one might attempt during typical activities of daily living.
Through data collection activities with two subcontractors, we developed a training program and manual to teach other researchers how to collect the data. We also developed error-checking software that researchers can use once data is collected from a participant to reduce measurement error in the field. Finally, we developed software tools that allow us to complete quality assurance on data sets developed by others in order to identify missing data and errors in measurement. These can then be used to correct data before adding it to the database or delete inadequate data records. This last set of software tools also manages the input of the new data set with our existing archive.
Now that data collection is complete, we will begin conducting other outreach activities that will include inviting other researchers to use our data and collect new data sets to add to the archive and potentially merge with ours. We will also offer use of the database to standards developers and policy makers, including the Access Board. We have considered providing web based access to the database but have concluded that it would take significant effort to support it. Thus, we are hesitant to make it widely available without having the resources to provide the support needed.
We have approached human modeling software developers to ascertain their interest in using the database to incorporate human modeling of wheelchair users into their programs. One company that makes ergonomic modeling software has shown interest but, at this date, they have not been willing to invest their own funds to develop such applications. We believe that this lack of interest indicates that there is not yet a clear market for such a product. Most commercial human modeling software are used for biomechanical analysis (e.g. evaluation of low back stress during lifting, etc.) and for animation. Thus, commercial tools are focused primarily on those activities, not anthropometric fit. We will continue discussions with them and engage discussion with other companies. We may also seek funding to develop our own “plug-ins” that can interface with commercial programs.
Online Course
A self-instructional online educational course has been developed to use in continuing education and installed on an IDeA Center website (http://www.udeworld.com/training/continuing-education.html). This course is designed to meet the requirements of the American Institute of Architects for online learning (the IDeA Center is an accredited provider). It provides an overview of the project, three modules on the findings, implications for design and a link to resources like the reference list of publications derived from the project, the Final Report and the collection of Design Resources. Completing the evaluation quiz sends an email with results to the IDeA Center for review. The online course is designed for expansion by adding more modules. It will be managed and administered through the IDeA Center’s online education program. The Access Board can also use this program for its own educational efforts.
Section 6.0 Conclusions
The key findings of the research are:
1. Sample composition: There are important differences in the sample based on recruitment methods. This emphasizes the importance of multi-site studies for this population.
2. Diversity: There are often large differences in the body and chair sizes and in the functional abilities of manual chair, power chair and scooter users, and men and women.
3. Measurement parameters: There are no generally accepted and shared definitions of variables for both anthropometric research and standards development, which impedes integration of research and practice.
4. International comparison: Different countries use different approaches to developing standards based on anthropometry. None of the standards reviewed had a comprehensive and explicit approach to evidence based practice.
5. Landmarks: Some dimensions in standards do not correspond to clear measurement landmarks on the body and device, creating barriers in translating research findings to standards development.
6. Reference WhMD: The U.S. standard reference wheelchair does not represent the sizes of unoccupied wheelchairs in our sample well. Contemporary wheeled mobility devices are much more diverse in size and features than the reference wheelchair.
7. Clear floor space: A large minority of participants in our research would not be accommodated by the current U.S. standard for clear floor space, especially for length. The people excluded include those who use any of the three types of WhMD. Other countries have already increased the clear floor space used in their standards.
8. Seat height: Seats for a majority of our sample have seat heights above that shown in the reference wheelchair in U.S. standards, especially the power chairs and scooters.
9. Knee and toe clearances: Current U.S. standards for knee and toe clearances do not accommodate a majority of participants in our sample.
10.Maneuvering clearances: A significant proportion of WhMD users, scooter users in particular, are not accommodated by current maneuvering clearances in U.S. standards, although the proportion differs for different clearances. In particular, the current standards do not accommodate most of our sample for completing a 360-degree turn. There are also a small number of participants in all categories who require much larger clearances than current standards provide.
11. Reaching ability: A significant percentage of WhMD users have very limited functional reaching abilities.
12. Reach limits: A majority of WhMD users cannot complete a forward reach to the minimum forward reach height in U.S. standards on a vertical plane in front of their anterior most point (toes or device). The current high side reach limit accommodates WhMD users. The low reach limit, as defined, is currently inappropriate for safety reasons.
13.Operating forces: The maximum operating force in the current standards is too high for the majority of WhMD users.
14. Door usability: The usability study confirmed many of the existing clearance requirements for doors but also identified the need for improving some others, especially the door clearance width. Findings support the increased use of automated doors and the development of improved closer technologies.
The research findings highlight the importance of integrating research with standards development, organizing research collaborations and the need to develop standardized research methods. Now that a foundation of tools and procedures has been developed and extensively tested for systematic scientific research in this field, the cost of implementing future research using these methods is significantly reduced.
There is still much knowledge to be gained from further analysis of the data collected. The database is available for other invited researchers to utilize. The data is also available for use by human modeling software developers to augment their databases of people with no disabilities. The research team anticipates the development of future research collaborations, dissemination activities and standards development activities.
Much was learned about anthropometry of wheeled mobility during the course of this project. Yet, much more needs to be discovered. In particular, there is a need to continue gathering data to keep pace with developments in practice. A good model is the periodic survey conducted in the U.K. (Stait et al., 2000; Hitchcock et al., 2006). While the research methods used in the U.K. program (2-D photogrammetry) only provide data on limited landmarks like occupied width and length and the features of devices, it can be used to identify trends in equipment used by consumers and the need for targeted studies on specific types of devices.
Having established an extensive database, the need to measure a large number of people with three-dimensional methods is now reduced. The current data archives will provide sufficient data to answer many research questions. But, the findings show that different data collection sites have access to different user groups. Thus another important research activity in this field should be the development of a long range data collection effort on a national scale with a diverse set of research settings. Small numbers of people can be measured by cooperating with clinical settings and equipment moved from place to place. Developing a network of data collection settings in academic rehabilitation science departments or major clinical settings could also help to improve education on accessibility for the rehabilitation professions, an important stakeholder group, and build capacity for research.
Research that would produce longitudinal data on WhMD use would be very useful, especially to improve WhMD design and reimbursement policies. The current sample could serve as a recruitment pool for such a project. When recruiting individuals, we asked for permission to retain their contact information for future research and most participants agreed. Some are already participating in other research at the IDeA Center. Our demographic survey results and other anecdotal information obtained by WhMD users suggests that wheeled mobility device users often have more than one device, use different devices for different purposes and have unmet needs for equipment that are not being addressed by current third party reimbursement policies. An individual’s needs also change over time with age and stage of life as they pursue different social roles and their body changes. In particular, the impact of progressive diseases like MS, ALS, Parkinson’s Disease and Post Polio Syndrome, on equipment needs requires more information. A longitudinal study could identify the long-range experience of consumers of devices. It could also explore the needs for consumer education and changes in purchasing policy to improve appropriate selection of devices for the environments in which they are used.
In-depth studies with small samples are needed to understand the interaction of wheeled mobility users with the built environment. The resources available in this study were devoted to measuring a large sample of individuals. In-depth studies are needed on the performance of WhMD users in specific environments such as workstations, paratransit vehicles and taxis, rest rooms on vehicles, doorways and ramps. More extensive research on doors than what was conducted in this project would be valuable as well. Such studies should examine the effect of learning on task performance. Currently, the IDeA Center has in-depth studies underway on short ramps, public transit buses and outdoor walking surfaces. We are applying new research methods to collect data on participants in motion in order to develop dynamic human models. Many of our research participants come from our sample pool and we will complete structural measurements for new participants as they are recruited and add those measurements to the database archive. The new research will allow us to study the relationships between demographic variables, structural and functional anthropometric variables, and task performance in motion, similar to what we did with the door maneuvering study but including quantitative body motion analysis performance variables.
In dissemination, the research team will continue to publish refereed journal articles based on our research. Updates will be made to existing articles on reach, clear floor area, turning space and structural measurements. New articles will be completed on door maneuvering, and knee and toe clearance. We will also prepare a proposal to a scientific book publisher to produce an authoritative book on the anthropometry of wheeled mobility that brings all the articles that we and our colleagues at other research centers have written together. This publication will also include all the accommodation models.
The long-range goal of applying the database through human modeling needs continued attention. We hope this will occur first through efforts to develop a standard practice on accessible design of transportation vehicles. This will include the further development and testing of the accommodation models and the development of a series of 3-D virtual manikins that can be used to test vehicle designs in virtual 3-D space. Outreach will also be conducted to find a human modeling software producer to adopt the database as part of a commercial product.
In standards development, the first priority will be to work with the Task Force on Anthropometry of the ICC/ANSI A117 Committee, the Province of Ontario Committee and the GUDC Consensus Standards for Commercial Buildings Committee, all of which have expressed strong interest in our findings and recommendations. Working with three standards groups simultaneously, we hope to evolve a new approach to the “building blocks” of wheeled mobility anthropometry that can take into account larger devices in a cost effective manner.
Another important stakeholder group in the standards field is RESNA’s WC−19 Committee on wheelchair standards. The major U.S. wheelchair manufacturers are also involved in this effort. This seems to be the most likely venue to engage the industry in developing initiatives to develop wheelchairs that provide more accessibility in the built environment and consumer and professional education materials to inform customers and rehabilitation practitioners on the features they should seek when purchasing equipment. Engaging experts from the manufacturing sector and R&D organizations to assess the future of WhMD design is very important both in learning what changes may be on the horizon that could affect anthropometry of WhMD and also to help improve the usability of new products within the built environment. RESNA is another good venue for this type of effort.
There is also a need for further education among those in the design professions, consumers and those in the rehabilitation science professions. By providing the existing online course to all three audiences, we can assess additional educational needs and evaluate its features and content. This feedback will be used to make improvements in the current course. It will also help to define the priorities for further modules which could include additional design issues, research methodology, use of the interactive database, and design applications. This educational work can include findings from current targeted research studies underway at the IDeA Center. The present course is designed to fit the scope of a self-instructional module but future development could also include a longer-range program with instructors for a more extensive and in-depth continuing education experience.
List of References
American National Standards Institute Inc. (1980). A117.1‒1980, Specifications for making buildings and facilities accessible to and usable by physically handicapped people. New York, ANSI.
American National Standards Institute Inc. (1998). A117.1‒1998 Accessible and usable buildings and facilities. New York, International Code Council, Inc.
Bails, J. H. (1983). Project report on the field testing of the Australian standard 1428‒1977 part 1-Recommended amendments and index to part 2 detailed reports. Adelaide, South Australia, Public Buildings Department.
British Standards Institution (2001). BS8300:2001 Design of buildings and their approaches to meet the needs of disabled people-Code of practice. London, U.K, BSI.
Canadian Standards Association (2004). National Standard of Canada CAN/CSA B651‒04 Accessible design for the built environment standard. Mississauga, Ontario, Canada, Canadian Standards Association (CSA).
Cooper, R. A., and Cooper, R. (2003). Trends and issues in wheeled mobility technologies. Presented at an international workshop on Space Requirements for Wheeled Mobility Workshop, October 9‒11, 2003, at the IDeA Center, Buffalo, NY. Retrieved December 20, 2010, from http://www.ap.buffalo.edu/ideaproto/Space%20Workshop/Papers/WEB%20-%20Trends_Iss_WC%20(Cooper).htm.
D'Souza, C., Feathers, D., and Paquet, V. (2007). Constructing Three-Dimensional Models of Individuals and Their Wheeled Mobility Devices from Landmark Data. Technical Paper 2007‒01‒2494. 2007 Digital Human Modeling Conference, Seattle, WA, SAE Inc.
D'Souza, C., Paquet, V., Steinfeld, E., and Feathers, D. (2010a). Anthropometric Data Visualization Tools to Improve Accessibility of Built Environments. 3rd International Conference on Applied Human Factors and Ergonomics, 2010 AHFE International, Miami, Florida, Taylor and Francis, Ltd.
D'Souza, C., Steinfeld, E., Paquet, V., and Feathers, D. (2010b). Space requirements for wheeled mobility devices in public transportation: An analysis of clear floor space requirements. 89th Annual Meeting of the Transportation Research Board, Washington, D.C., TRB, National Research Council.
D'Souza, C., Paquet, V., Joseph, C., and Feathers, D. (in review). Hand size and functional grip capabilities of wheeled mobility device users. Applied Ergonomics.
D’Souza, C., Steinfeld, E., and Paquet, V. (2009a). Functional reach abilities of wheeled mobility device users: toward inclusive design. 2009 International conference on Inclusive Design, INCLUDE 2009, London, UK.
D’Souza, C., Steinfeld, E., and Paquet, V. (2009b). Functional reach for wheeled mobility device users: A comparison with ADA-ABA guidelines for accessibility. Rehabilitation Engineering Society of North America (RESNA) Annual Conference 2009, New Orleans, June 2009.
Danford, G. S., Steinfeld, E. (1999). Measuring the influences of physical environments on the behaviors of people with impairments. . Enabling environments: Measuring the impact of environment on disability and rehabilitation. Ed. E. Steinfeld and G. S. Danford. New York, NY, Kluwer Academic/Plenum Publishers.
Feathers, D., Paquet, V., and Drury, C. (2002). Effects of automation of measurement error and consistency in anthropometry. Human Factors and Ergonomics Society 46th Annual Meeting, Baltimore, MD.
Feathers, D., Paquet, V., and Drury, C. (2004a). Measurement consistency and three-dimensional electromechanical anthropometry. International Journal of Industrial Ergonomics Special Issue on Anthropometry and Disability 33(3): 181‒190.
Feathers, D., Paquet, V., and Steinfeld, E. (2004b). Anthropometry manual for three dimensional measurement. Buffalo, NY, Center for Inclusive Design and Environmental Access.
Flagg, J. (2009). Wheeled Mobility Demographics. Industry Profile on Wheeled Mobility Ed. S. Bauer and M. E. Buning. Buffalo, NY, Rehabilitation Engineering Research Center on Technology Transfer: 7‒29.
Graham, I. D., Logan, J., Harrison, M. B., Straus, S. E., Tetroe, J., Caswell, W., and Robinson, N. (2006). Lost in knowledge translation: Time for a map? Journal of Continuing Education in the Health Professions 26(1): 13‒24.
Hitchcock, D., Hussey, M., Burchill, S., and Galley, M. (2006). A Survey of Occupied Wheelchairs and Scooters: Conducted in 2005. Leicestershire, UK, Centre for Employment and Disadvantage Studies.
International Code Council / American National Standards Institute Inc. (2003). A117.1‒2003 Accessible and usable buildings and facilities. New York, International Code Council, Inc.
Joseph, C., D'Souza, C., Paquet, V., and Feathers, D. (2010). Comparison of hand grip strength between wheeled mobility device users and non-disabled adults. 3rd International Conference on Applied Human Factors and Ergonomics, 2010 AHFE International, Miami, Florida, Taylor and Francis, Ltd.
Kaye, H. S., Kang, T., and LaPlante, M. P. (2000). Mobility Device Use in the United States. Disability Statistics Report, June 2000, Number 14. Retrieved April 4, 2009, from http://dsc.ucsf.edu/pub_listing.php?pub_type=report.
Lane, J., and Flagg, J. (2010). Translating three states of knowledge - discovery, invention, and innovation. Implementation Science 5(9).
LaPlante, M. P., and Kaye, H. S. (2010). Demographics and Trends in Wheeled Mobility Equipment Use and Accessibility in the Community. Assistive Technology: The Official Journal of RESNA 22(1): 3 - 17.
Paquet, V., and Feathers, D. (2004). An anthropometric study of manual and powered wheelchair users. International Journal of Industrial Ergonomics Special Issue on Anthropometry and Disability 33(3): 191 - 204.
Paquet, V., Lenker, J., Feathers, D., and Nasarwanji, M. (2008a). Incorporating the principles of universal design into assessment of product usability. Proceedings of the 2nd International Conference on Applied Human Factors and Ergonomics. Las Vegas, Nevada.
Paquet, V., Nasarwanji, M. F., Lenker, J. A., and Feathers, D. (2008b). Incorporation of universal design into mainstream consumer product design processes. The International Conference of Aging, Disability and Independence. St Petersburg, FL.
Paquet, V., Joseph, C., and D’Souza, C. (In preparation). Use of computerized re-sampling to combine data from multiple samples for population-based anthropometric analysis.
Raymond, M., Pontier, D., Dufour, A.-B., and Moller, A. P. (1996). Frequency-Dependent Maintenance of Left Handedness in Humans. Proceedings: Biological Sciences 263(1377): 1627‒1633.
Ringaert, L., Rapson, D., Qui, J., Cooper, J., and Shwedyk, E. (2001). Determination of new dimensions for universal design codes and standards with consideration of powered wheelchair and scooter users. Manitoba, CA, Universal Design Institute.
Seeger, B., Costi, J., and Hartridge, M. (1994). Final report of consultancy on wheelchair user requirements for the National Accessible Transport Committee Commonwealth Department of Transport. Kilkenny, South Australia, Regency Park Centre for Young Disabled.
Stait, R. E., Stone, J., and Savill, T. A. (2000). A survey of occupied wheelchairs to determine their overall dimensions and weight: 1999 survey. Berkshire, U.K, TRL Limited.
Standards Australia International (1992). AS1428.2‒1992 Design for access and mobility-Part 2: enhanced and additional requirements-buildings and facilities. Sydney, Australia, Standards Australia International.
Standards Australia International (2001). AS1428.1‒2001 Design for access and mobility-Part 1: general requirements for access-new building work. Sydney, Australia, Standards Australia International.
Steinfeld, E., Schroeder, S., and Bishop, M. (1979). Accessible buildings for people with walking and reaching limitations. U. S. D. o. H. a. U. Development. Washington, DC, U.S. Department of Housing and Urban Development.
Steinfeld, E. (1990). Hands on Architecture: Executive Summary. Washington, D.C., U.S. Architectural and Transportation Barriers Compliance Board.
Steinfeld, E., and Mullick, A. (1990). Universal design, the case of the hand. Innovation, the Journal of the Industrial Design Society of America Fall 1990.
Steinfeld, E., Maisel, J., and Feathers, D. (2005). Standards and anthropometry for wheeled mobility. Report prepared for the U.S. Access Board, Washington, DC. Buffalo: NY, IDeA Center.
Steinfeld, E., D'Souza, C., and Maisel, J. (2010a). Clear Floor Space For Contemporary Wheeled Mobility Users. 12th International Conference on Mobility and Transport for Elderly and Disabled Persons (TRANSED 2010), Hong Kong.
Steinfeld, E., D'Souza, C., Paquet, V., and White, J. (2010b). Clear floor area for wheeled mobility users. 3rd International Conference on Applied Human Factors and Ergonomics. Miami, Florida, Taylor and Francis, Ltd.
Steinfeld, E., Maisel, J., Feathers, D., and D'Souza, C. (2010c). Anthropometry and standards for wheeled mobility: An international comparison. Assistive Technology 22(1): 51‒67.
U.S. Access Board (1994). 28 CFR part 36 Nondiscrimination on the basis of disability by public accommodations and in commercial facilities. Washington, DC, Department of Justice.
U.S. Access Board (2004). Americans with Disabilities Act and Architectural Barriers Act Accessibility Guidelines for Buildings and Facilities. U. S. A. Board. Washington, DC, U.S. Access Board. Federal Register 35455‒35541.
Appendix Two: Design Information and Accommodation Models
Table 1. Research findings on Occupied Height
| Type of WhMD user | Sam-ple Size | Mean (SD) | Min | 5%ile | 10%ile | Me-dian | 90%ile | 95%ile | Max |
| Man-ual chair users | 276 | 1249 (77) | 1020 | 1123 | 1144 | 1253 | 1347 | 1376 | 1459 |
| Power chair users | 189 | 1274 (81) | 1000 | 1140 | 1153 | 1281 | 1373 | 1392 | 1492 |
| Scoot-er users | 30 | 1321 (71) | 1218 | 1220 | 1242 | 1316 | 1434 | 1477 | 1513 |
| All Device Users | 495 | 1263 (80) | 1000 | 1130 | 1152 | 1267 | 1360 | 1385 | 1513 |
Table 2. Research findings on Eye Height, measured on the right eye
| Type of WhMD user | Sam-ple Size | Mean (SD) | Min | 5%ile | 10%ile | Me-dian | 90%ile | 95%ile | Max |
| Power chair users | 189 | 1167 (75) | 932 | 1032 | 1068 | 1168 | 1261 | 1281 | 1365 |
| Scoot-er users | 30 | 1210 (68) | 1093 | 1110 | 1129 | 1195 | 1324 | 1364 | 1387 |
| All Device Users | 495 | 1152 (77) | 898 | 1021 | 1049 | 1155 | 1248 | 1269 | 1387 |
Table 3. Study findings on Armrest height, calculated as the mean height of the four corner points of the arm rest on the right side measured from the floor. The data does not include height measurements from the fifty WhMD users that had no right-side armrest.
| Type of WhMD user | Sam-ple Size | Mean (SD) | Min | 5%ile | 10%ile | Me-dian | 90%ile | 95%ile | Max |
| Man-ual chair users | 228 | 704 (36) | 568 | 650 | 661 | 709 | 748 | 757 | 796 |
| Power chair users | 189 | 726 (53) | 593 | 642 | 666 | 719 | 802 | 816 | 876 |
| Scoot-er users | 28 | 745 (43) | 677 | 679 | 688 | 735 | 812 | 838 | 843 |
| All Device Users | 445 | 716 (46) | 568 | 645 | 663 | 713 | 781 | 801 | 876 |
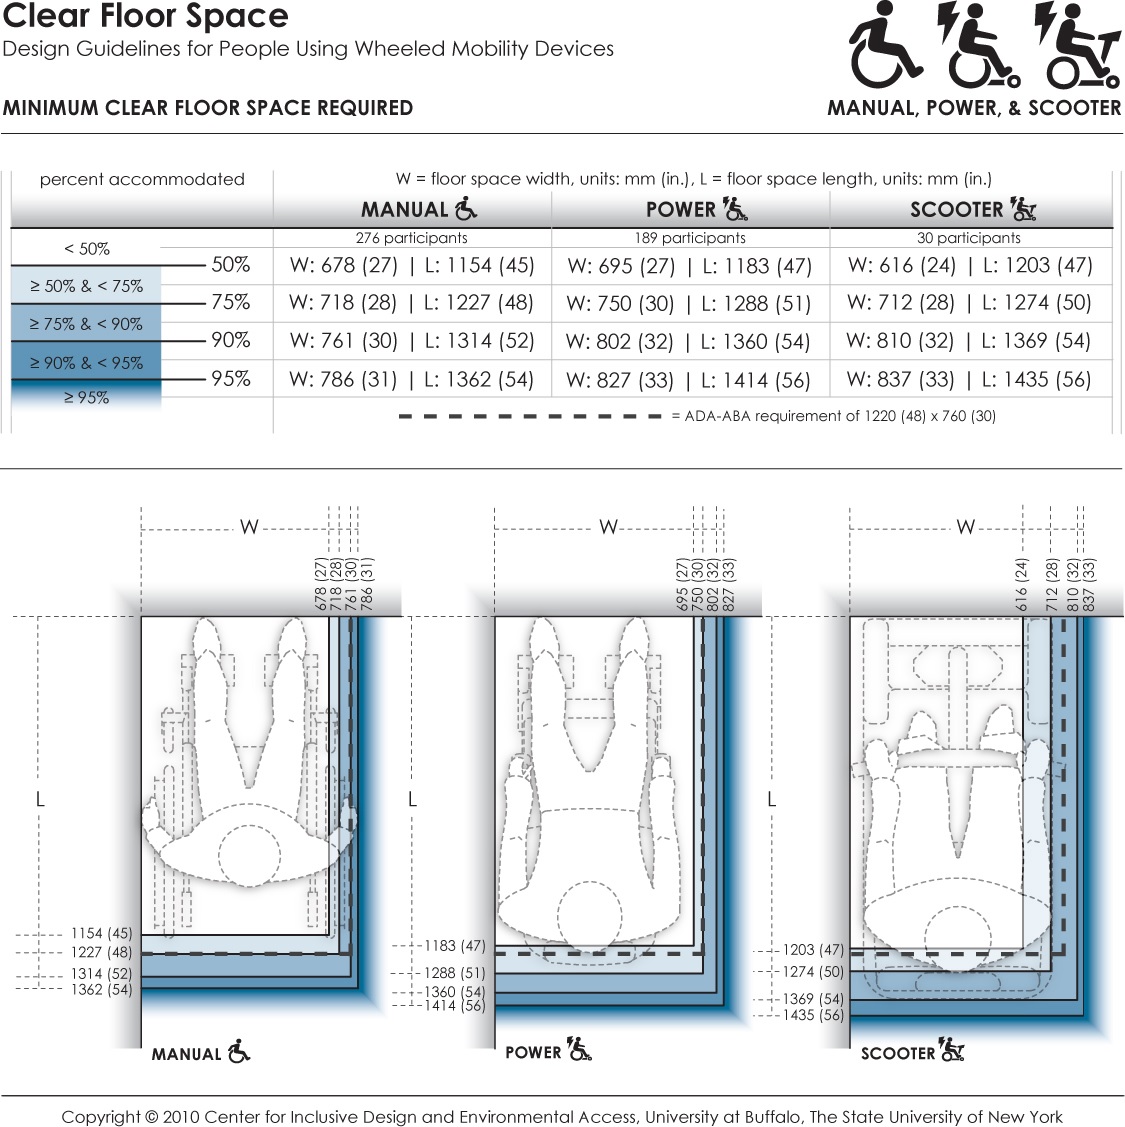
This data provides the minimum dimensions for the rectangular floor area required by occupied wheeled mobility devices (i.e., with the occupant seated in their own wheeled mobility device) when stationary. Clear floor area dimensions are used for determining the size of spaces designated for wheeled mobility users (such as on buses, in movie theaters, sports stadiums). The clear floor area width dimension also informs the minimum clearance width for successful passage through corridors, doorways, and wheelchair ramps. Currently, the ADA accessibility guidelines prescribe a minimum floor area of 760 x 1220 mm (30 x 48 in.) for wheeled mobility access. Dimensions are based on length and width measurements obtained from occupied wheeled mobility devices as part of the Anthropometry of Wheeled Mobility Study. These data suggest minimum clear floor area dimensions of 786 x 1362 mm (31 x 54 in.) for manual chairs, 827 x 1414 mm (33 x 56 in.) for powered chairs, and 837 x 1435 mm (33 x 56 in.) for scooters when needing to accommodate 95% of users.
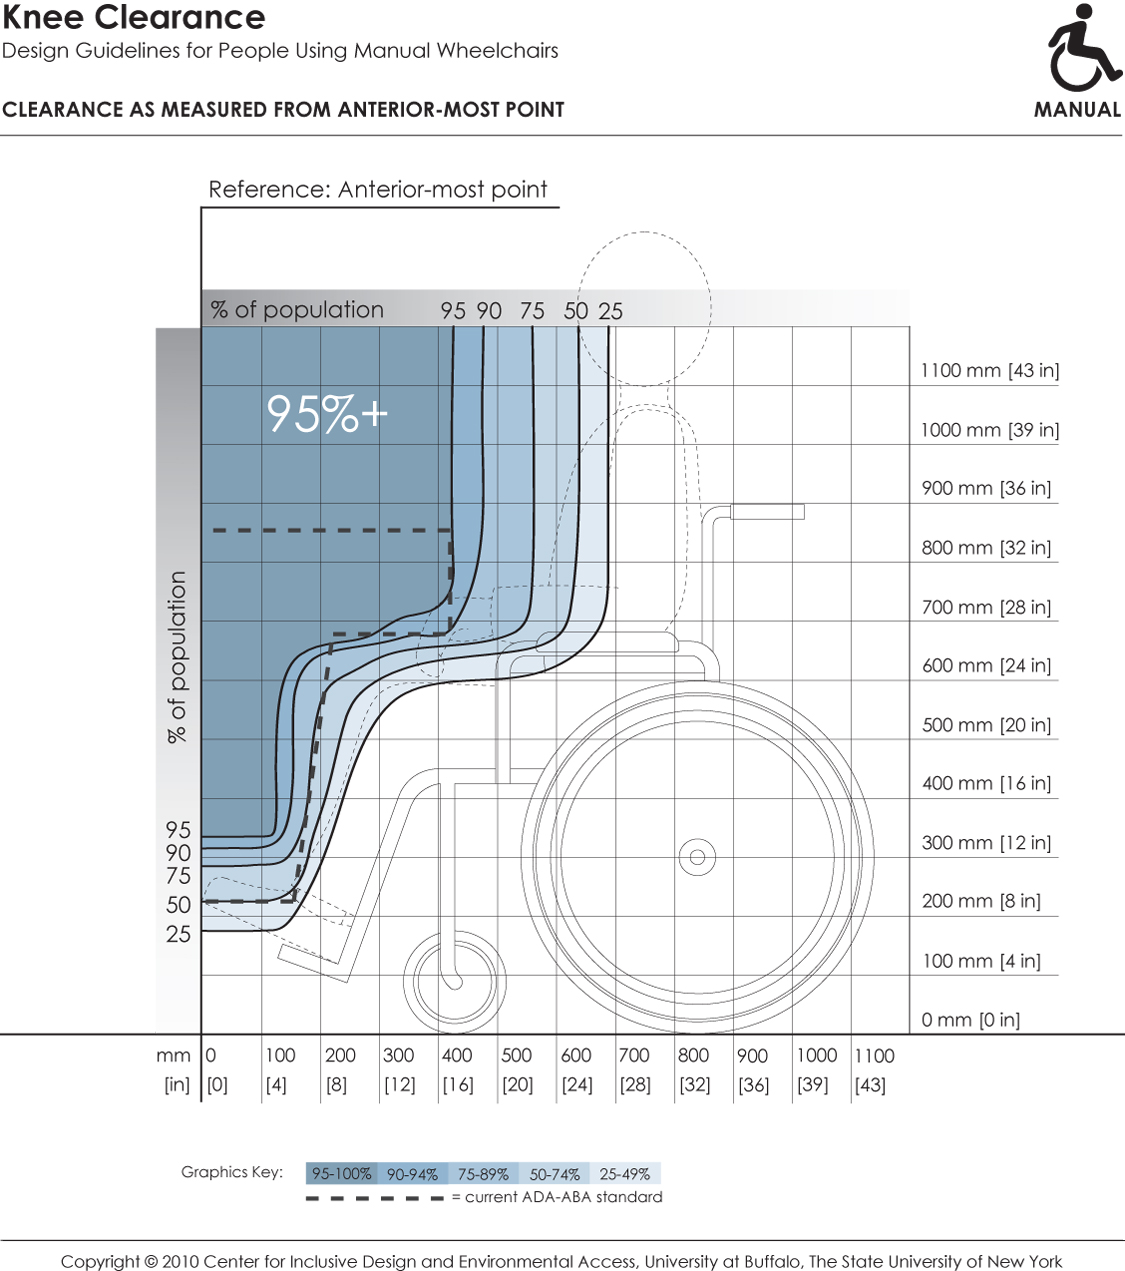
This depicts knee and toe clearance required by manual chair users for forward approach to elements in the built environment (e.g., light switches). It references dimensions of clearance height and depth to the forward-most point on the person or mobility device (e.g., toe, footrest). Shaded areas depict the envelope of space required by the specified percentage of people if positioned with the forward-most point touching the wall. Hence, to accommodate a particular percentage of users, the side profile of a design element (shown by dotted line) should not extend outside the corresponding shaded area.
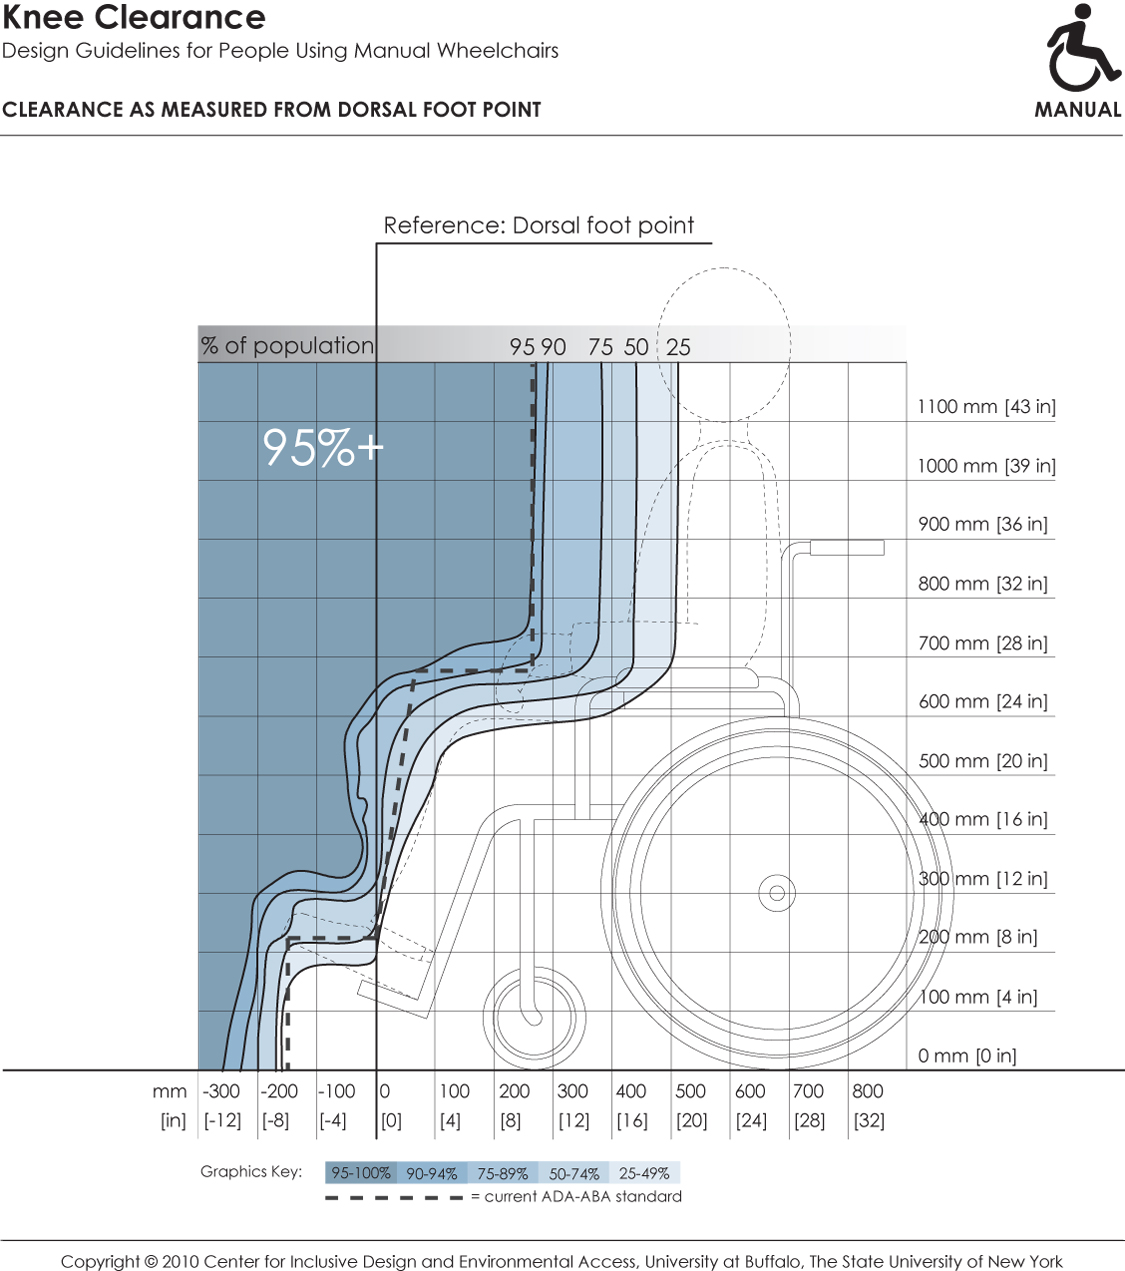
This depicts knee and toe clearance required by manual chair users for forward approach to elements in the built environment (e.g., countertops). It references dimensions of clearance height and depth to the dorsal foot point on a person (e.g., top of ankle). Shaded areas depict the envelope of space required by the specified percentage of people if positioned with the dorsal foot point touching an obstruction. Hence, to accommodate a particular percentage of users, the side profile of a design element (shown by dotted line) should not extend outside the corresponding shaded area.
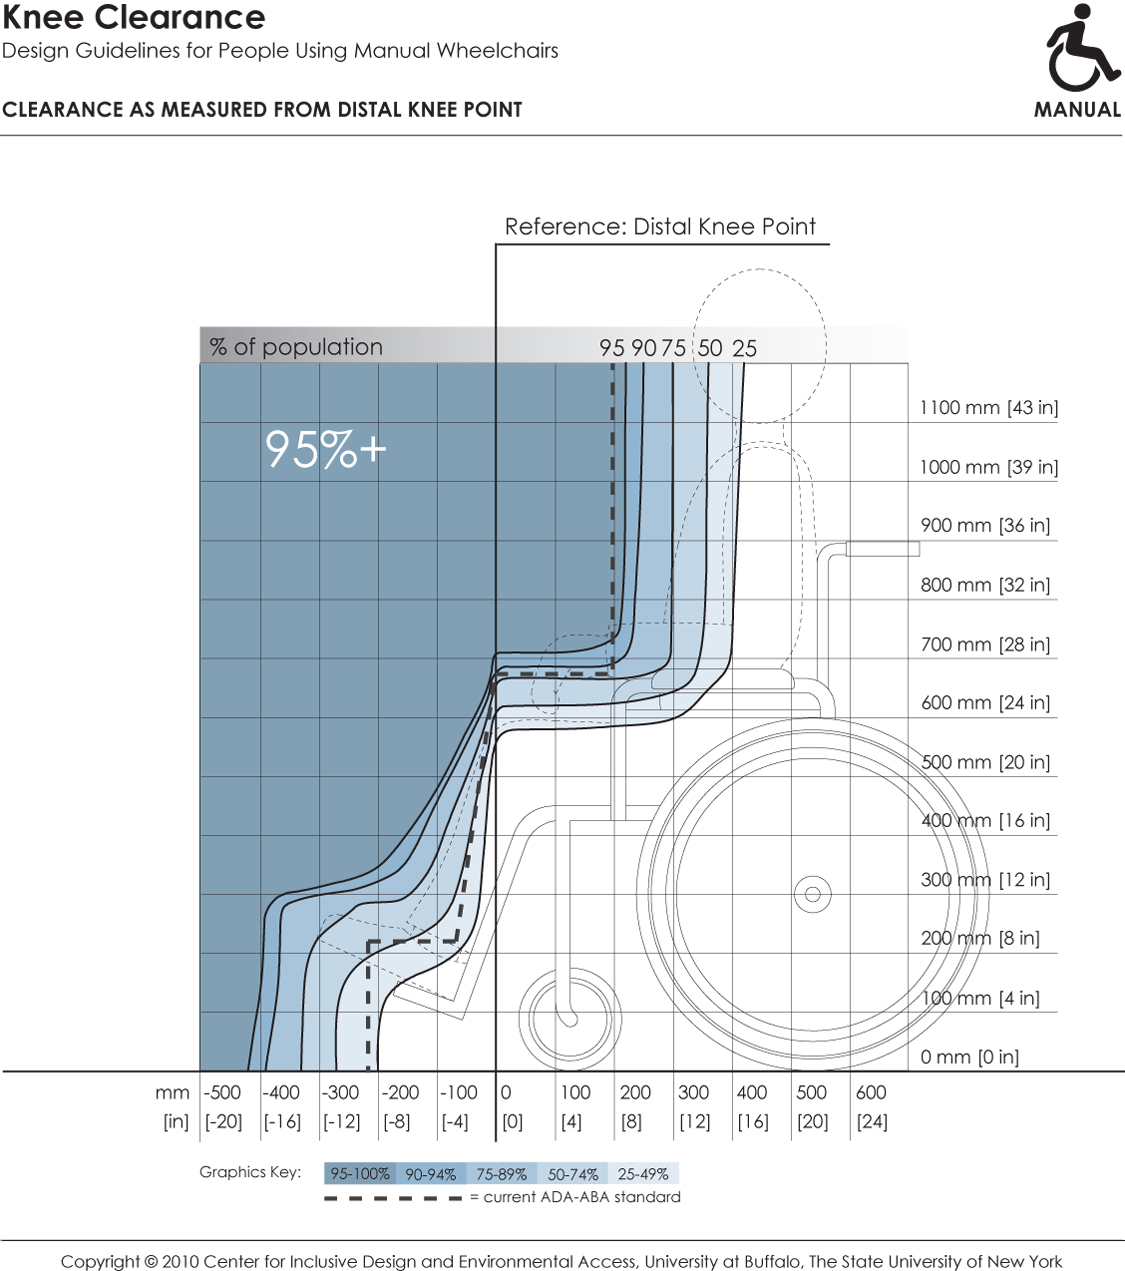
This depicts knee and toe clearance required by manual chair users for forward approach to elements in the built environment (e.g., lavatories, drinking fountains). It references dimensions of clearance height and depth to the distal knee point on a person. Shaded areas depict the envelope of space required by the specified percentage of people if positioned with the distal knee point touching an obstruction. Hence, to accommodate a particular percentage of users, the side profile of a design element (shown by dotted line) should not extend outside the corresponding shaded area.
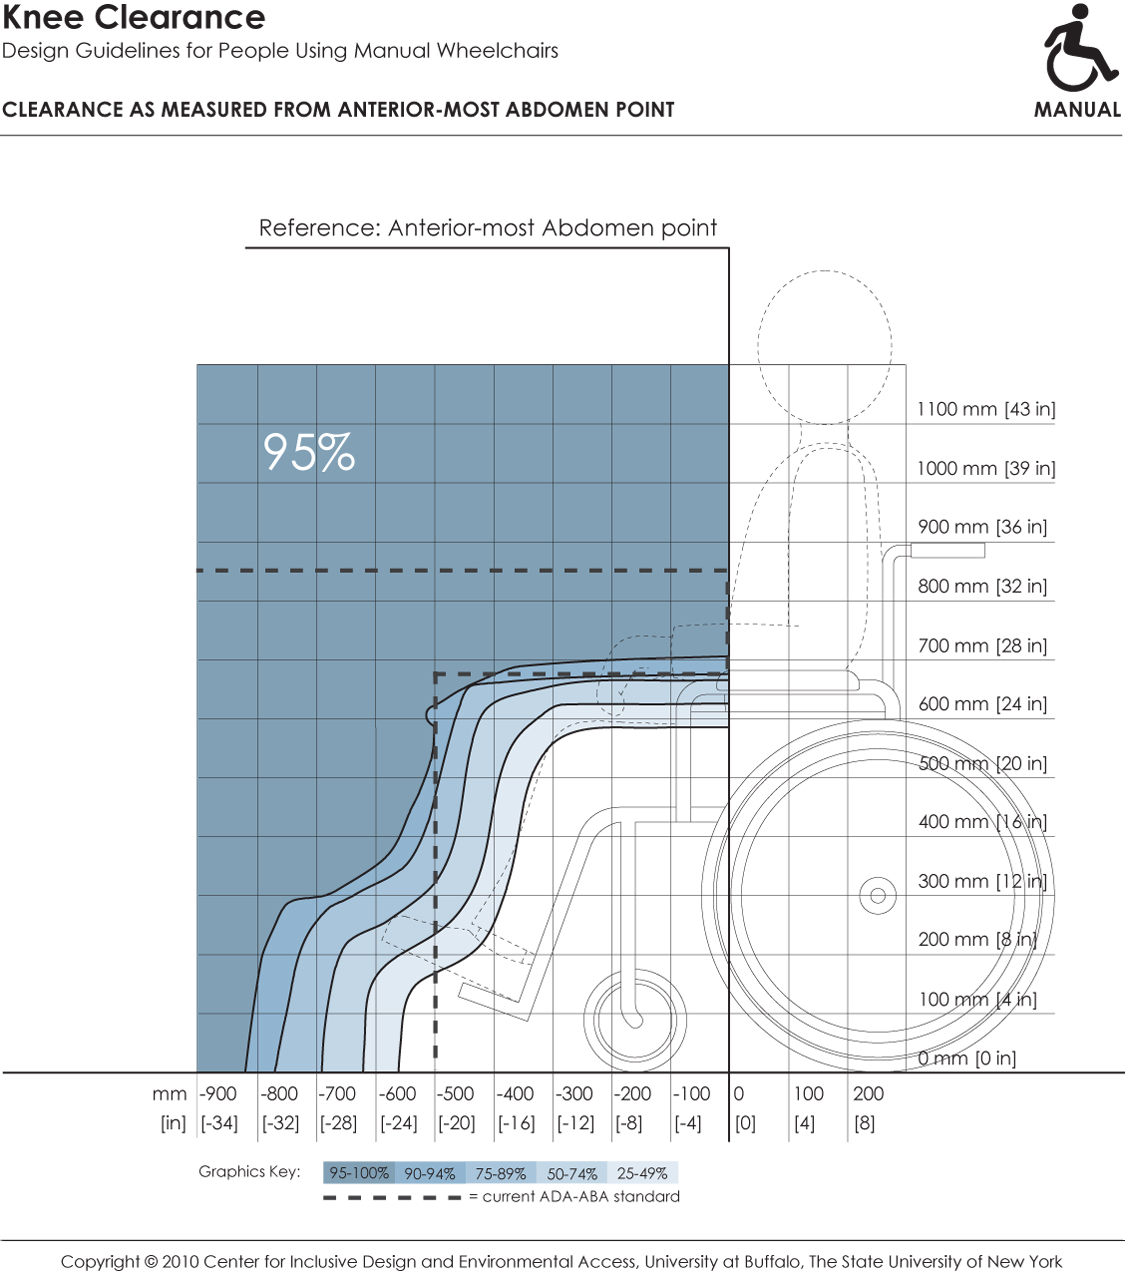
This depicts knee and toe clearance required by manual chair users for forward approach to elements in the built environment (e.g., dining tables). It references dimensions of clearance height and depth to the forward-most abdomen point on a person. Shaded areas depict the envelope of space required by the specified percentage of people if positioned with the abdomen touching an obstruction. Hence, to accommodate a particular percentage of users, the side profile of a design element (shown by dotted line) should not extend outside the corresponding shaded area.
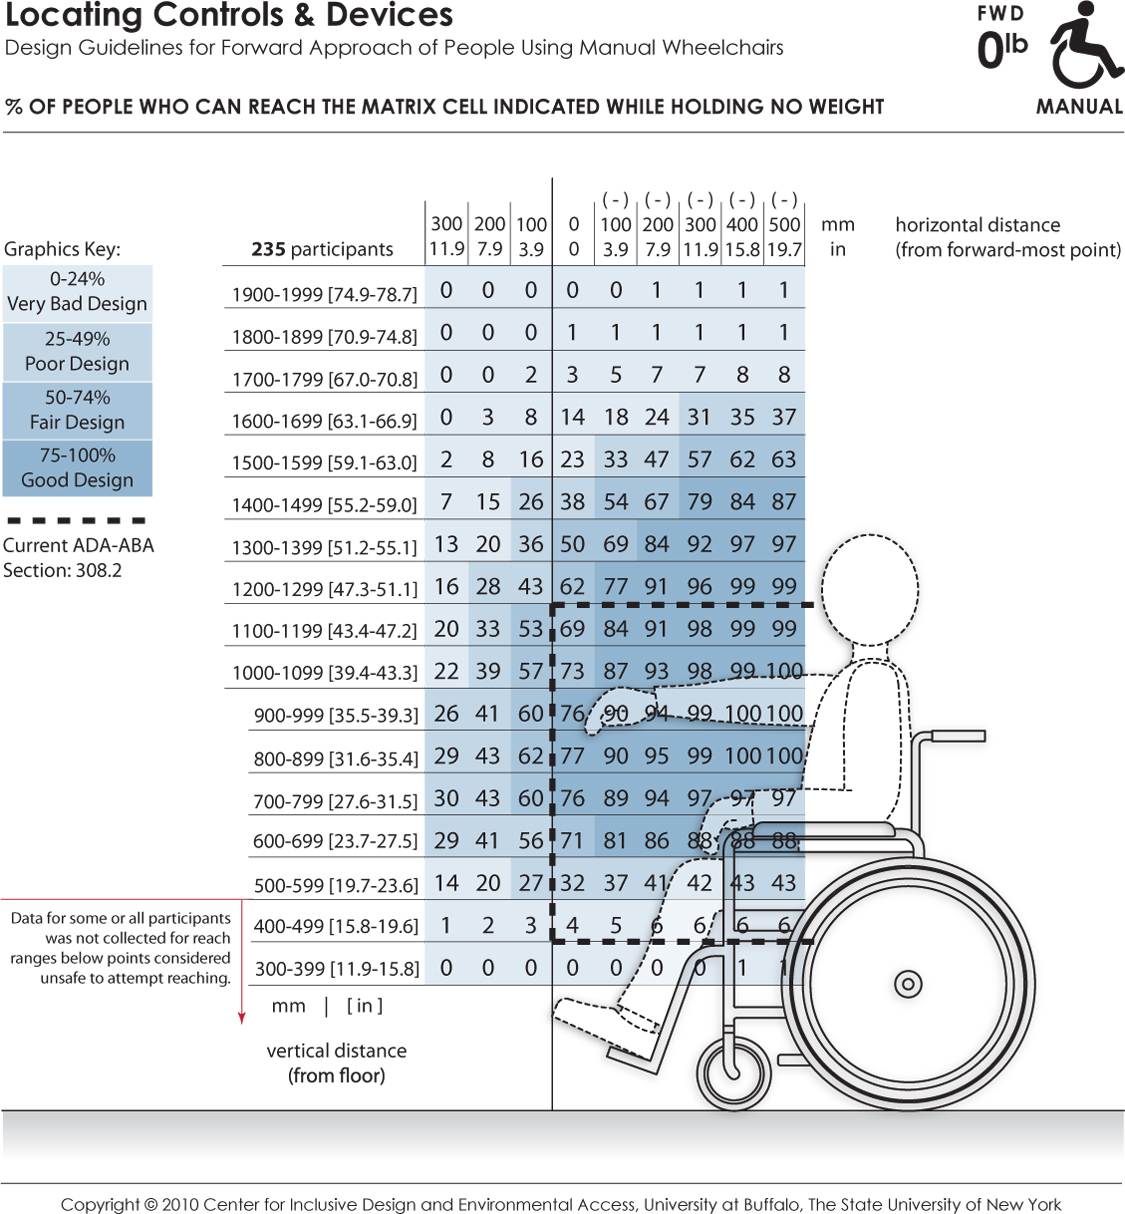
These data depict the reaching abilities of manual chair users represented as the percentage of users expected to reach to a target location in the forward reach direction for a given (a) height from the floor (shown the vertical axis) and (b) offset distance (shown on the horizontal axis) from the forward-most point of the person or wheelchair (e.g., toe, footrest). Horizontal distances in the positive range represent offset distance away from the body (or barrier depth) when reaching over an obstruction in relation to the forward-most point, and the negative range implying that the reach target is brought closer to the person (such as on a table with knee clearance). The percentages are color coded to differentiate regions in reach performance. The dashed lines indicate the current ADA-ABA requirement.
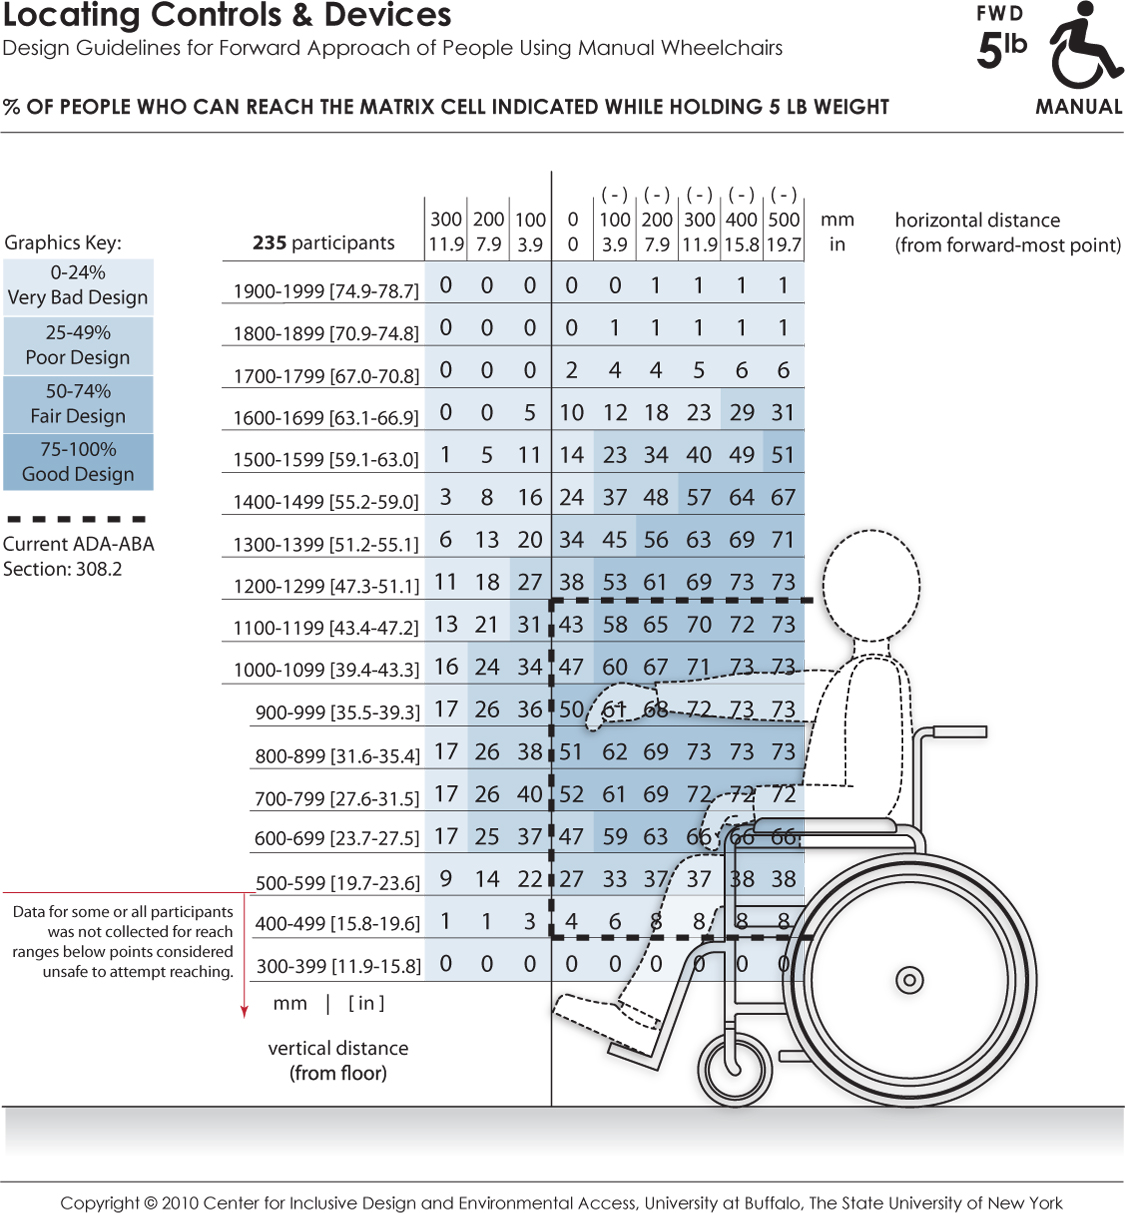
These data depict the reaching abilities of manual chair users represented as the percentage of users able to retrieve and place a 5 lb weight on a target shelf in the forward reach direction for a given (a) height from the floor (shown the vertical axis) and (b) offset distance (shown on the horizontal axis) from the forward-most point of the person or wheelchair (e.g., toe, footrest). Horizontal distances in the positive range represent offset distance away from the body (or barrier depth) when reaching over an obstruction in relation to the forward-most point, and the negative range implying that the reach target is brought closer to the person (such as on a table with knee clearance). The percentages are color coded to differentiate regions in reach performance. The dashed lines indicate the current ADA-ABA requirement.
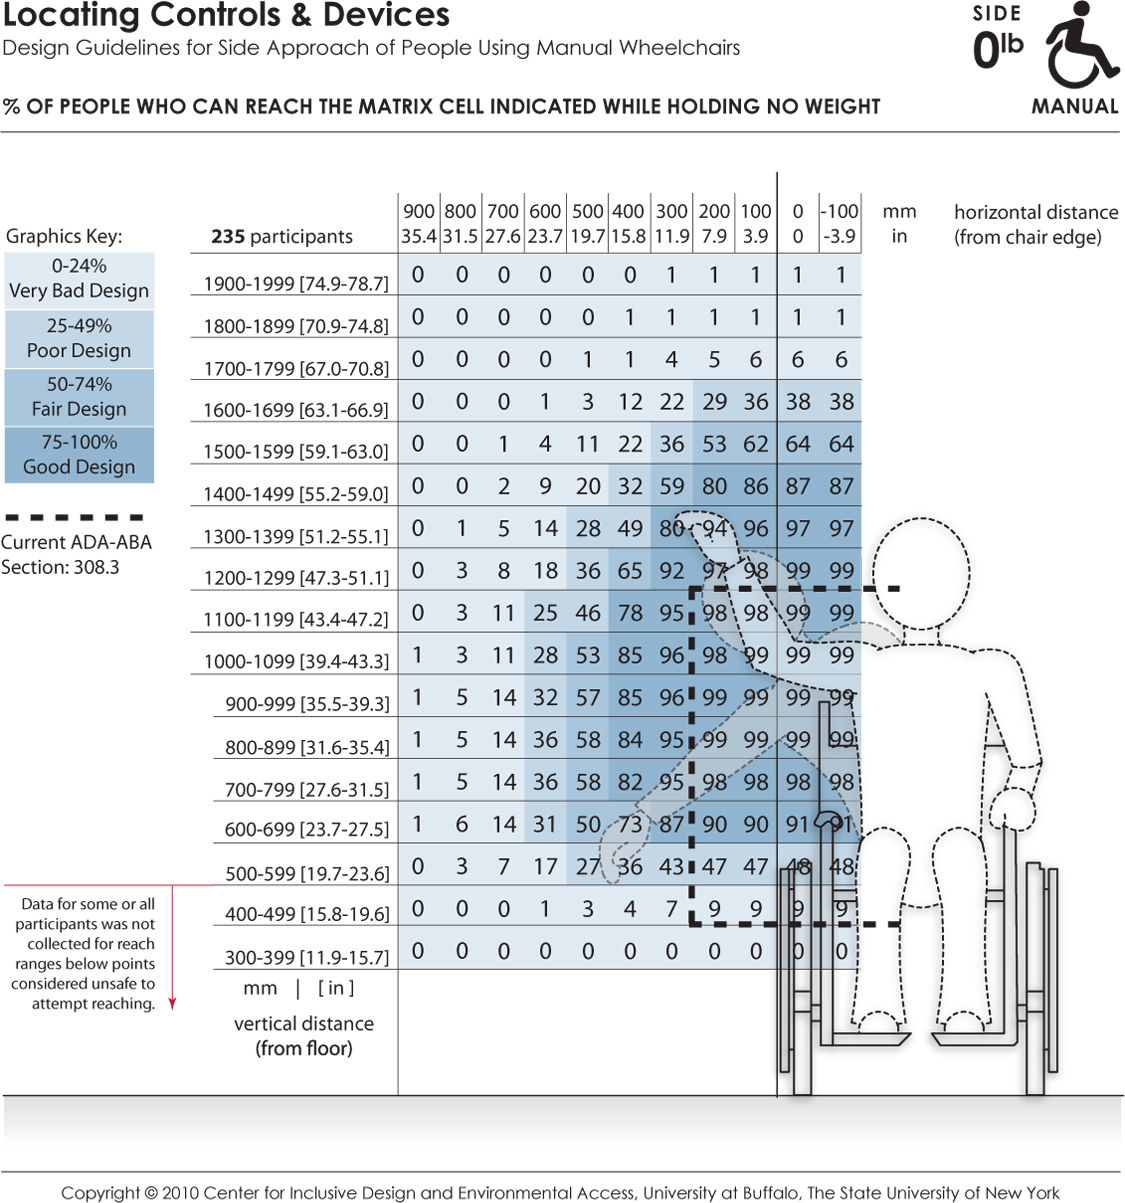
These data depict the reaching abilities of manual chair users represented as the percentage of users expected to reach to a target location in the lateral or sideways reach direction for a given (a) height from the floor (shown the vertical axis) and (b) offset distance (shown on the horizontal axis) from the lateral-most point of the person or wheelchair (e.g., elbow, armrest). Horizontal distances in the positive range represent offset distance away from the body (or barrier depth) in relation to the lateral-most point, and the negative range implying that the reach target is brought closer to the person. The dashed lines indicate the current ADA-ABA requirement.
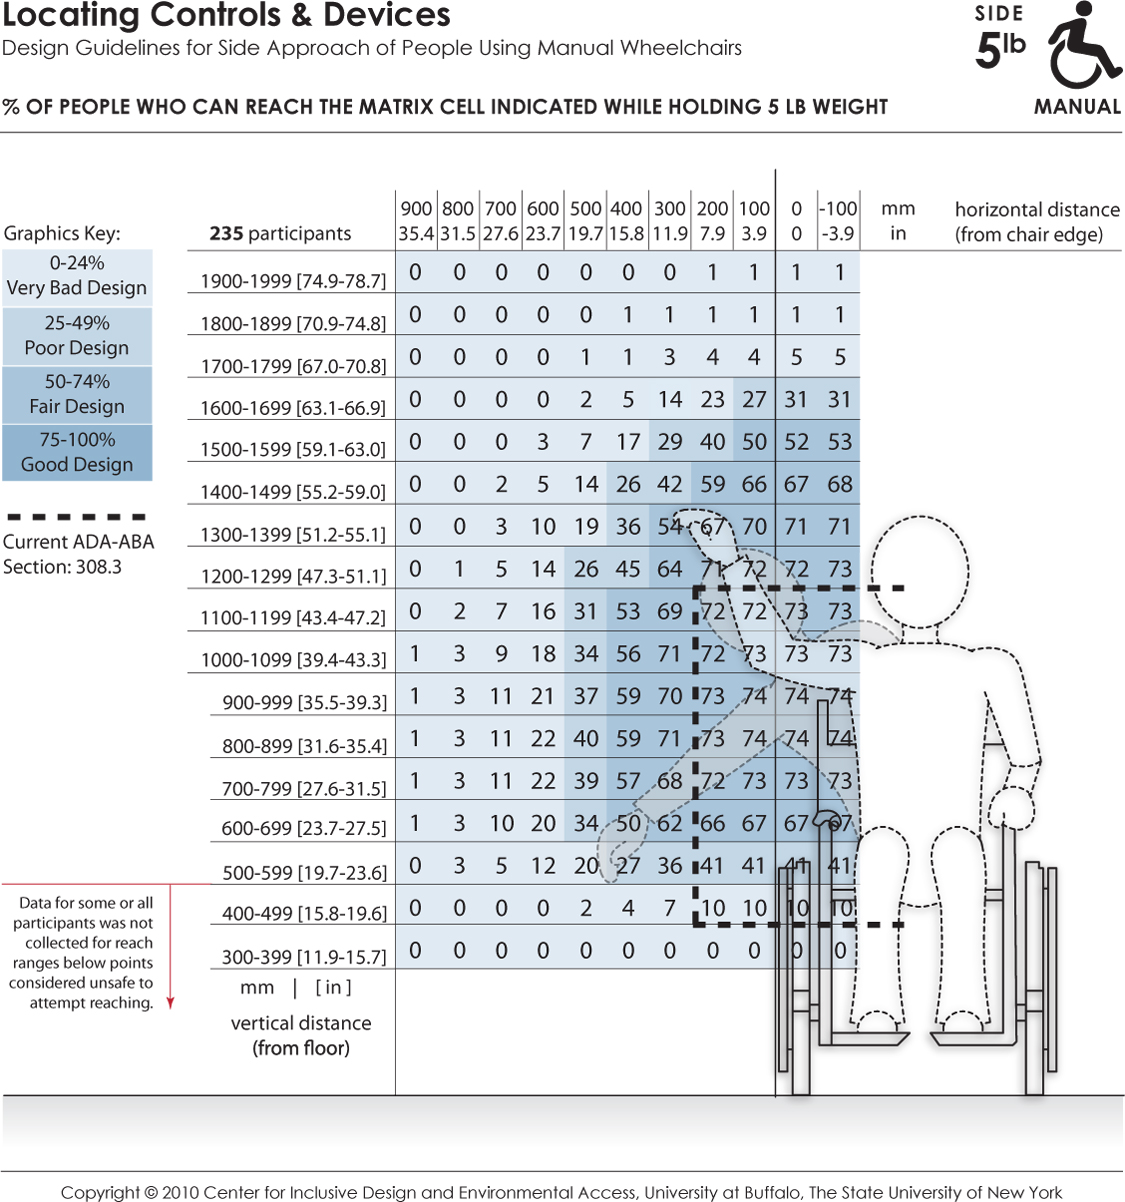
These data depict the reaching abilities of manual chair users represented as the percentage of users able to retrieve and place a 5 lb object on a target shelf in the lateral or sideways reach direction for a given (a) height from the floor (shown the vertical axis) and (b) offset distance (shown on the horizontal axis) from the lateral-most point of the person or wheelchair (e.g., elbow, armrest). Horizontal distances in the positive range represent offset distance away from the body (or barrier depth) in relation to the lateral-most point, and the negative range implying that the reach target is brought closer to the person. The dashed lines indicate the current ADA-ABA requirement.
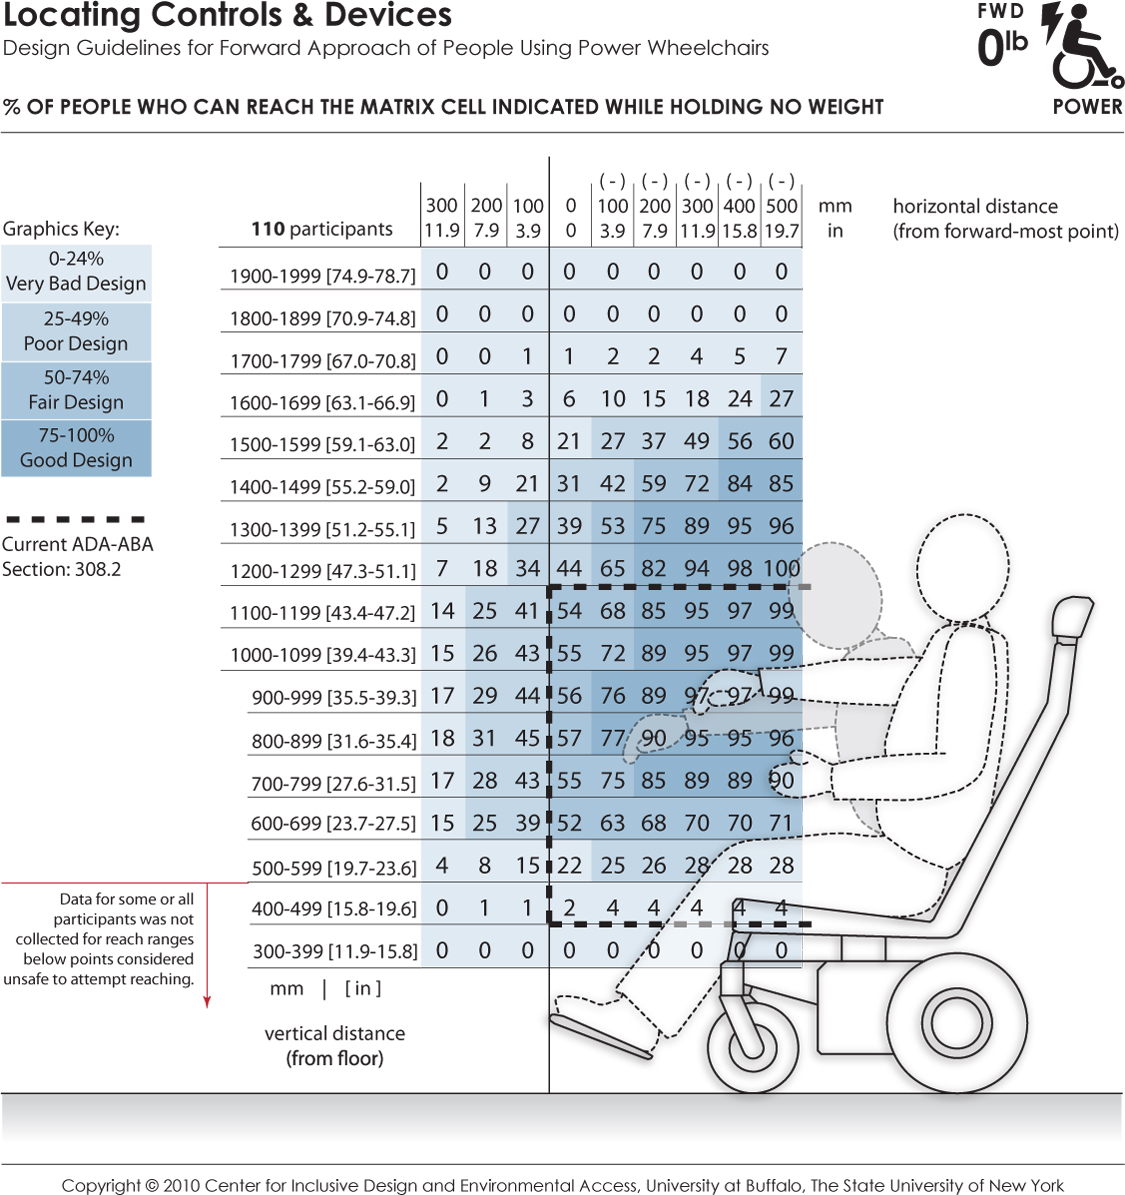
These data depict the reaching abilities of power chair users represented as the percentage of users expected to reach to a target location in the forward reach direction for a given (a) height from the floor (shown the vertical axis) and (b) offset distance (shown on the horizontal axis) from the forward-most point of the person or wheelchair (e.g., toe, footrest). Horizontal distances in the positive range represent offset distance away from the body (or barrier depth) when reaching over an obstruction in relation to the forward-most point, and the negative range implying that the reach target is brought closer to the person (such as on a table with knee clearance). The percentages are color coded to differentiate regions in reach performance. The dashed lines indicate the current ADA-ABA requirement.
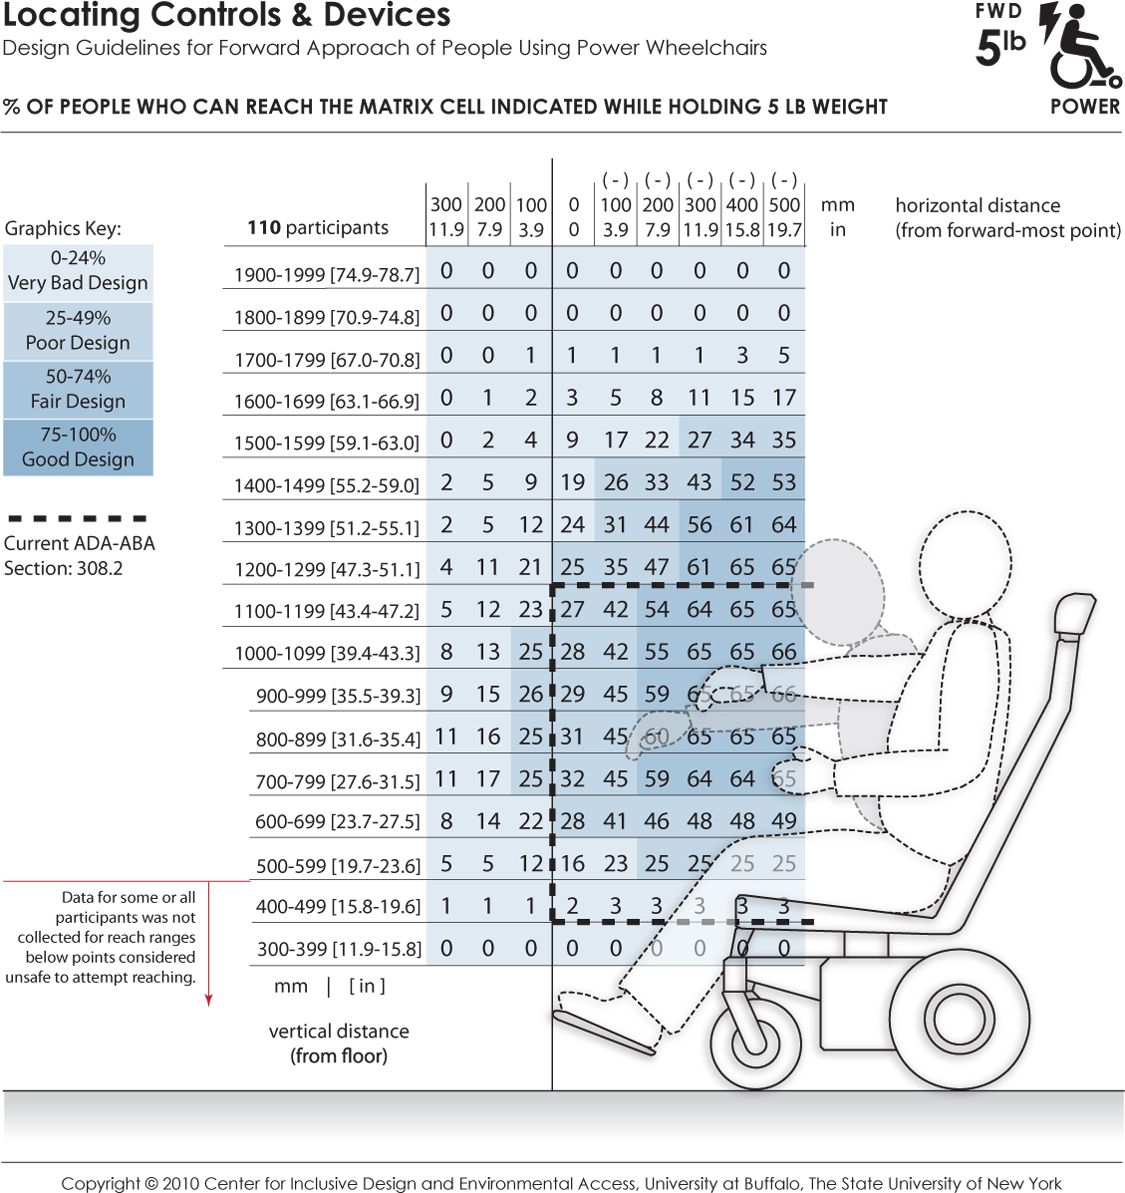
These data depict the reaching abilities of power chair users represented as the percentage of users able to retrieve and place a 5 lb weight on a target shelf in the forward reach direction for a given (a) height from the floor (shown the vertical axis) and (b) offset distance (shown on the horizontal axis) from the forward-most point of the person or wheelchair (e.g., toe, footrest). Horizontal distances in the positive range represent offset distance away from the body (or barrier depth) when reaching over an obstruction in relation to the forward-most point, and the negative range implying that the reach target is brought closer to the person (such as on a table with knee clearance). The percentages are color coded to differentiate regions in reach performance. The dashed lines indicate the current ADA-ABA requirement.
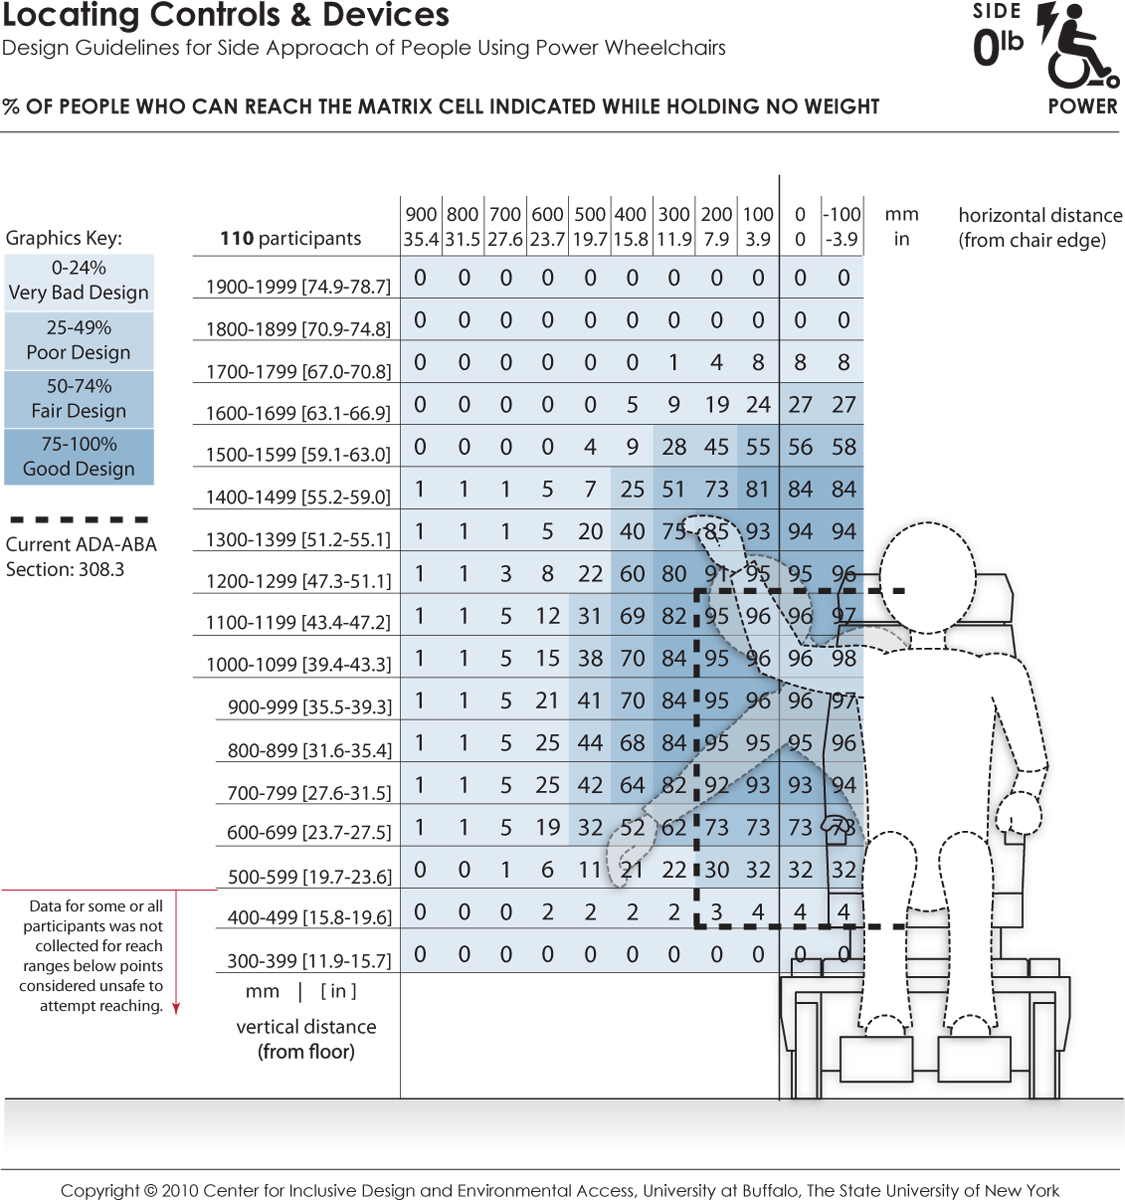
These data depict the reaching abilities of power chair users represented as the percentage of users expected to reach to a target location in the lateral or sideways reach direction for a given (a) height from the floor (shown the vertical axis) and (b) offset distance (shown on the horizontal axis) from the lateral-most point of the person or wheelchair (e.g., elbow, armrest). Horizontal distances in the positive range represent offset distance away from the body (or barrier depth) in relation to the lateral-most point, and the negative range implying that the reach target is brought closer to the person. The dashed lines indicate the current ADA-ABA requirement.
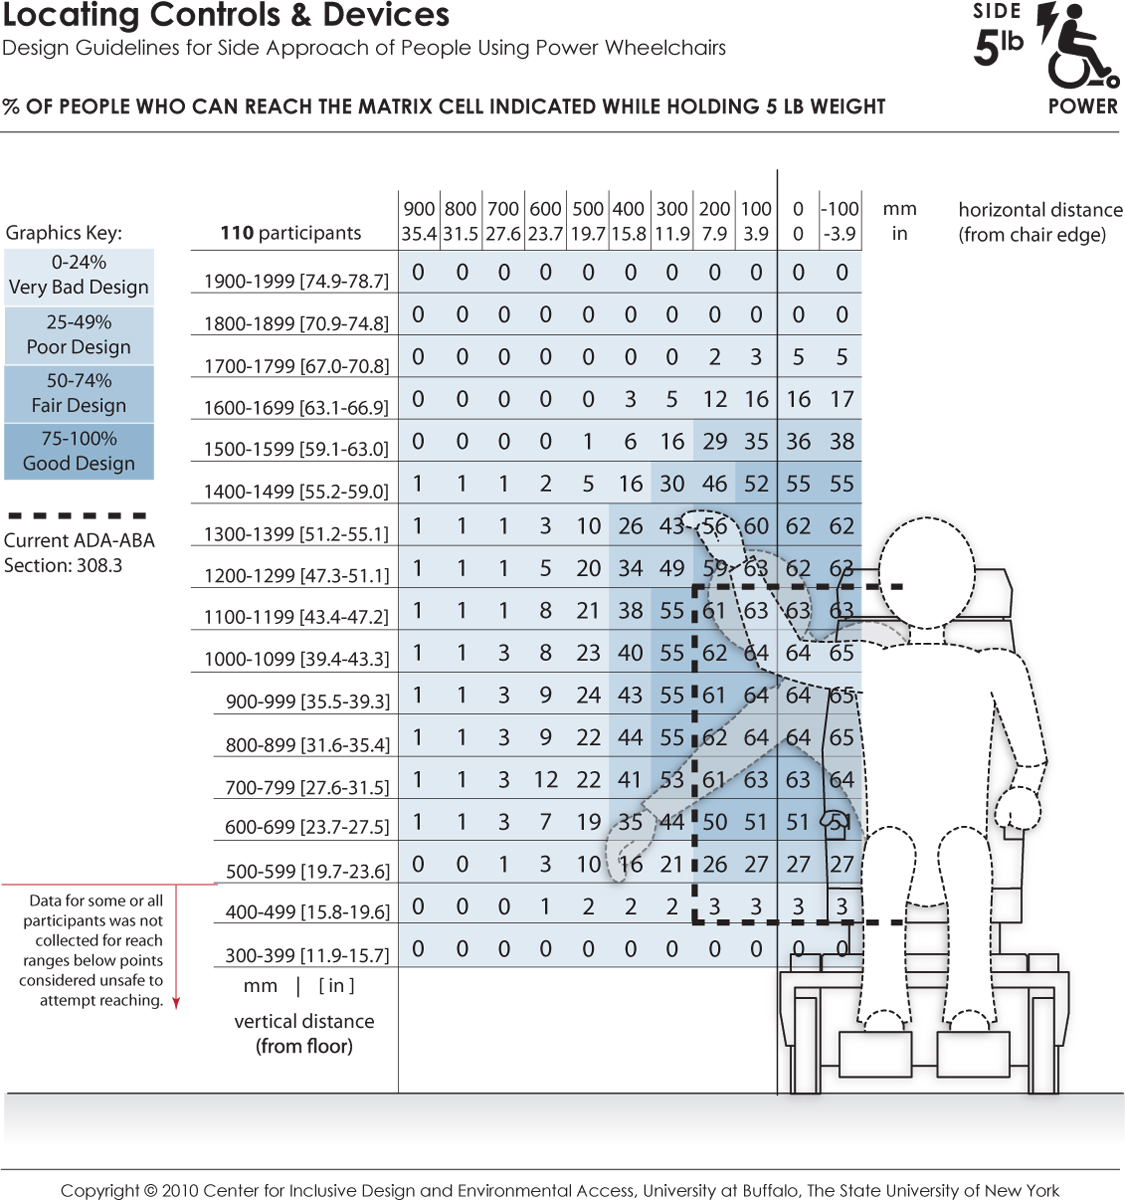
These data depict the reaching abilities of power chair users represented as the percentage of users able to retrieve and place a 5 lb object on a target shelf in the lateral or sideways reach direction for a given (a) height from the floor (shown the vertical axis) and (b) offset distance (shown on the horizontal axis) from the lateral-most point of the person or wheelchair (e.g., elbow, armrest). Horizontal distances in the positive range represent offset distance away from the body (or barrier depth) in relation to the lateral-most point, and the negative range implying that the reach target is brought closer to the person. The dashed lines indicate the current ADA-ABA requirement.
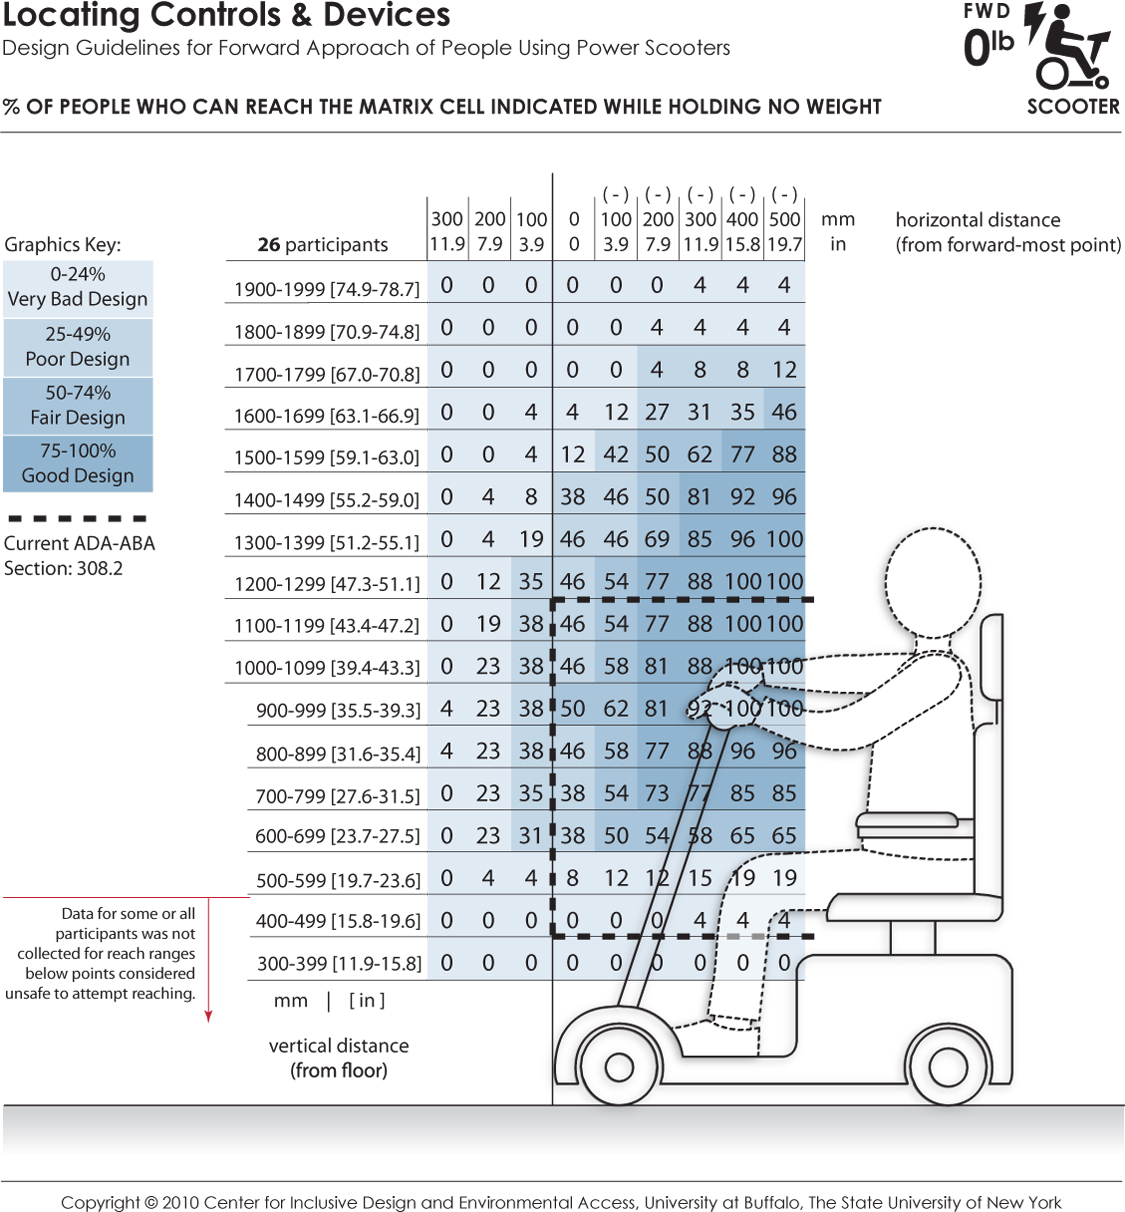
These data depict the reaching abilities of scooter users represented as the percentage of users expected to reach to a target location in the forward reach direction for a given (a) height from the floor (shown the vertical axis) and (b) offset distance (shown on the horizontal axis) from the forward-most point of the person or wheelchair (e.g., toe, footrest). Horizontal distances in the positive range represent offset distance away from the body (or barrier depth) when reaching over an obstruction in relation to the forward-most point, and the negative range implying that the reach target is brought closer to the person (such as on a table with knee clearance). The percentages are color coded to differentiate regions in reach performance. The dashed lines indicate the current ADA-ABA requirement.
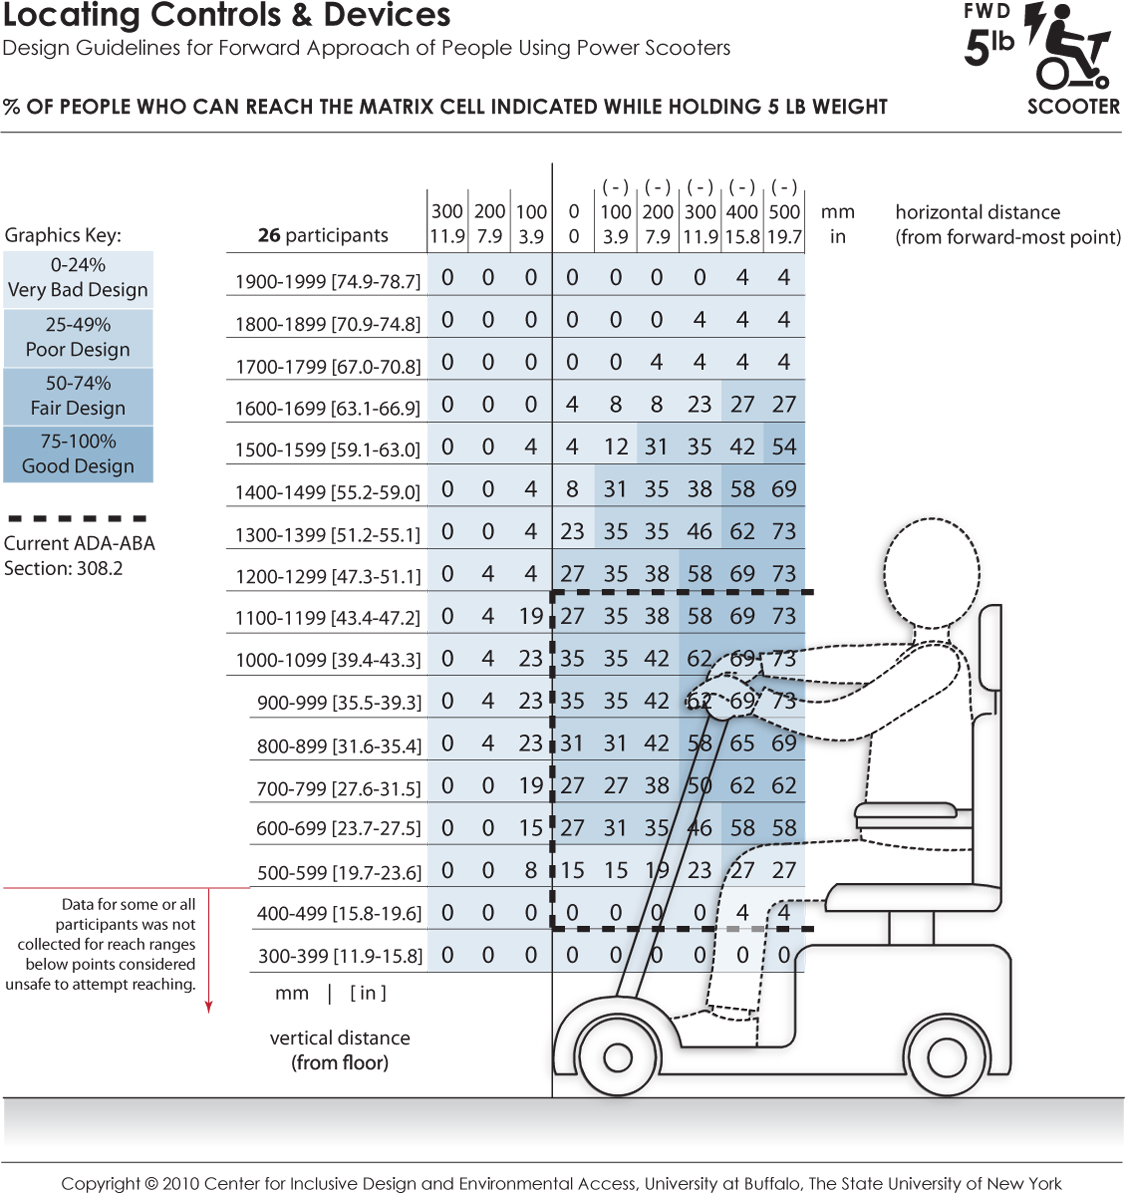
These data depict the reaching abilities of scooter users represented as the percentage of users able to retrieve and place a 5 lb weight on a target shelf in the forward reach direction for a given (a) height from the floor (shown the vertical axis) and (b) offset distance (shown on the horizontal axis) from the forward-most point of the person or wheelchair (e.g., toe, footrest). Horizontal distances in the positive range represent offset distance away from the body (or barrier depth) when reaching over an obstruction in relation to the forward-most point, and the negative range implying that the reach target is brought closer to the person (such as on a table with knee clearance). The percentages are color coded to differentiate regions in reach performance. The dashed lines indicate the current ADA-ABA requirement.
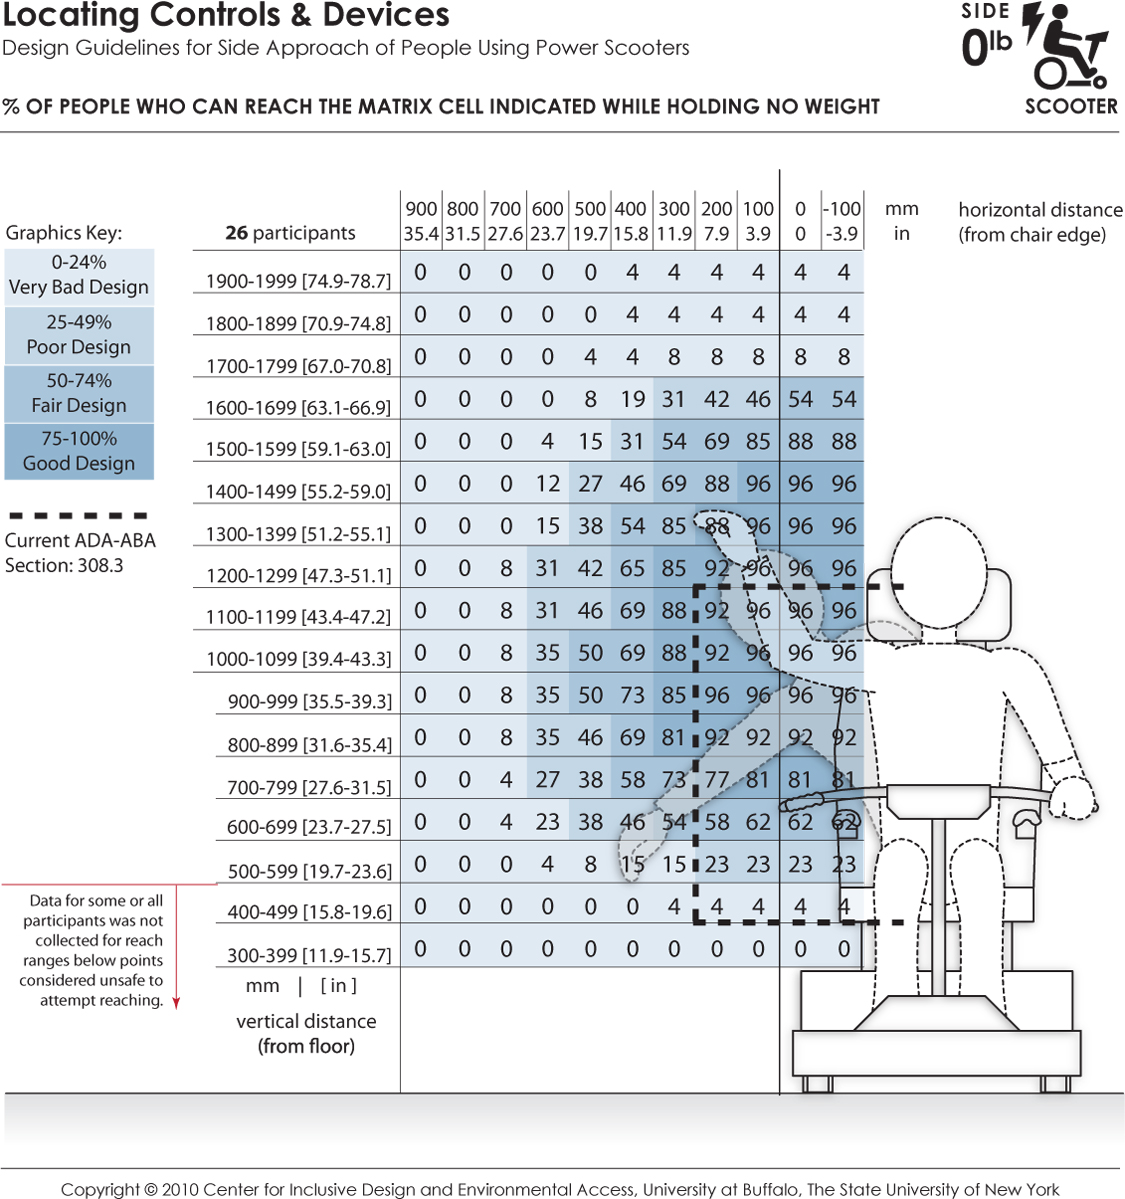
These data depict the reaching abilities of scooter users represented as the percentage of users expected to reach to a target location in the lateral or sideways reach direction for a given (a) height from the floor (shown the vertical axis) and (b) offset distance (shown on the horizontal axis) from the lateral-most point of the person or wheelchair (e.g., elbow, armrest). Horizontal distances in the positive range represent offset distance away from the body (or barrier depth) in relation to the lateral-most point, and the negative range implying that the reach target is brought closer to the person. The dashed lines indicate the current ADA-ABA requirement.
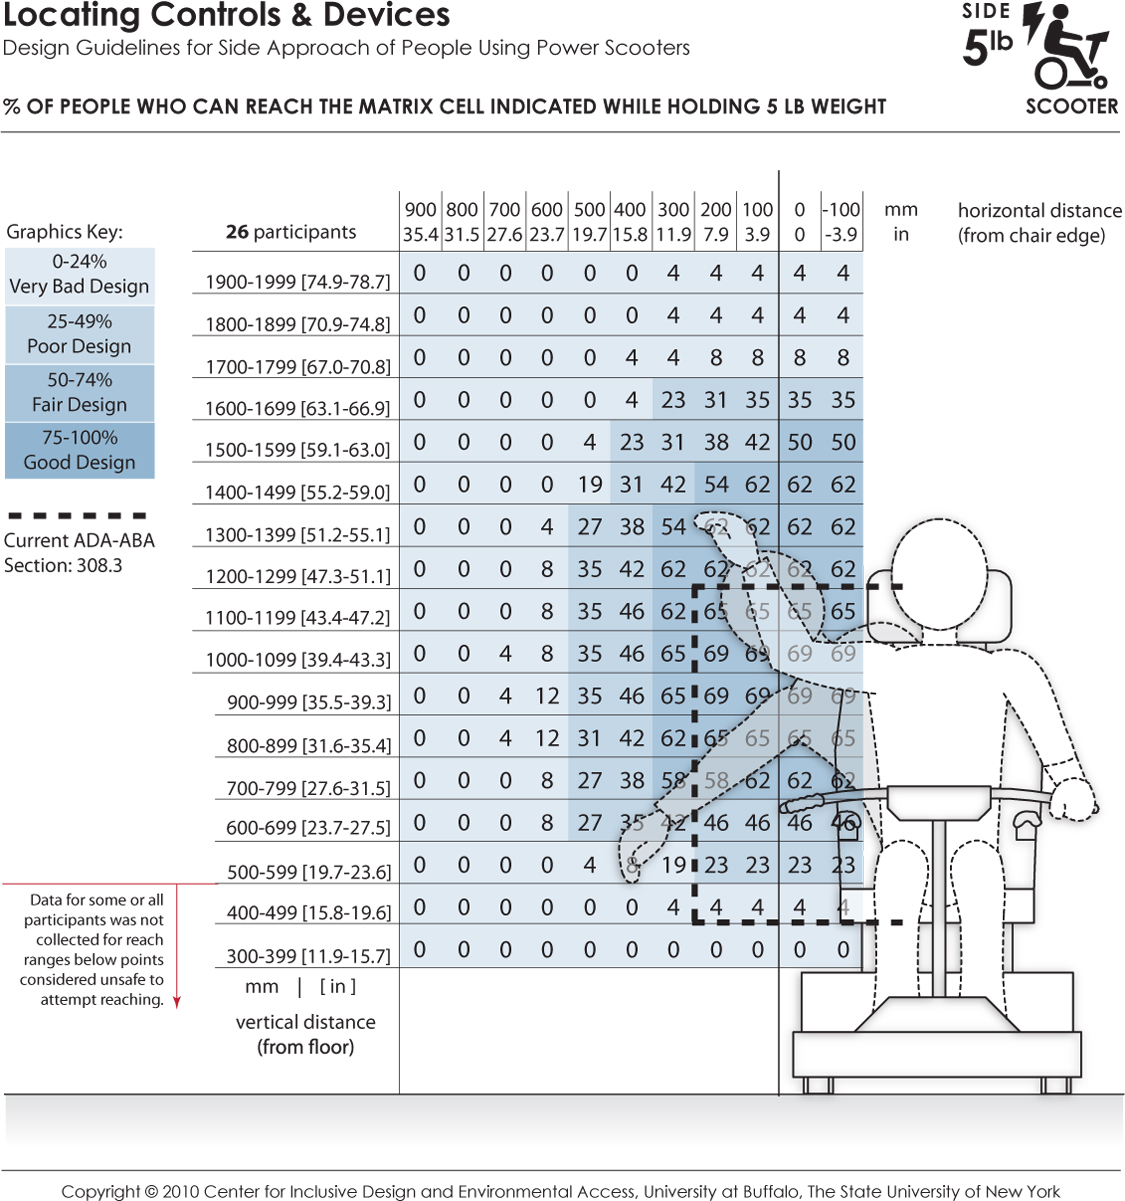
These data depict the reaching abilities of scooter users represented as the percentage of users able to retrieve and place a 5 lb object on a target shelf in the lateral or sideways reach direction for a given (a) height from the floor (shown the vertical axis) and (b) offset distance (shown on the horizontal axis) from the lateral-most point of the person or wheelchair (e.g., elbow, armrest). Horizontal distances in the positive range represent offset distance away from the body (or barrier depth) in relation to the lateral-most point, and the negative range implying that the reach target is brought closer to the person. The dashed lines indicate the current ADA-ABA requirement.
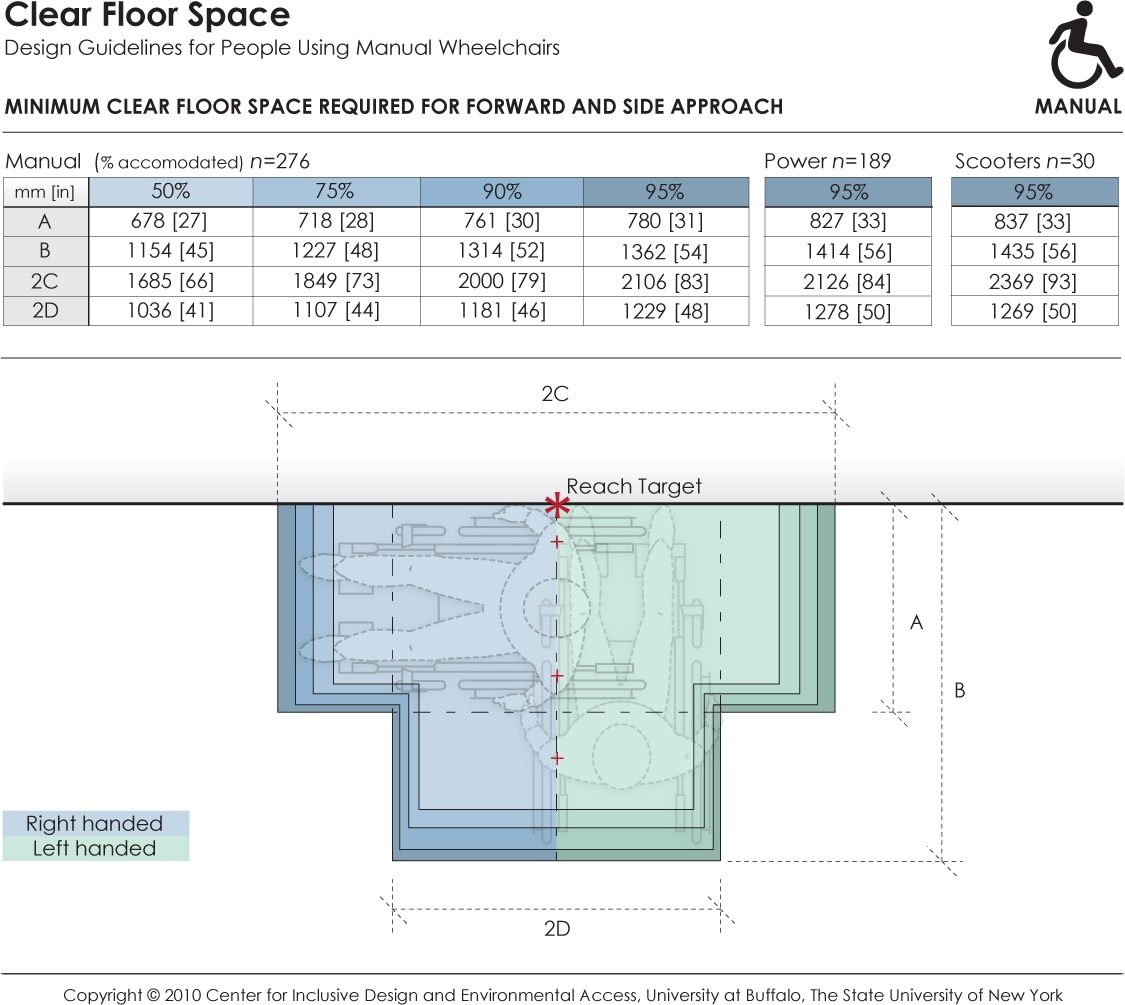
This data depicts the amount of clear floor area required by persons using wheeled mobility devices when performing a forward or side reach to a target location (e.g., reaching to a light switch on the wall) with either the right or left hand. The accompanying table provides dimensions values for clear floor area to accommodate 95% of manual chair (n=276), power chair (n=189), and scooter (n=30) users that were measured as part of the Anthropometry of Wheeled Mobility study. The dimensions of clear floor area are based on four anthropometry dimensions. These dimensions are: (A) occupied width, the horizontal distance between the side-most (lateral-most) points of the wheelchair or occupant on the right and left side; (B) occupied length, the horizontal distance from the front-most (anterior-most) point of the wheelchair or occupant to the rear-most (posterior-most) point of the wheelchair or occupant; (C)the horizontal distance from the reaching shoulder to the front-most (anterior-most) point of the wheelchair or occupant; (D) the horizontal distance from the reaching shoulder to the side-most (lateral-most) point on the opposite (contra-lateral) side of the wheelchair or occupant.
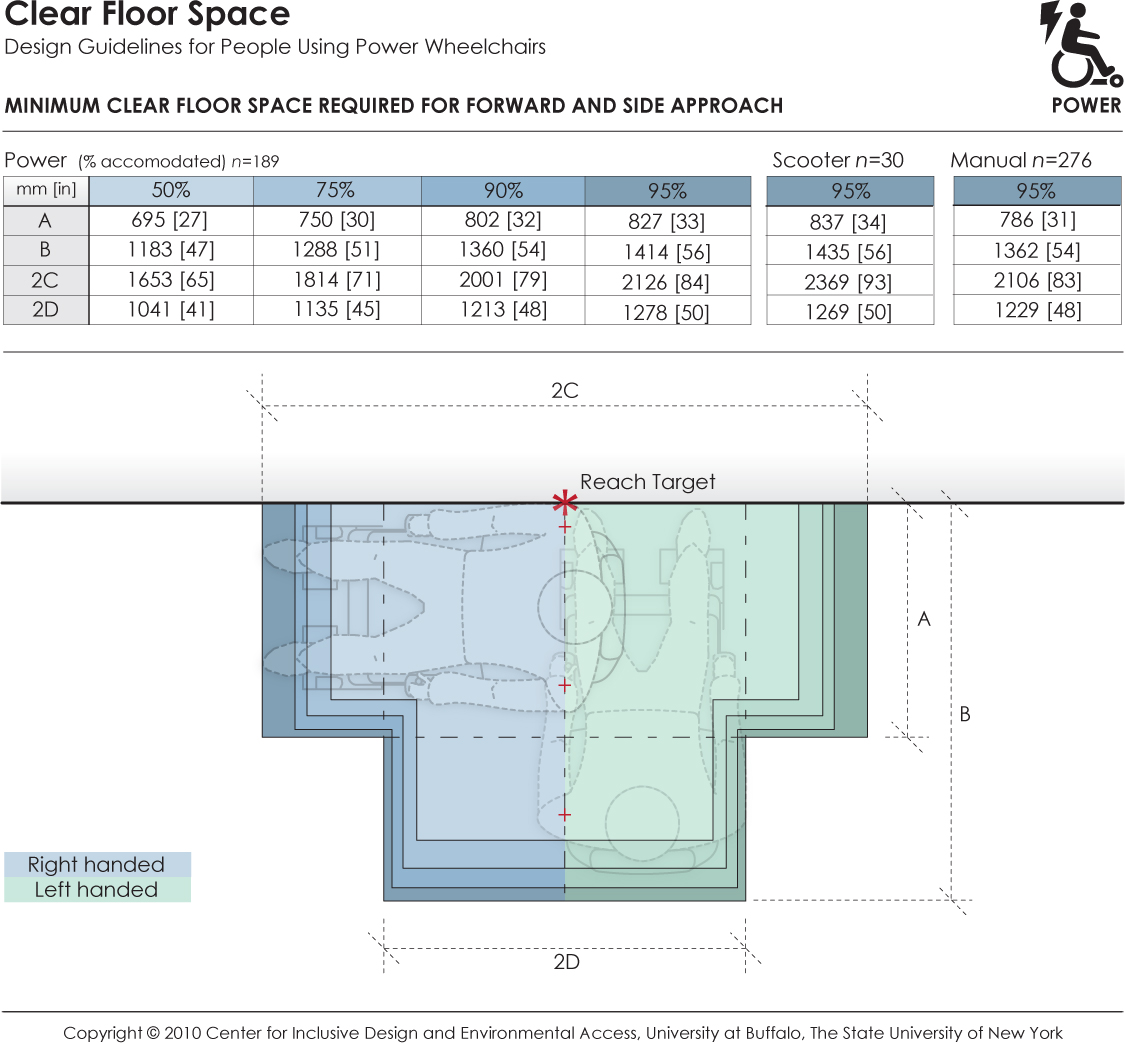
This data depicts the amount of clear floor area required by persons using wheeled mobility devices when performing a forward or side reach to a target location (e.g., reaching to a light switch on the wall) with either the right or left hand. The accompanying table provides dimensions values for clear floor area to accommodate 95% of power chair (n=189), scooter (n=30), and manual chair (n=276), users that were measured as part of the Anthropometry of Wheeled Mobility study. The dimensions of clear floor area are based on four anthropometry dimensions. These dimensions are: (A) occupied width, the horizontal distance between the side-most (lateral-most) points of the wheelchair or occupant on the right and left side; (B) occupied length, the horizontal distance from the front-most (anterior-most) point of the wheelchair or occupant to the rear-most (posterior-most) point of the wheelchair or occupant; (C)the horizontal distance from the reaching shoulder to the front-most (anterior-most) point of the wheelchair or occupant; (D) the horizontal distance from the reaching shoulder to the side-most (lateral-most) point on the opposite (contra-lateral) side of the wheelchair or occupant.
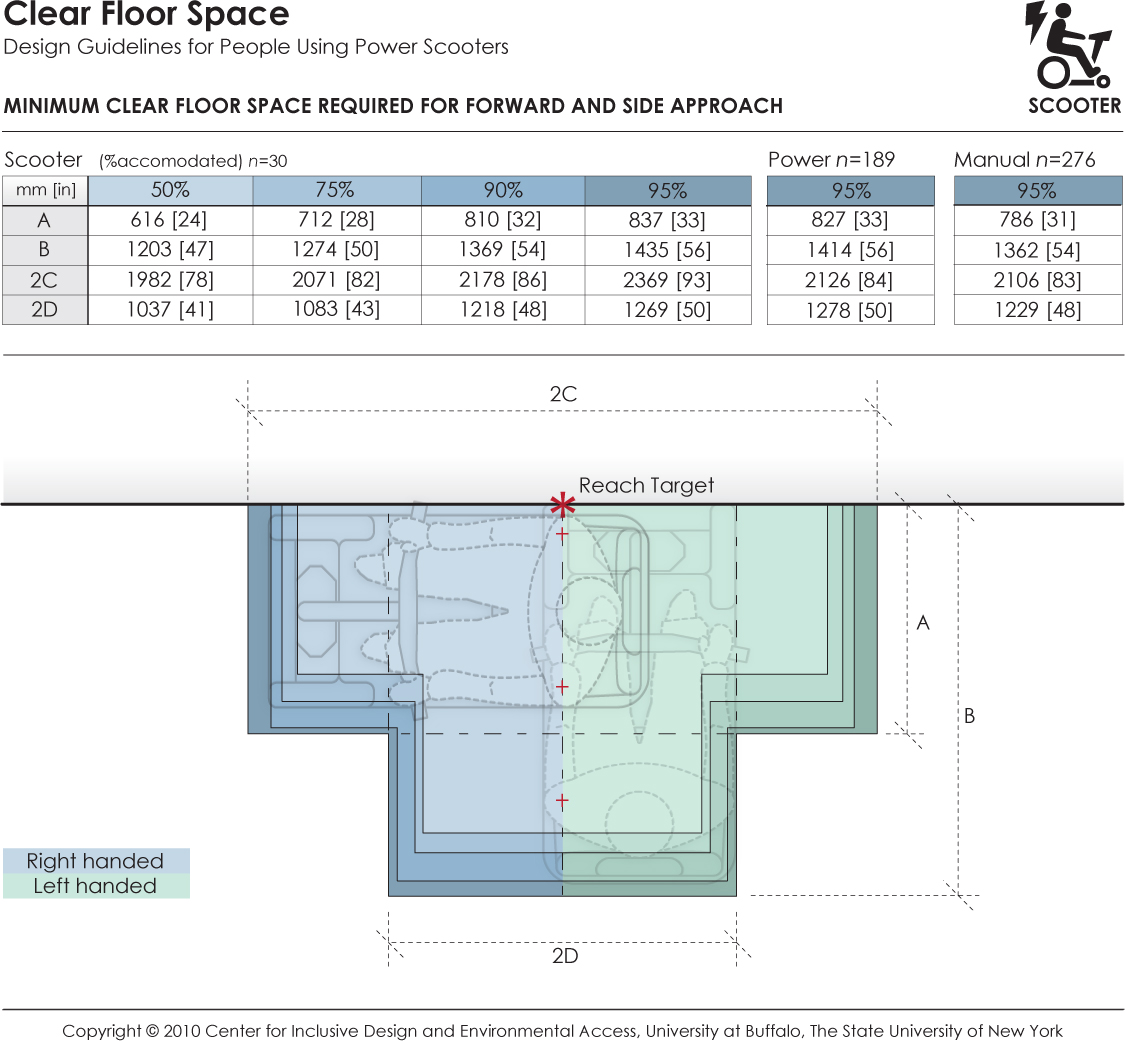
This data depicts the amount of clear floor area required by persons using wheeled mobility devices when performing a forward or side reach to a target location (e.g., reaching to a light switch on the wall) with either the right or left hand. The accompanying table provides dimensions values for clear floor area to accommodate 95% of scooter (n=30), power chair (n=189), and manual chair (n=276) users that were measured as part of the Anthropometry of Wheeled Mobility study. The dimensions of clear floor area are based on four anthropometry dimensions. These dimensions are: (A) occupied width, the horizontal distance between the side-most (lateral-most) points of the wheelchair or occupant on the right and left side; (B) occupied length, the horizontal distance from the front-most (anterior-most) point of the wheelchair or occupant to the rear-most (posterior-most) point of the wheelchair or occupant; (C)the horizontal distance from the reaching shoulder to the front-most (anterior-most) point of the wheelchair or occupant; (D) the horizontal distance from the reaching shoulder to the side-most (lateral-most) point on the opposite (contra-lateral) side of the wheelchair or occupant.
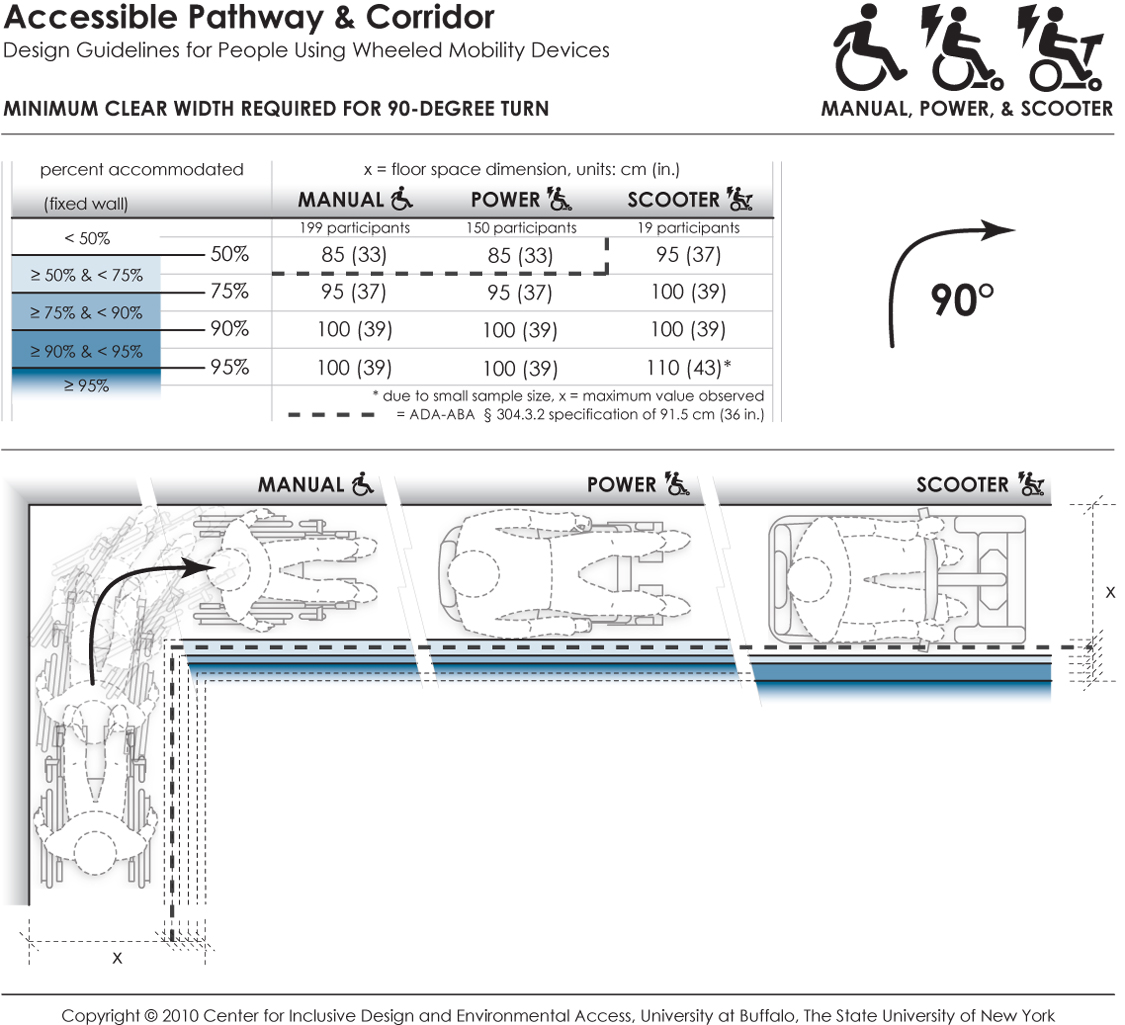
This data depicts the amount of space required by users of wheeled mobility devices to perform a 90-degree turn ("L-Turn"). The bold dashed line in the table and figure indicates the current ADA-ABA requirement of a 91.5 cm (36 in.) passage width. Findings from the Anthropometry of Wheeled Mobility Study indicate that a width of at least 85 cm (33 in.) was required for 50% of the manual and power wheelchair users measured in this study to perform a 90-degree turn. A width of 100 cm (39 in.) was required in order for 95% of manual wheelchair and power chair users to complete the turn, with 95% of scooter users needing a width of at least 110 cm (43 in.) These data are based on measurements of wheeled mobility users performing 90-degree turns in a hallway, built with mock walls. The outside wall of the hallway was fixed. The other side of each leg had moveable walls. The enclosed space was incrementally increased until a user could pass through the turn successfully. The minimum space required to perform a complete 90-degree turn within moving or knocking down any of the walls was recorded. Use of multiple short turns was allowed in contrast to a single continuous turn.
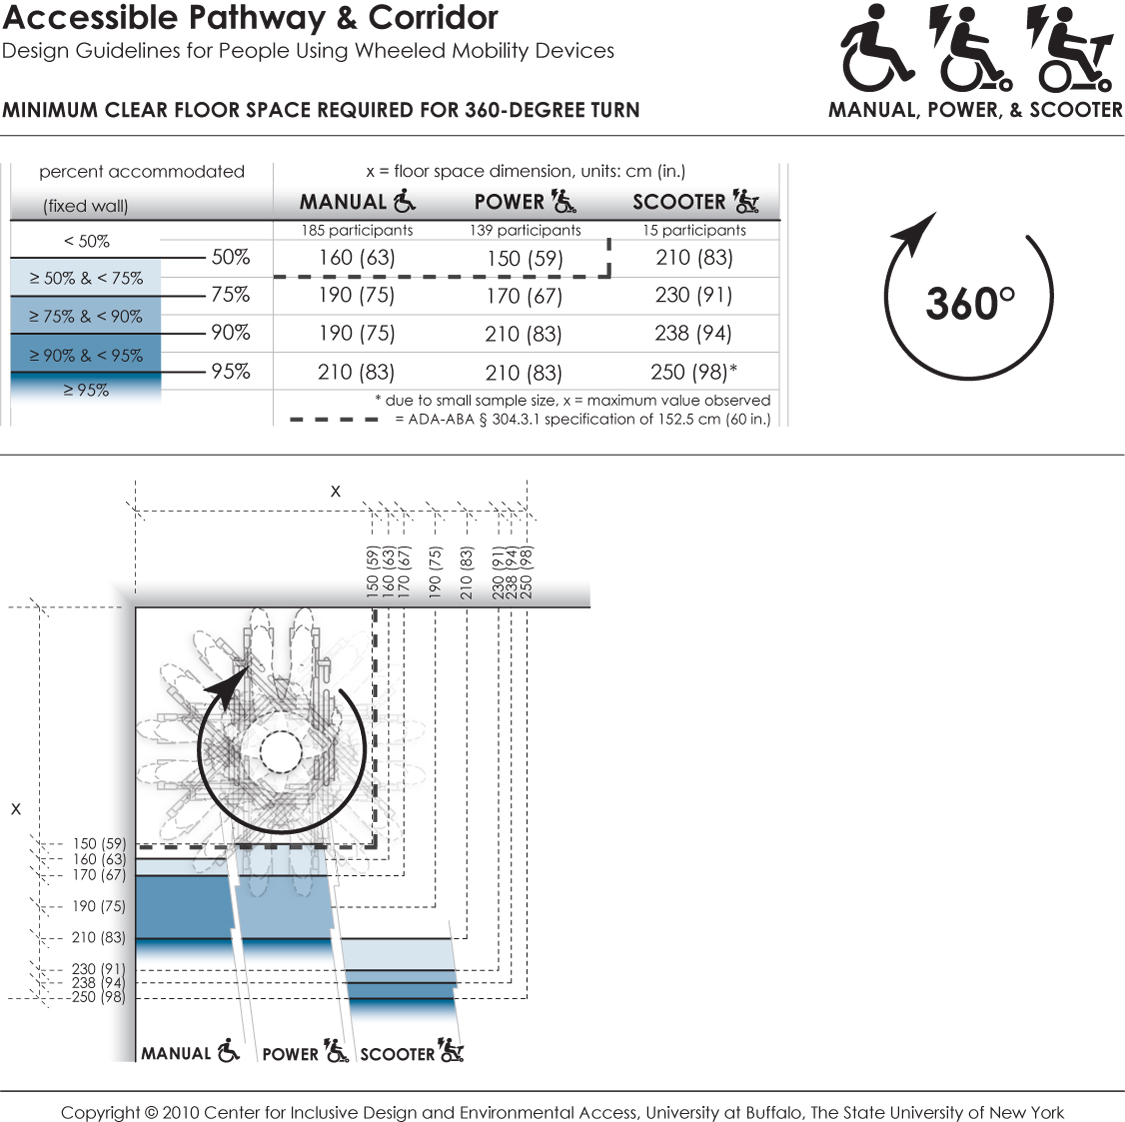
This data depicts the amount of space required by users of wheeled mobility devices to perform a 360-degree turn. The bold dashed line in the table and figure indicates the current ADA-ABA requirement of a 152.5 cm (60 in.) turn space. Findings from the Anthropometry of Wheeled Mobility Study indicate that a square space of at least 160 x 160 cm (63 in.) was required for 50% of the manual wheelchair users measured in this study to perform a 360-degree turn. A space of 210 x 210 cm (83 in.) was required in order for 95% of manual wheelchair and power chair users to complete the turn, with 95% of scooter users needing a space of at least 250 x 250 cm (98 in.) These data are based on measurements of wheeled mobility users performing 360-degree turns within an enclosed square space built with mock walls. The enclosed space was incrementally varied from a size of 130 x 130 cm (51 in.) to 250 x 250 cm (98 in.) The minimum space required to perform a complete 360-degree turn within moving or knocking down any of the walls was recorded. Use of multiple short turns was allowed in contrast to a single continuous turn.
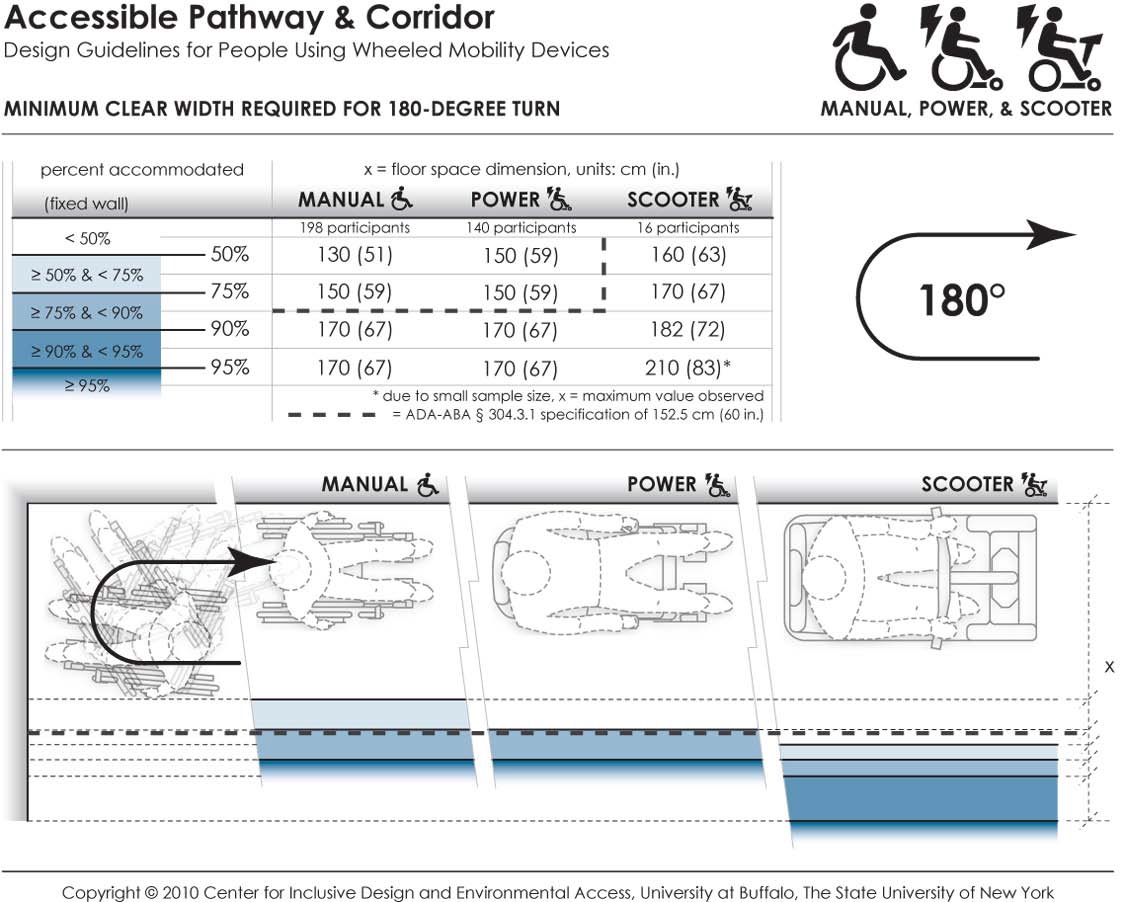
This data depicts the amount of space required by users of wheeled mobility devices to perform a 180-degree turn. The bold dashed line in the table and figure indicates the current ADA-ABA requirement of a 152.5 cm (60 in.) space for wheeled mobility users to turn around. Findings from the Anthropometry of Wheeled Mobility Study indicate that a width of at least 130 cm (51 in.) was required for 50% of the manual wheelchair users measured in this study to perform a 90-degree turn. A width of 170 cm (67 in.) was required in order for 95% of manual wheelchair and power chair users to complete the turn, with 95% of scooter users needing a width of at least 210 cm (83 in.) These data are based on measurements of wheeled mobility users performing 180-degree turns in a dead-end hallway, built with mock walls. The end wall and a second wall of the hallway was fixed. The other side of the hallway had a moveable wall. The hallway width was incrementally increased until a user could enter the space, turn around, and exit the space successfully. The minimum space required to perform a complete 180-degree turn within moving or knocking down any of the walls was recorded. Use of multiple short turns was allowed in contrast to a single continuous turn.
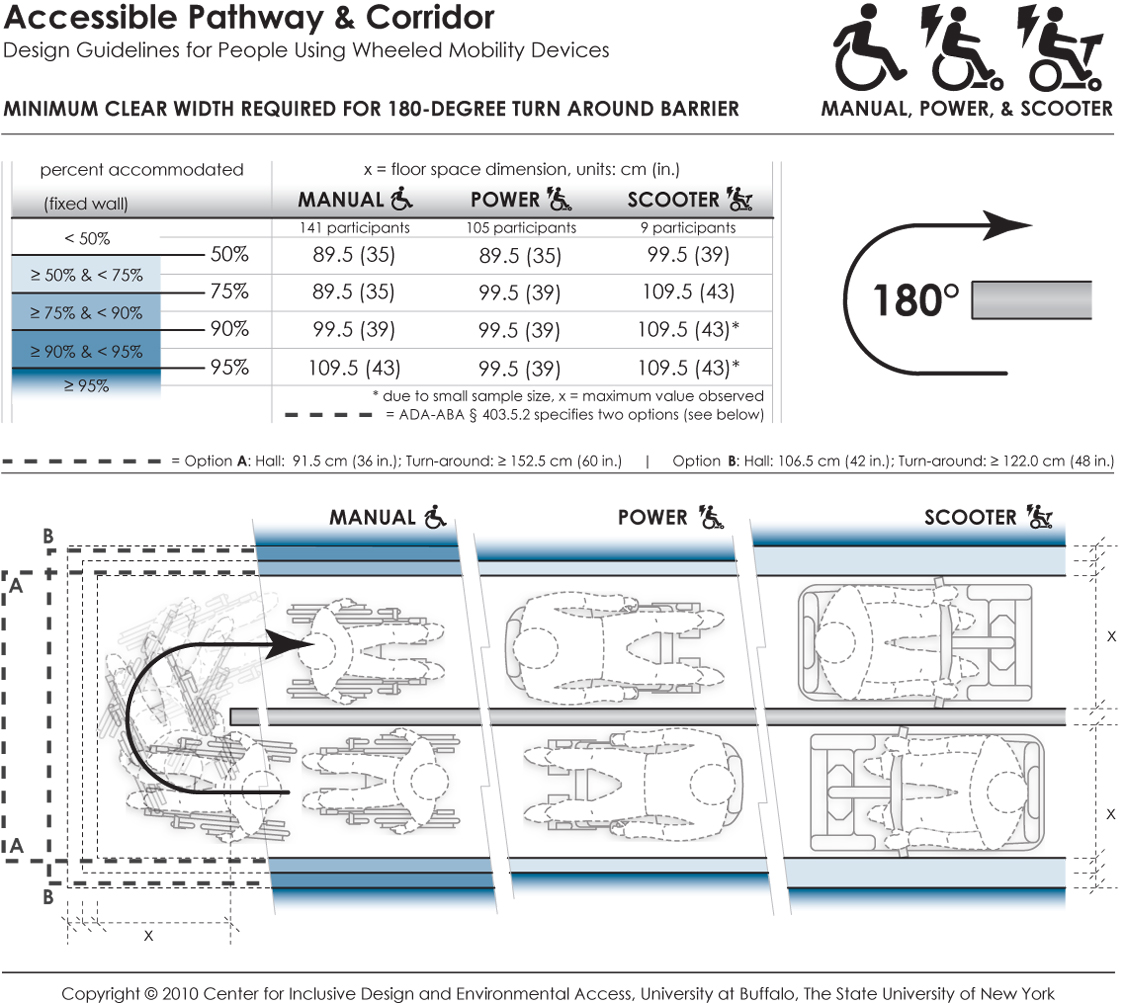
This data depicts the amount of space required by users of wheeled mobility devices to perform a 180-degree turn ("U-Turn") around an obstruction. The bold dashed line in the table and figure indicates the current ADA-ABA requirements, which vary based on the passage width and space available at the base of the turn. Findings from the Anthropometry of Wheeled Mobility Study indicate that a uniform width of at least 89.5 cm (35 in.) was required for 50% of the manual and power wheelchair users measured in this study to perform a 180-degree turn around the obstruction. A width of 109.5 cm (43 in.) was required in order to accommodate 95% of all users. These data are based on measurements of wheeled mobility users performing 180-degree turns around an obstruction, built with mock walls. An obstruction of 11 cm (4 in.) was fixed at a central location. Three moveable walls were constructed around the central fixed wall to form a U-shaped hallway of equal passage width. The enclosed space was incrementally and uniformly increased until a user could pass through the U-turn successfully. The minimum space required to perform a complete 180-degree turn around an obstruction within moving or knocking down any of the walls was recorded. Use of multiple short turns was allowed in contrast to a single continuous turn.
Bibliography
Peer-reviewed Journal Publications
D'Souza, C., Steinfeld, E., Paquet, V., and Feathers, D. (2010). Space Requirements for Wheeled Mobility Devices in Public Transportation: Analysis of Clear Floor Space Requirements. Transportation Research Record: Journal of the Transportation Research Board, No. 2145: 66‒71.
D'Souza, C., Paquet, V., Joseph, C., and Feathers, D. (in review). Hand size and functional grip capabilities of wheeled mobility device users. Applied Ergonomics.
Feathers, D., Paquet, V., and Drury, C. (2004). Measurement consistency and three-dimensional electromechanical anthropometry. International Journal of Industrial Ergonomics Special Issue on Anthropometry and Disability 33(3): 181‒190.
Feathers, D. (2005). Digital human modeling and measurement considerations for wheeled mobility device users. SAE 2004 Transactions, Journal of Aerospace, Vol. 113‒1. SAE International.
Koontz, A., M., Brindle, E. D., Kankipati, P., Feathers, D., and Cooper, R. A. (2010). Design features that affect the maneuverability of wheelchairs and scooters. Arch Phys Med Rehabil 91: 759‒764.
Paquet, V., and Feathers, D. (2004). An anthropometric study of manual and powered wheelchair users. International Journal of Industrial Ergonomics Special Issue on Anthropometry and Disability 33(3): 191 - 204.
Paquet, V., Joseph, C., and D’Souza, C. (In preparation). Use of computerized re-sampling to combine data from multiple samples for population-based anthropometric analysis.
Steinfeld, E. (2004). Modeling spatial interaction in anthropometric research. International Journal of Industrial Ergonomics 3(265‒278).
Steinfeld, E., Maisel, J., Feathers, D., and D'Souza, C. (2010). Anthropometry and standards for wheeled mobility: An international comparison. Assistive Technology 22(1): 51‒67.
Guest Edited Journal Special Issues
Paquet, V., Eds. (2004). Special Issue on Anthropometry and Disability. International Journal of Industrial Ergonomics ,33(6).
Paquet, V., and Steinfeld, E., Eds. (2010). Special Issue on Space Requirements for Wheeled Mobility. Assistive Technology, 22(1).
Peer-reviewed Conference Proceedings
D'Souza, C., Feathers, D., and Paquet, V. (2007). Constructing Three-Dimensional Models of Individuals and Their Wheeled Mobility Devices from Landmark Data. Technical Paper 2007‒01‒2494. 2007 Digital Human Modeling Conference, Seattle, WA, SAE Inc.
D'Souza, C., Paquet, V., Steinfeld, E., and Feathers, D. (2010a). Anthropometric Data Visualization Tools to Improve Accessibility of Built Environments. 3rd International Conference on Applied Human Factors and Ergonomics, 2010 AHFE International, Miami, Florida, Taylor and Francis, Ltd.
D'Souza, C., Steinfeld, E., Paquet, V., and Feathers, D. (2010b). Space requirements for wheeled mobility devices in public transportation: An analysis of clear floor space requirements. 89th Annual Meeting of the Transportation Research Board, Washington, DC.
D’Souza, C., Steinfeld, E., and Paquet, V. (2009a). Functional reach abilities of wheeled mobility device users: toward inclusive design. 2009 International conference on Inclusive Design, INCLUDE 2009, London, UK.
D’Souza, C., Steinfeld, E., and Paquet, V. (2009b). Functional reach for wheeled mobility device users: A comparison with ADA-ABA guidelines for accessibility. Rehabilitation Engineering Society of North America (RESNA) Annual Conference 2009, New Orleans, June 2009.
Drury, C., Koontz, A., Feathers, D., Kankipati, P., Paquet, V., and Lin, J.-F. (2009). Controllability of manual and powered wheelchairs for spinal cord injury users. Proceedings of the 52nd Annual Meeting of the Human Factors and Ergonomics Society, September 22‒26, 2008.
Feathers, D., Polzin, J., Paquet, V., Lenker, J., and Steinfeld, E. (2001). Comparison of traditional and electromechanical approaches for structural anthropometric data collection. Proceedings of the Human Factors and Ergonomics Society 45th Annual Meeting (pp. 1036‒1039).
Feathers, D., Paquet, V., and Drury, C. (2002a). Effects of automation of measurement error and consistency in anthropometry. Human Factors and Ergonomics Society 46th Annual Meeting, Baltimore, MD.
Feathers, D., Paquet, V., and Polzin, J. (2002b). Reliability of structural anthropometric measurements with traditional and semi-automated approaches. Proceedings of the Human Factors and Ergonomics Society 46th Annual Meeting.
Feathers, D. (2005). Digital human modeling and measurement considerations for wheeled mobility device users. In the Digital Human Modeling for Design and Engineering Symposium. 2004‒01‒2135. SAE International.
Feathers, D., and Paquet, V. (2006a). Three-dimensional variability of static anthropometric dimensions: Considering anatomy, behavior and process. Proceedings of the Human Factors and Ergonomics Society 50th Annual Meeting (pp. 1380‒1383).
Feathers, D., and Paquet, V. (2006b). Three-dimensional variability of static anthropometric dimensions: Considering anatomy, behavior and process. Proceedings of the Human Factors and Ergonomics Society 49th Annual Meeting.
Feathers, D., and Steinfeld, E. (2008). Subjective ratings of accessibility using full-scale bathroom environments. Proceedings of the Human Factors and Ergonomics Society 52nd Annual Meeting. (pp. 723‒727).
Feathers, D. (2009). Mitigating anthropometric measurement variation: Applied tolerances for static anthropometric landmark digitizations in three-dimensional space. Proceedings of the 17th World Congress on Ergonomics: An International Ergonomics Association Triennial Congress.
Joseph, C., D'Souza, C., Paquet, V., and Feathers, D. (2010). Comparison of hand grip strength between wheeled mobility device users and non-disabled adults. 3rd International Conference on Applied Human Factors and Ergonomics, 2010 AHFE International, Miami, Florida, Taylor and Francis, Ltd.
Jui-Feng, L., Drury, C., and Paquet, V. (2006). A quantitative methodology for assessment of wheelchair controllability. Proceedings of the Human Factors and Ergonomics Society 50th Annual Meeting. San Francisco, California: HFES.
Paquet, V., Feathers, D., and Lenker, J. (2001). Three-dimensional measurements, semi-standardized postures and clothing: structural anthropometric methods for persons with disabilities. Proceedings of Anthropometrics of Disability: An International Workshop, (8‒1)-(8‒9).
Paquet, V. (2009). Moving from accommodation to universal design. Proceedings of the 52nd Annual Meeting of the Human Factors and Ergonomics Society, September 22‒26, 2008.
Steinfeld, E., Paquet, V., and Lenker, J. (2002). New development in the anthropometry of wheelchair users. Proceedings of the Universal Design 2002 Conference, Yokahoma, Japan.
Steinfeld, E., Paquet, V., and Feathers, D. (2004). Space requirements for wheeled mobility devices. Human Factors and Ergonomics Society 48th Annual Meeting, New Orleans, LA.
Steinfeld, E., and Feathers, D. (2006). Space requirements for aging wheeled mobility users. Proceedings of the International Conference on Aging, Disability and Independence.
Steinfeld, E., Maisel, J., and Feathers, D. (2006). Wheeled mobility space requirements and maneuvering: An International Comparison of Standards and Research. Rehabilitation Engineering and Assistive Technology Society of North America Conference, Atlanta, GA.
Steinfeld, E., D'Souza, C., and Maisel, J. (2010a). Clear Floor Space For Contemporary Wheeled Mobility Users. 12th International Conference on Mobility and Transport for Elderly and Disabled Persons (TRANSED 2010), Hong Kong.
Steinfeld, E., D'Souza, C., Paquet, V., and White, J. (2010b). Clear floor area for wheeled mobility users. 3rd International Conference on Applied Human Factors and Ergonomics. Miami, Florida, Taylor and Francis, Ltd.
Steinfeld, E., Paquet, V., Lenker, J., D'Souza, C., and Maisel, J. (2010c). Universal Design Research on Boarding and Using Buses. 12th International Conference on Mobility and Transport for Elderly and Disabled Persons (TRANSED 2010), Hong Kong.
Technical Reports
Paquet, V., and Steinfeld, E. (2004). Space Requirements for Wheeled Mobility: An International Workshop, Buffalo, NY. Final Project Report to the U.S. Access Board, March, 2004. Retrieved December 20, 2010, from http://www.udeworld.com/anthropometrics.
Steinfeld, E., Lenker, J., and Paquet, V. (2002). Anthropometrics of Disability: An International Workshop, Buffalo, NY. Final Project Report to the U.S. Access Board, February, 2002. Retrieved December 20, 2010, from http://www.udeworld.com/anthropometrics.
Steinfeld, E., Maisel, J., and Feathers, D. (2005). Standards and anthropometry for wheeled mobility. Report prepared for the U.S. Access Board, July 2005. Retrieved December 20, 2010, from http://www.udeworld.com/anthropometrics
User Comments/Questions
Add Comment/Question