4.1 Wheeled Mobility Device Dimensions
Figure 1 and Table 2 show the standards from the four countries and the variables they include on wheeled mobility device sizes. Selected research findings are shown in Figures 2-8.
Figure 1
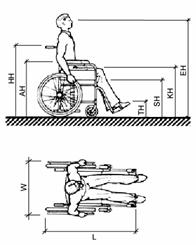
Table 2
|
|
U.S.* |
Australia |
Canada* |
U.K.* |
|
Unoccupied Width |
660 |
X |
660 |
X |
|
Unoccupied Length |
1065 |
X |
X |
X |
|
Handle Height (HH) |
915 |
X |
920 |
X |
|
Armrest Height (AH) |
760 |
X |
760 |
x |
|
Seat Height (SH) |
485 |
X |
480 |
480 |
|
Folded Wheelchair Width (F) |
X |
X |
300 |
X |
|
Occupied Width (W) |
X |
X |
X |
X |
|
Occupied Length (L) |
1200 |
X |
1200 |
X |
|
Eye Height (EH) |
1090-1295 |
1250 |
1100-1300 |
X |
|
Knee (Lap) Height (KH) |
685 |
X |
675 |
X |
|
Toe Height (TH) |
205 |
X |
200 |
X |
|
Toe Extension beyond Footrest (TE) |
150 |
X |
X |
X |
** Advisory information
Figure 2. Unoccupied Device Width
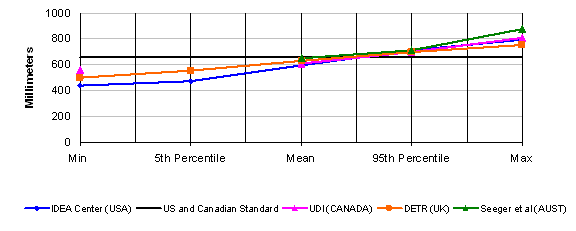
Figure 3. Unoccupied Device Length
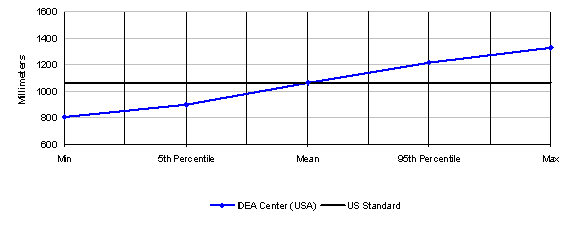
The research data shows that the sizes of devices vary considerably from the values in the standards. The sizes described in the standards are close to the mean values found in the research studies but this is certainly not sufficient to accommodate a large enough proportion of wheeled mobility users. For example, the IDEA data for mean unoccupied length is identical to the standard. But, the widest device measured was about 150 mm wider and the longest more than 200 mm longer.
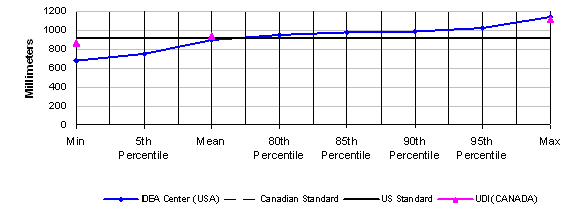
The data also indicates that armrest height and handle height vary considerably from the values included in standards but only for the extremes of the population (see figures 4-6). The means for these two variables were very close to the value in the standard in all three studies that measured it. In contrast, the mean seat height was above the value in the standard for the two studies that measured it and the difference between the value in the standards and the results is considerably larger than for armrest height and handle height.
Figures 4-5. Armrest Height
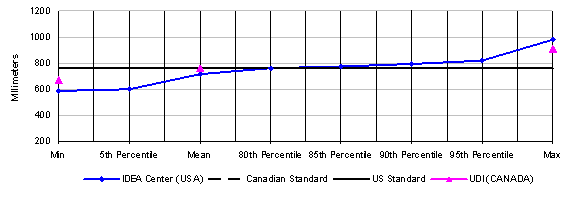
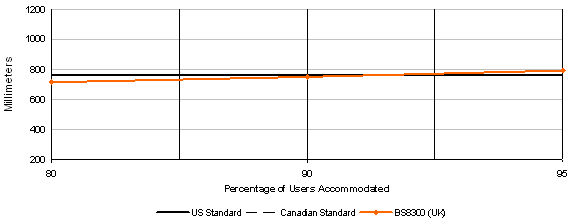
Figure 6. Handle Height
* One outlier removed due to data translation errors in software
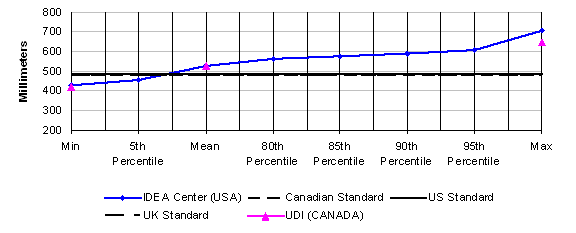
The two studies that measured seat height discovered that the values in the current standards are below the means of the research results. This is probably due to the increased use of positioning systems, thick cushions and the availability of a wider range of wheel sizes since the 1970s but it can also be due to differences in measurement methods. The height of the seat can be measured at the edge and at the middle, under the cushion, or on top of the cushion. Thus, specifying exactly how it is measured is important for comparing results. In the IDEA research, the height of a seat plane was defined and also measured at point at the rear of an individual’s buttocks using an extension of the electromechanical probe that we slipped down behind an individual’s back. The results would clearly be different compared to other measurements, particularly if the measurement was taken at the leading or trailing edge of the seat below the cushion.
Figure 7. Seat Height
* Two outliers removed from IDEA Center data due to translation problems in software
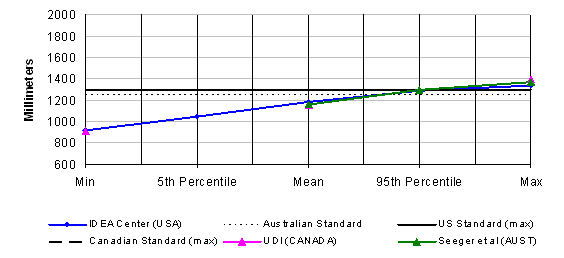
For eye height, the findings are extremely consistent. They show that the means are well below the values in the standards. The maximum values for the UDI, Seeger and IDEA studies are just slightly above the standard value. These results may be related to the increased use of thick cushions since the 1970s and elevated seating systems that position smaller individuals at a more functional height. The earlier research may not have included people of very small stature.
Figure 8. Eye Height
When the ANSI A117.1 (1980) Standard was developed, there was a true “standard adult manual wheelchair” but that is not the case today. Wheeled mobility technology has changed significantly and it is likely to continue changing. Many new types of devices have appeared on the market, both larger and smaller than the “standard adult wheelchair” of the 1970s and devices are fitted and customized more often to suit the needs of an individual. In the U.S., as the average weight of the population has increased, wheelchair manufacturers started producing wheelchairs with larger capacity and many more seat widths.
To provide realistic guidance for designers, information on wheeled mobility dimensions should include occupied sizes as well as device size and also include accessories as they are used in everyday life. Occupied device sizes are clearly preferable and more useful for designers than unoccupied sizes but it is not uniformly provided in the standards. For example, in the U.S. standards, only occupied length is shown whereas the width is based on the device alone. Unoccupied device size is important also because it defines the absolute bottom line for small clearances, e.g. knee clearances or closet openings. It is important to note that although data on device sizes is available from manufacturers, it does not include actual dimensions as set up for individuals nor does it provide data on added equipment like seating systems, cushions, control boxes, ventilators, carrying baskets and other accessories. In this regard, not all the studies measured unoccupied dimensions or included accessories as part of their dimensions and measurements (e.g. Stait et al., 2000).
Data on occupied device sizes is most valuable for establishing clear floor area requirements. Thus, if occupied sizes are included in standards, it is important that they be consistent with the specified clear floor areas. Data on armrest, seat, and eye heights can be very useful for designers but it also can be misleading if not enough detail is provided. Design for extremes of a range may help only a very few people, yet design for the mean or median may exclude those in the extremes which may be very useful in the design of facilities that large numbers of wheeled mobility users may inhabit on a daily basis. If this data is reported in the standards, it should include enough information and guidance for designers to make informed decisions about how it is to be used.
The inclusion of handle height in the standards is of questionable value. We could not identify any need for this data. On the other hand, it would be useful to have information on accessory dimensions like control boxes and ventilators.
The illustrations used to depict wheeled mobility devices in the U.S. Australian and U.K. Standards are manual wheelchairs. The Canadian standard, however, includes illustrations and data on scooters and power chairs. This information can be very valuable to designers who are seeking to ensure full accessibility beyond minimum required levels. Additional illustrations are needed to convey the diversity in the devices and their occupants. Designers could also benefit from more information on device size to plan spaces like storage areas for wheelchairs at transportation terminals or the design of counter edges in relationship to armrests. For example, the U.K. standard includes data on the width of folded wheelchairs. Accurate and reliable data on device size may be more appropriate to provide in a reference manual with more detailed information and extensive illustrations of different equipment types in use.
Recommendations
- Provide illustrations of seven types of devices in an advisory section: attendant propelled manual chairs, old style manual chairs, lightweight manual chairs, power assisted chairs, power chairs with rear wheel drive, power chairs with mid wheel drive, scooters.
- Provide data on key characteristics of wheelchairs as used by individuals:
- Occupied width
- Occupied length
- Knee height
- Seat height
- Toe height
- Armrest height
- Eye height
- Head height (currently not included in the Guidelines but useful for vehicle design and also locations where lifts are installed that may not have sufficient headroom)
- Weight (currently not included in the Guidelines but critical for designing lift capacity and structural loads for ramps)
- For advisory purposes, provide statistical information on each variable from which percentile data can be calculated:
- Min-max values
- Standard deviation
- Median
- Update criteria that are based on the above dimensions. This includes but is not limited to clear floor areas, shower seat height, toilet height.
User Comments/Questions
Add Comment/Question