Part I. A Longitudinal Study of Trail Surfaces Final Report
I. Introduction to the Study
Purpose
For many years, the National Center on Accessibility (NCA) at Indiana University received questions from organizations, agencies and individuals on how to make natural surface trails firm and stable. The inquires centered on what materials would provide a firm and stable surface so people with disabilities could have a quality trail experience AND would blend in with and be friendly to the environment. In 2004, the National Center on Accessibility initiated a research study of trail surfaces funded by the U.S. Access Board. The longitudinal study objective was to evaluate the ability of a variety of aggregate and organic or natural by-product soil stabilizer trail surface materials to meet firmness and stability accessibility guidelines over a five-year period of use (data were collected over 51 months).
Background
June 20, 2007, the Access Board issued proposed guidelines for outdoor developed areas that include requirements for newly constructed or altered trails. Technical requirements for trails include the provision that trails that are accessible meet firmness and stability guidelines. Advisory information in the guidelines discusses the use of a Rotational Penetrometer to measure the firmness and stability of surfaces that are located on trails. According to U.S. Access Board Notice of Proposed Rulemaking (NPRM) for Outdoor Developed Areas contained in the June 20, 2007 Federal Register, firmness is defined as “the degree of surface resistance to deformation, especially by indentation or the movement of objects;” stability is defined as “the degree to which a surface resists change from contaminants or applied force, so that when the contaminant or force is removed, the surface returns to its original condition.” The proposed guidelines provided a table in an advisory that listed the firmness and stability classifications and their respective amounts of penetration calculated in inches (Table 3). These calculations were based on the findings of a small research project on firm and stable exterior surfaces conducted for the U.S. Access Board by Beneficial Designs in 1999.
The means and materials used to establish firm and stable exterior surfaces are diverse. Crushed stone, fines, packed soil, and other natural materials can provide a firm and stable surface. Natural materials bonded with synthetic materials are also hypothesized to provide the required degree of stability and firmness” (Final Report, US Access Board's Regulatory Negotiating Committee, 1999).
In the past, there have been a number of studies that have examined alternatives to asphalt and concrete as suitable materials for making trails accessible to people with disabilities. Most notably, the USDA Forest Service and the U.S. Department of Transportation/Federal Highway Administration have for years been conducting research on various stabilizers and other products as possible uses for trail stabilization. The overall objective of the NCA Trail Surface study was to contribute to the existing body of knowledge to determine which combination of stabilizer materials and aggregates provide the most firm and stable pedestrian use trail in different environments, climates and regions.
Modifications to the Longitudinal Study
In 2006, NCA began the recruitment of various sites to participate in the original study objectives. Entities such as the National Park Service, US Forest Service, and city Parks and Recreation departments were the central focus of the recruitment process. By the end of 2006, NCA had initial commitments from a number of state or federal outdoor recreation entities to provide test sites for the trail surface study, however, the down turn in the economy and additional factors such as lack of ability to commit labor hours and installation resources, resulted in those commitments being withdrawn. From the perspective of the individual potential sites, the original study objectives and methods for achieving them relied heavily on their ability to contribute their own money and labor to the study procedures; both resources that we saw become quickly depleted and/or significantly diminish. Potential study participants expressed concern in the ability to fund the portions of the study previously agree to be financially responsible for, which included the aggregate material needed for both the base of the trail surface and the aggregate which was mixed with the stabilizer for the cases where necessary. Soon after the initial concerns were being expressed by potential participants, NCA began receiving notifications that due to economic hardships, potential test site staff were being let go, and therefore the labor required in the study parameters to install the surfaces, and to maintain and observe them, disappeared. Another difficulty the potential test site location had was the ability to maintain the trails surface study site through the proposed five-year period of time. Most entities felt the timeframe was too long, and while they understood the need for the longevity in terms of receiving the most accurate data on the surface, it was not within their capability to meet those parameters. NCA received letters that cited these difficulties in addition to others. Financial restraints were not the only obstacle NCA faced in the beginning phases of the study. It was also difficult navigating through the research process of the National Parks Service, which is where a lot of the study energy was initially invested in gaining participation for the study. While many parks agreed to the study, and even got so far as to identify installation locations, the process of applying for in-the-park research from an outside agency made it impossible in some parks for the study to move forward. It became apparent that conducting the installation, maintenance, monitoring, and data collection at locations throughout the country was not feasible at that current time. As a result, the longitudinal data collected and reported for Part I of this study over 51 months, is limited to the Bradford Woods site in Martinsville, Indiana. The scope of the study again changed course to continue to discover other methods of contributing to the research on firm and stable natural trail surface alternative. The results of the change in scope is discussed in Part II of this report.
II. Research Methodology
In 2004, the National Center on Accessibility began the development of protocols for a National trails surface study to evaluate alternatives to asphalt, concrete and boardwalk as suitable materials for making trails accessible to people with disabilities. By 2007 installation of surface materials for testing was begun at Bradford Woods located at Indiana University.
The following are the three research questions explored in “Section III: Result of the Study”:
-
Does each of the 11 trail surface materials meet or exceed the classifications for firmness and stability as proposed by the US Access Board in their 2007 Notice of Proposed Rulemaking for Outdoor Developed Areas?
-
When evaluating the firmness and stability of each of the 11 trail surface materials, how does each of the 11 trail surface materials compare to themselves over a 51 month time period?
-
When evaluating the firmness and stability of each of the 11 trail surface materials, how does each surface compare to each of the other surfaces over a 51 month time period?
Selection of Locations
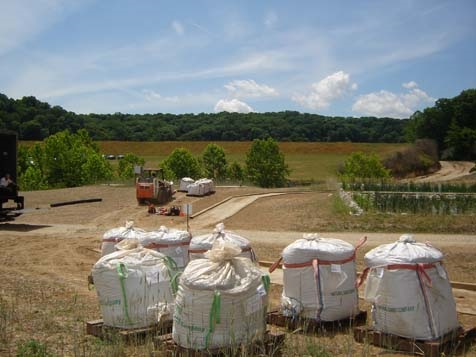
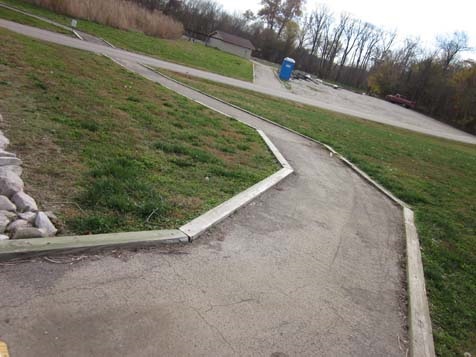
The longitudinal trail study was limited to the one geographic location of Bradford Woods located in Martinsville, Indiana, 30 minutes south of Indianapolis Indiana. Bradford Woods is an auxiliary enterprise of Indiana University and is part of the academic mission of the School of Public Health and is a unit of the environment, hosts various programs throughout the year that focus on adventure education, environmental education, and therapeutic recreation. Bradford Woods also hosts retreats and runs various camps. The 11 test plots were installed in a previously undisturbed wetlands area where the maximum running slope of any of the sections was 7.6 percent. The trail segments did not see high visitor use, and were restricted to just pedestrian access. The following are the average high and low temperatures and precipitation for Martinsville Indiana as recorded by month:
Average Temperature & Precipitation January to June
| Jan | Feb | March | April | May | June | |
| Average high in °F | 35 | 40 | 51 | 63 | 73 | 81 |
| Average low in °F | 18 | 21 | 30 | 40 | 50 | 59 |
| Av. precipitation - inch | 2.56 | 2.44 | 3.5 | 4.25 | 4.72 | 3.98 |
Average Temperature & Precipitation July to December
| July | Aug | Sep | Oct | Nov | Dec | |
| Average high in °F | 85 | 84 | 77 | 66 | 53 | 40 |
| Average low in °F | 63 | 61 | 52 | 40 | 32 | 23 |
| Av. precipitation - inch | 4.21 | 4.21 | 3.23 | 3.03 | 3.86 | 3.15 |
This site is within driving distance of the Bloomington-based research team and easily accessed at any given time throughout the length of the study. Bradford Woods was selected as a result of a direct advertising recruitment method for testing sites. The study was advertised on NCA’s website and through a news release disseminated by the NCA. Direct conversations were had with colleagues within the Department of Recreation, Parks, and Tourism Studies within the School of Public Health - Bloomington, to help recruit Bradford Woods as a potential test site. The selection of the location of the trail surface plots was purposeful within its location in the Wetlands area at Bradford Woods. Previous locations for surface testing did not include the factors associated with a wetlands installation and this particular site such as:
-
A previously undisturbed ground surface;
-
Minimal running and cross slope percentages (under five percent);
-
Allows for manufacturer technical installation instructions to be met; and
-
A physical environment with distinct ground characteristics (i.e. higher moisture content, less drainage, etc.).
Selection of Trail Surface Materials
A review of trail surfacing products conducted for this project identified approximately 80 different trail surface materials that promoted providing an accessible trail surface (PEL Consulting, 2004). Those trail surface materials that were similar products were listed together within each of five major categories:
-
Constructed soil/aggregate surfaces (e.g. crushed aggregate or brick, pre‐stabilized granite, aggregate fines, organic or natural by-product soil stabilizers);
-
Geosynthetics (e.g. geotextile, geocell, geoweb, geogrid);
-
Plastic and rubber solid surfaces (e.g. rubber mats, composite decking, plastic lumber, snow fence);
-
Wood surfaces (e.g. wood plank, chipped woods, engineered wood fiber); and
-
Brick and concrete surfaces (e.g. interlocking brick, concrete, asphalt).
The surfaces included in the study were chosen for inclusion as a result of three factors: donated product, ability to verify the stabilizer applications were a match for the native soils at Bradford Woods, and providing verification of the product being 100 percent natural, environmentally friendly product.
In order to ensure the validity of the study, exclusion criteria were then created based on limiting the scope of research to ensure the identified research questions could be answered. Based on the criteria for identifying firm and stable, organic or natural by-product surface materials, the following category of surface materials were identified for participation in the study:
-
Constructed soil/aggregate surfaces (e.g. crushed aggregate, pre-stabilized granite, aggregate fines, organic or natural by-product soil stabilizers).
A total of 11 surface materials (eight organic or natural by-product soil stabilizers, and three aggregate surfaces) were chosen based on their compatibility with existing soil and/or aggregate composition, and the manufacturer’s ability to provide lab results to verify the authenticity of the statement that their product is either an organic or a natural by-product. The following are the 11 surface materials evaluated in the study:
-
¼ inch minus crushed limestone and dust
-
¾ inch minus crushed limestone and dust
-
¾ inch minus crushed limestone and dust base and ¼ inch minus crushed limestone and dust top dress
-
Klingstone 400
-
Stabilizer
-
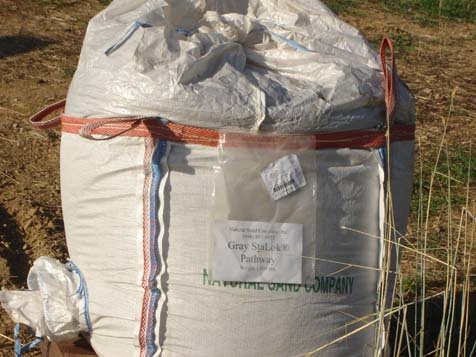
StaLok
-
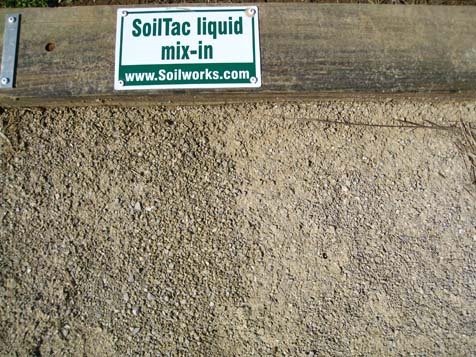
Soiltac Liquid Mix-in
-
Soiltac Liquid Topical
-
Soiltac Powder Mix-in
-
Soiltac Powder Topical
-
Polypavement
Delimitations
The study was delimited in scope by the following:
-
Data from this study were obtained from a longitudinal study administered through the National Center on Accessibility (NCA) at Indiana University;
-
One category of surface materials, constructed soil/aggregate surfaces out of six identified were chosen for participation in the study;
-
Size of the site limited total number of trail surface products that were able to be installed;
-
Trail surfaces were evaluated on site using a Rotational Penetrometer (RP) to determine firmness and stability of the surface; and
-
Firmness and stability readings were evaluated based on the recommended values of the U.S. Access Board in the Notice of Proposed Rulemaking for Outdoor Developed Areas (U.S. Access Board, 2007).
Limitations
The study is limited in scope by the following:
-
Ability to generalize findings to trails in other locations with the same surfaces applied. Surfaces installed in other locations vary in terms of design parameters, frequency and type of use, site conditions, weather and climate;
-
The sections of installed trail surface materials see different uses and frequency at Bradford Woods. Higher visitor usage, and varying types of usage, can affect the surface material;
-
Not all soil stabilizers were able to be installed at the chosen site location due to soil/aggregate incompatibility thus limiting the ability to test a wider variety of surfaces which would contribute to a larger data set for comparison;
-
Climate, adverse weather conditions, seasonal changes, and precipitation may affect trail surface materials; those differences in other locations cannot be accounted for with this study;
-
Surfaces needed to be maintained and were maintained in order to ensure their safe usage for the daily operation of Bradford Woods.
Assumptions
In 2007 the U.S. Access Board published values for firmness and stability in the NPRM for Outdoor Developed Areas based on use of the Rotational Penetrometer. For the purpose of this study, it was assumed that:
-
A Rotational Penetrometer can be used to determine firmness and stability for trail surfaces as they relate to accessibility
Definitions of Terms
For the purpose of this study and further discussion, the following terms will be used:
Aggregate. Crushed limestone (crushed shale or rock in regions that limestone is not available), natural soils, or dirt that is brought in from a different location than the actual site.
Firmness. The degree of surface resistance to deformation, especially by indentation or the movement of objects (U.S. Access Board, 2007).
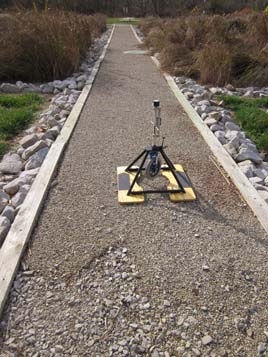
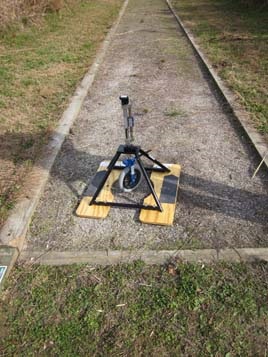
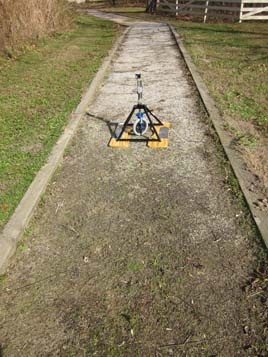
Rotational Penetrometer. The instrument used in field-testing to test for compliance with the Outdoor Developed Areas Guidelines firmness and stability recommendations. The Rotational Penetrometer, developed by Beneficial Designs, uses a wheelchair caster placed on a spring loaded caliber in a metal tripod frame which suspends the caster about 6 inches over the surface. When the caster is released, the spring load gauge replicates the force of an individual in a wheelchair over a given surface. The penetration into the surface is measured for readings of “firmness.” The test for stability requires the caster of the Rotational Penetrometer to be moved from side to side to determine the horizontal displacement of the surface material.
Soil Stabilizer. A product that is applied either topically, or mixed-in that acts as a binding agent to either native soils or an additional type of aggregate. The soil stabilizers chosen for this study are all "green" products meaning that they come from natural by products.
Stability. The degree to which a surface resists change from contaminants or applied force, so that when the contaminant or force is removed, the surface returns to its original condition (U.S. Access Board, 2007).
Trail. A pedestrian route developed primarily for outdoor recreational purposes (U.S. Access Board, 2009).
Data Collection Procedures
The trail surface site is hosted by Bradford Woods but NCA staff collected all data. While the site for the study was not kept confidential and the test plots are identified by signage, no data results have been posted prior to this final report.
Upon consent to participate in this study, the site owner (Bradford Woods) was asked to designate a site coordinator to provide the principal investigator (NCA Trail Study Coordinator Nikki Montembeault) with any additional information necessary for data collection, such as vendor information, cost of product installation, materials needed, and any mandatory maintenance required. Consent from the manufacturers of the products consisted of the manufacturers agreeing to the release of their product names and data collected on their surfaces to the public, and to be used for future research endeavors. Within a maximum of one month from each surface installation, a preliminary accessibility assessment of the trail surface was conducted and the surfaces were tested for firmness and stability with the Rotational Penetrometer. This was considered the first set of data collected for the longitudinal study. Accessibility assessments and trail surface testing for firmness and stability were conducted on average, three months per year for 51 months. In addition to the data collected with the Rotational Penetrometer, photos were taken of individual surface materials at both the time of the installation and during the assessments; observational notes were recorded about surface conditions at the time of the assessments and external factors that may have influenced or affected the surfaces positively or adversely. Those external factors noted included external weather temperature, recent extreme weather conditions, sun and shade conditions of the trail, and season of the year (deduced by recording the month).
The 11 trail surface segments ranged in length from 30 feet – 200 feet (see the Qualitative and Observational Analysis by Surface Type for an accurate breakdown by trail surface segment). The parameters of the Rotational Penetrometer testing consisted of testing each trail segment for firmness and stability in five locations along the trail segment. The intent of the five firmness and stability readings was to ensure readings were gathered from various locations within the segment in the event that trail surface conditions varied. Potential causes for variation might be running and cross slope, a difference in drainage and/or adjacent runoff, and sun vs. shade location of reading locations.
Instrumentation for Analysis
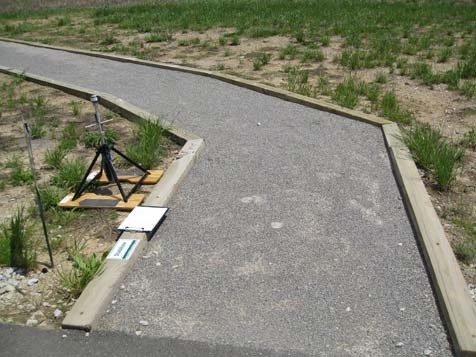
One instrument, the Rotational Penetrometer (Figure A), was used for data collection. An on-site inspection form (Appendix C) was created to collect data on the 11 trail segments including Rotational Penetrometer readings, inspection location in feet from trailhead, ruts, tread obstacles, or other surface abnormalities. Testing for wheelchair accessibility specific to firmness and stability was conducted with the application of the Rotational Penetrometer as developed by Beneficial Designs.
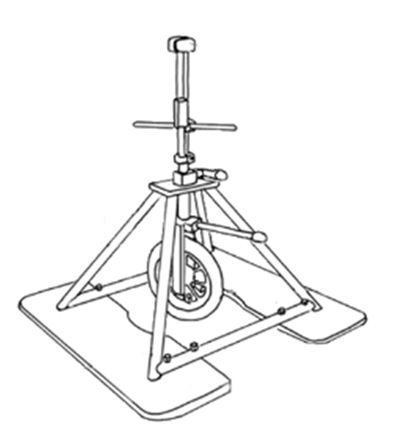
Figure A Rotational Penetrometer
Treatment of Data
The research design for this study was developed to collect data on trail surface conditions, evaluate individual surface performances over time, note deficiencies, and compare across surface types. Through further analysis, results of trail surface tests for firmness and stability were compared within surface composition categories and across surface composition categories to determine the mean, range and standard deviation of each surface type. Descriptive statistics were used for analysis of data. A one-way analysis of variance (ANOVA) was used to determine if there was any statistical significance between surface composition categories. Sequence charts were run and analyzed for each surface composition category to determine if any patterns, similarities and/or differences between surface compositions could be discerned. Lastly, qualitative data on the surface material conditions during the site visit was collected in order to provide a narrative description of findings.
III. Results of the Study
The purpose of the longitudinal study was to evaluate a variety of aggregate and organic or natural byproduct soil stabilizer trail surface materials for their ability to meet the recommended firmness and stability values established by the proposed accessibility guidelines over an extended period of time. The Notice of Proposed Rulemaking for Outdoor Developed Areas Accessibility Guidelines provides guidelines for firmness and stability, and the longitudinal trail surface study explored the following three research questions:
-
Does each of the 11 trail surface materials meet or exceed the classifications for firmness and stability as proposed by the US Access Board in their 2007 Notice of Proposed Rulemaking for Outdoor Developed Areas?
-
When evaluating the firmness and stability of each of the 11 trail surface materials, how does each of the 11 trail surface materials compare to themselves over a 51 month time period?
-
When evaluating the firmness and stability of each of the 11 trail surface materials, how does each surface compare to each of the other surfaces over a 51 month time period?
Performance for Surface Firmness and Stability
Table 1 identifies the 11 test surface materials, the dates of installation, and the date of the initial and final testing of surfaces at the Wetlands at Bradford Woods in Martinsville, Indiana:
| Table 1. Surface Material, Installation, Initial and Final Data Collection | |||
| Surface Material | Date of Installation | Date of Initial
Data Collection
|
Data of Final
Data Collection
|
| ¼ inch minus limestone | August 9, 2007 | August 16, 2007 | November 02, 2011 |
| ¾ inch minus & ¼ inch minus limestone | August 9, 2007 | August 16, 2007 | November 02, 2011 |
| ¾ inch minus limestone | August 1, 2007 | August 16, 2007 | November 02, 2011 |
| Klingstone 400 | June 19, 2007 | June 21, 2007 | November 02, 2011 |
| Polypavement | July 3, 2007 | June 6, 2007 | November 02, 2011 |
| Soiltac Liquid Mix-In | June 27, 2007 | July 6, 2007 | November 02, 2011 |
| Soiltac Liquid Topical | June 27, 2007 | July 6, 2007 | November 02, 2011 |
| Soiltac Powder Mix-In | June 27, 2007 | July 6, 2007 | November 02, 2011 |
| Soiltac Powder Topical | June 27, 2007 | July 6, 2007 | November 02, 2011 |
| Stabilizer | June 21, 2007 | July 6, 2007 | November 02, 2011 |
| StaLok | June 21, 2007 | July 6, 2007 | November 02, 2011 |
The surfaces were tested three times a year (with the exception of 2007 and 2010 when each of the surfaces were tested twice), over 51 months. The testing occurred in varying seasons to capture the way in which the climate change affects the surfaces. The firmness and stability means and standard deviations are important elements of the data collection and reporting process. However, a potentially more telling figure may reside in the minimum and maximum ranges for each. Table 2 provides the ranges, means and standard deviations for firmness and stability readings as measured by the Rotational Penetrometer.
| Table 2. Trail Surface Material and Firmness and Stability Data | ||||||
| Surface Material | Firmness Range | Firmness Mean | Firmness Standard Deviation | Stability Range | Stability Mean | Stability Standard Deviation |
| ¼ inch minus limestone | 0.16‒0.25 | 0.20 | 0.03 | 0.22‒0.71 | 0.43 | 0.17 |
| ¾ inch minus & ¼ inch minus limestone | 0.15‒0.27 | 0.18 | 0.03 | 0.21‒0.59 | 0.35 | 0.11 |
| ¾ inch minus limestone | 0.15‒0.19 | 0.17 | 0.01 | 0.21‒0.41 | 0.28 | 0.07 |
| Klingstone 400 | 0.15‒0.21 | 0.18 | 0.02 | 0.18‒0.27 | 0.22 | 0.02 |
| Poly-pavement | 0.16‒0.35 | 0.26 | 0.07 | 0.18‒0.70 | 0.44 | 0.18 |
| Soiltac Liquid Mix-In | 0.15‒0.25 | 0.19 | 0.03 | 0.17‒0.64 | 0.41 | 0.15 |
| Soiltac Liquid Topical | 0.15‒0.29 | 0.19 | 0.04 | 0.19‒0.74 | 0.40 | 0.18 |
| Soiltac Powder Mix-In | 0.14‒0.21 | 0.17 | 0.02 | 0.18‒0.49 | 0.33 | 0.10 |
| Soiltac Powder Topical | 0.16‒0.25 | 0.19 | 0.03 | 0.20‒0.60 | 0.33 | 0.12 |
| Stabilizer | 0.14‒0.23 | 0.18 | 0.03 | 0.27‒0.96 | 0.44 | 0.18 |
| StaLok | 0.14‒0.18 | 0.16 | 0.01 | 0.17‒0.24 | 0.20 | 0.02 |
To decipher the firmness and stability classifications of each of the trail surface materials, Table 3 was utilized. Table 3 depicts the firmness and stability classifications according to the NPRM for Outdoor Developed Areas. In 2004, at the start of the study, the identified table was referenced in the NPRM for Outdoor Developed Areas, but has since been removed from the Draft Final for Outdoor Developed Areas guidelines. The removal of the classifications was due in part to a lack of sufficient research to support the numerical associations of the firmness and stability ranges.
| Table 3. Firmness and Stability Classification per NRPM Outdoor Developed Areas | |
| Firmness Classification | Amount of Penetration |
| Very Firm | 0.3 inches or less |
| Moderately Firm | > 0.3 inches and < 0.5 inches |
| Not Firm | Greater than 0.5 inches |
| Stability Classification | Amount of Displacement |
| Very Stable | 0.5 inches or less |
| Moderately Stable | > 0.5 inches and < 1.0 inch |
| Not Stable | Greater than 1.0 inch |
Table 4 correlates the firmness and stability classifications of the surface means, to the data reading outputs. When classifying the firmness and stability means, the surfaces all test in the top (most firm and most stable) classification for firmness and stability. Meaning, these specific surface installations would be reported as firm and stable surfaces according to the US Access Board per the NPRM for Outdoor Developed Areas.
| Table 4. Firmness and Stability Classifications of Data Surface Material Means | ||
| Surface Material | Firmness Classification | Stability Classification |
| ¼ inch minus limestone | Very Firm | Very Stable |
| ¾ inch minus & ¼ inch minus limestone | Very Firm | Very Stable |
| ¾ inch minus limestone | Very Firm | Very Stable |
| Klingstone 400 | Very Firm | Very Stable |
| Polypavement | Very Firm | Very Stable |
| Soiltac Liquid Mix-In | Very Firm | Very Stable |
| Soiltac Liquid Topical | Very Firm | Very Stable |
| Soiltac Powder Mix-In | Very Firm | Very Stable |
| Soiltac Powder Topical | Very Firm | Very Stable |
| Stabilizer | Very Firm | Very Stable |
| StaLok | Very Firm | Very Stable |
However, when comparing readings for the firmness and stability ranges, the soil stabilizer and trail surface segment Polypavement, exceeds the range of “very firm” and would be classified as “moderately firm” (as seen in Table 5). The ¼ inch minus limestone, ¾ inch minus and ¼ inch minus limestone, Polypavement, Soiltac Liquid Mix-in, Soiltac Liquid Topical, Soiltac Powder Topical, and Stabilizer all exceed the stability classification of “very stable” and would all be classified as “moderately stable”. This is an important observation to make as trail surfaces are expected to meet the firmness and stability classifications to the maximum extent practicable for the total length of time that the trail is open to the general public and/or its visitors. Evidence of varying firmness and stability could lead to a surface becoming non-firm and non-stable over time.
| Table 5. Firmness and Stability Classifications of Data Surface Material Ranges | ||
| Surface Material | Firmness Classification | Stability Classification |
| ¼ inch minus limestone | Very Firm | Moderately Stable |
| ¾ inch minus & ¼ inch minus limestone | Very Firm | Moderately Stable |
| ¾ inch minus limestone | Very Firm | Very Stable |
| Klingstone 400 | Very Firm | Very Stable |
| Polypavement | Moderately Firm | Moderately Stable |
| Soiltac Liquid Mix-In | Very Firm | Moderately Stable |
| Soiltac Liquid Topical | Very Firm | Moderately Stable |
| Soiltac Powder Mix-In | Very Firm | Very Stable |
| Soiltac Powder Topical | Very Firm | Moderately Stable |
| Stabilizer | Very Firm | Moderately Stable |
| StaLok | Very Firm | Very Stable |
To best depict the firmness and stability of a surface as compared to itself over a period of time, it is easiest to examine graphs that depict the performance of the individual surfaces over the 51 months. Each graph contains the firmness mean in blue and stability mean in red along the vertical axis, and the date of data collection for each reading along the horizontal axis. The graph title identifies the surface material, and in addition, the composition of the material identified.
Each of the eleven surfaces shows a decline in stability from the point of installation and first rotational penetrometer test, to the last date of data collection at the end of the 51 month study. Whereas, only Soiltac Powder Topical and Polypavement show a decline in the firmness from the point of installation and first rotational penetrometer test, to the last date of data collection at the end of the 51 month study.
Figure B ¼ inch minus limestone aggregate
Figure C ¾ inch & ¼ inch minus limestone aggregate
Figure D ¾ inch minus limestone aggregate
Figure E Klingstone 400
Figure F Polypavement
Figure G Soiltac liquid mix‐in
Figure H Soiltac liquid topical
Figure I Soiltac powder mix‐in
Figure J Soiltac powder topical
Figure K Stabilizer
Figure L StaLok
Five different surface compositions make up the 11 various trail surfaces. The following is a breakdown of the five types of surfaces (the make-up of the surface) and the trail surfaces that are included in each:
-
Polyurethane: Klingstone 400
-
Vinyl Acetate Copolymer: Soiltac Liquid Topical, Soiltac Liquid Mix-in, Soiltac Powder Topical, and Soiltac Powder Mix-in
-
Organic Plant Material: Stabilizer
-
Polymer: StaLok and Polypavement
-
Aggregate and fines: ¼ inch minus limestone, ¾ inch minus base and ¼ inch minus top dress limestone, and ¾ inch minus limestone
Utilizing the firmness and stability means of each of the five different surface compositions, a one-way analysis of variance (ANOVA) was run to determine if there was a statistical significance between each of the five different surface composition types. A statistical significance between surface compositions would mean that on average, the surface composition that shows a statistical significance would have maintained a greater degree of firmness or stability over the study period. In order to be statistically significant, the firmness or stability means of one surface composition, when compared to another, would have to be equal to or less than .05. The analysis found that there was a statistical significance in stability between Klingstone 400 (polyurethane), all four Soiltac (vinyl acetate copolymer) surface compositions, the organic plant material, and the ¼ inch minus limestone aggregate surface. To illustrate this point, review Figure M and observe that according to the data collected on five surface compositions over 51 months, it is 95 percent (or .95) certain that the polyurethane surface composition (in this case Klingstone 400) remained more consistently stable than the other three surface compositions (vinyl acetate copolymer, organic plant material, and a ¼ inch minus aggregate surface).
Figure M Statistical significance of stability between surface compositions
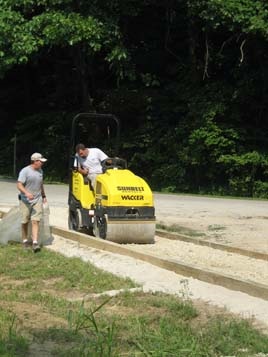
Installation of Aggregate Surfaces at Bradford Woods
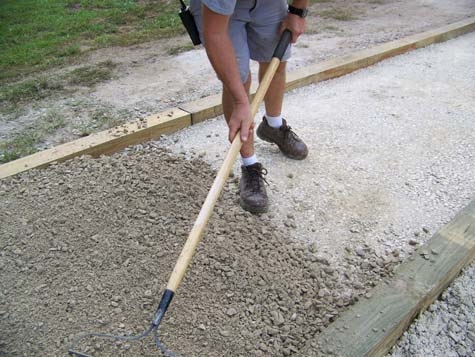
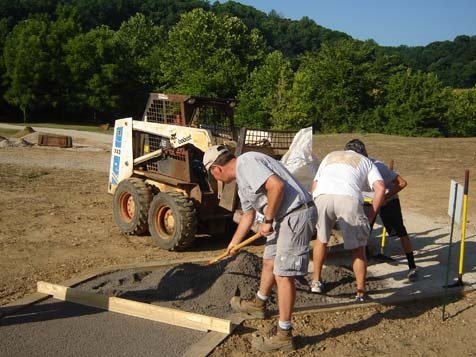
The installation of the aggregate surfaces at Bradford Woods conformed to the following protocol:
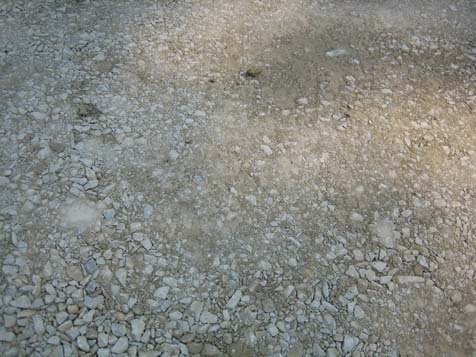
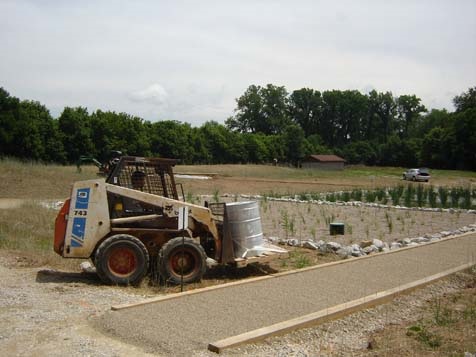
Prior to installing the crushed rock (aggregate) surfacing material, the trail bed shall be shaped to reflect the same linear grade and cross slope as the desired finished surface. The trail bed shall be uniformly smooth and compacted to a rate of 90 percent.
The rock shall be from a quarry and have angular fractured surfaces. It shall be ¾ inch minus 100 percent crushed and shall be free of vegetable matter and other potentially harmful substances. It shall be of such nature that it can be compacted readily under watering to form a firm and stable surface. The crushed rock shall be inspected by a representative of the contracting agency prior to delivery to the worksite to insure material quality. The crushed quarried rock shall conform to the grading requirements shown in Table 6.
| Table 6. Installation of Firm and Stable Aggregate Material at Bradford Woods | ||
| Sieve Sizes | ¾ inch Maximum Individual Test Result | Moving Average |
| 1” | 100 | 100 |
| ¾” | 87‒100 | 90‒100 |
| No. 4 | 30‒60 | 35‒55 |
| No. 30 | 5‒35 | 10‒30 |
| No. 200 | 0‒12 | 2‒9 |
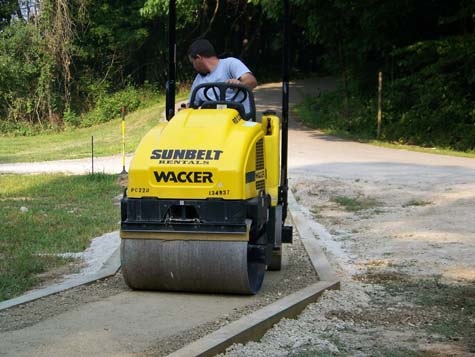
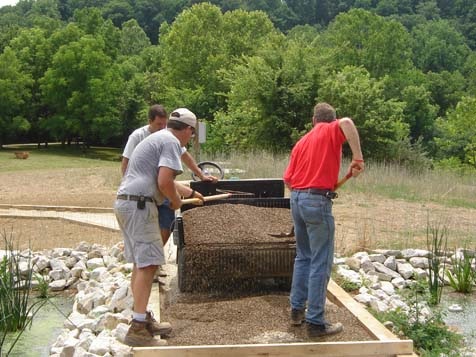
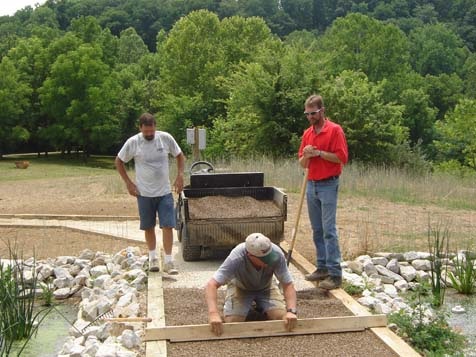
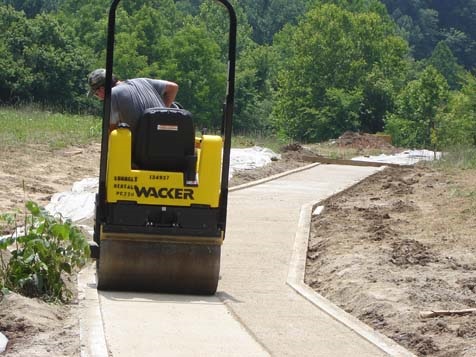
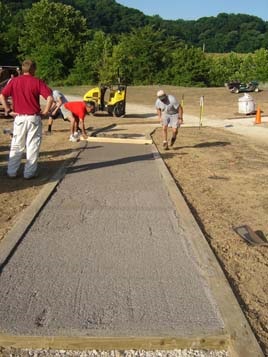
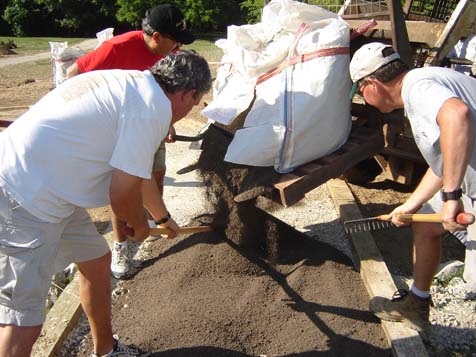
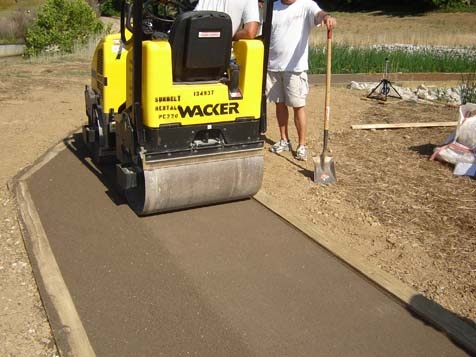
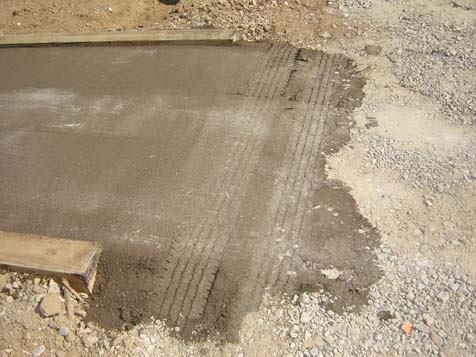
The crushed rock shall be applied to the trail bed at a minimum depth of 6 inches. The application shall be performed in two separate 3-inch lifts. Each lift shall be shaped to the proper linear grade and cross slope prior to compaction. Compaction shall be performed by using either a viberplate compactor or a vibratory roller and shall achieve a minimum compaction rate of 90 percent. The crushed rock shall be kept moist to achieve the maximum rate of compaction. Native soil shall be blended into the last 3-inch lift of crushed rock to soften the color and texture of the finished trail tread. The rate of application shall vary depending on the clay content of the native soil. The finished surface of the trail tread shall be uniformly smooth without holes or concave depressions that can trap water. Photos that illustrate the installation of each trail section are included in Appendix D.
Qualitative and Observational Analysis by Surface Type
The aggregate material listed below contains a size (inch), the label “minus”, and an aggregate type. In the Midwest, the primary aggregate material made available at quarries for distribution is Limestone; therefore, Limestone was the aggregate component used in the aggregate only trail segments. When ordering the aggregate material from the quarry, it is up to the individual placing the order, to decipher which size aggregates, percentage of aggregate, and percentage of fines will be included in the combined shipment of materials. Varieties of aggregate stone sizes were chosen for the trail segments in this study and they included stones that ranged from ¼ inch to ¾ inches.
To understand the “minus” meaning of the aggregate denoted, it is essential to explain the composition of the material as it leaves the quarries. For example for an order for ¾ inch minus limestone aggregate, the “minus” essentially means that the shipment of aggregate will include both stones and fines (small particles resembling dust) that are a maximum size of ¾ inches and smaller. Quarries produce aggregate specification sheets that they make available for each shipment of aggregate. The aggregate specification sheet will contain the sieve size (size of stone that is allowed to pass through the sieve to be included in the shipment) and the percent of that particular size that is included (percent passing). In the example, 100 percent of the stones that are ¾ inches are allowed to pass and will be included. Of the stones that are 3/8 inches, 77 percent of the stones are allowed to pass and will be included. Of the stones that are #4 (smaller than 3/8 inches), 46 percent of the stones are allowed to pass and will be included (so on and so forth). Anything that is identified as #200 is considered dust, so in this example, 11.3 percent is allowed to pass and will be included.
The size of the aggregate distributed is often of critical importance to the way the material performs. Too much of the smaller fines in comparison to the larger fines may contribute to more washout or erosion, whereas not enough smaller fines may lead to lots of loose, larger aggregate pieces that can contribute to a non-firm and non-stable surface.
Appendix D contains photos of the installation of each of the 11 trail segments, in addition to photos that chronicle the effects of time on the surfaces over 51 months.
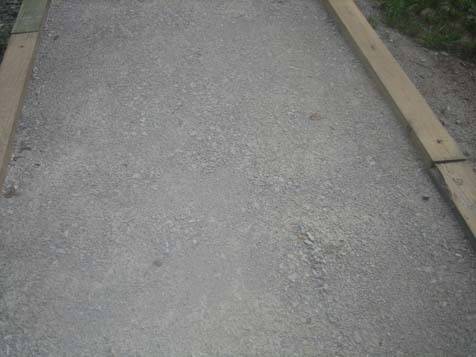
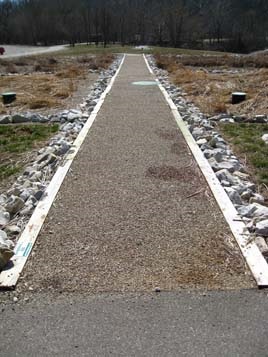
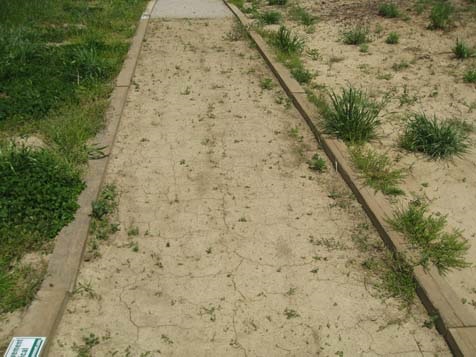
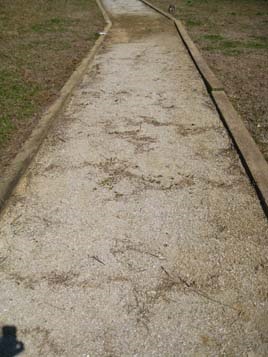
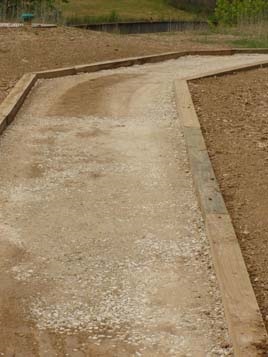
¼ Inch Minus Limestone
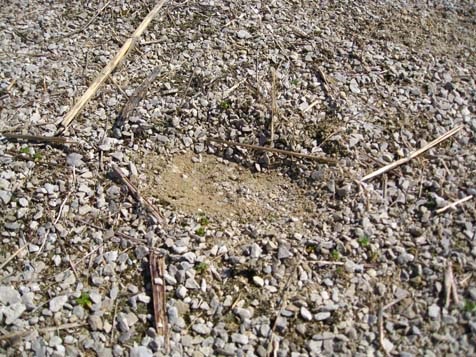
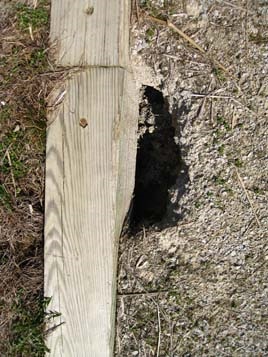
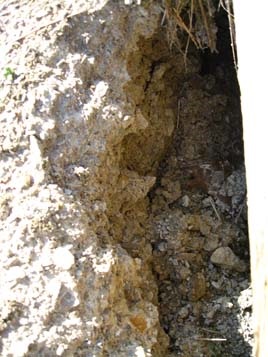
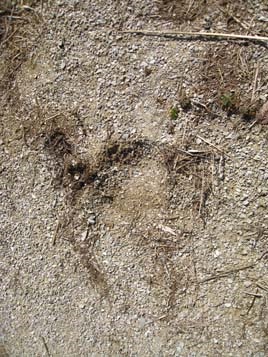
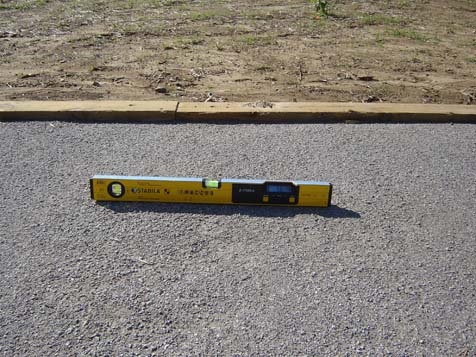
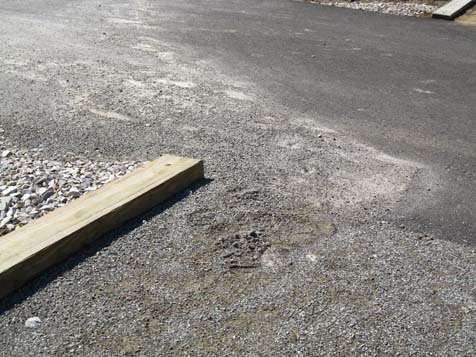
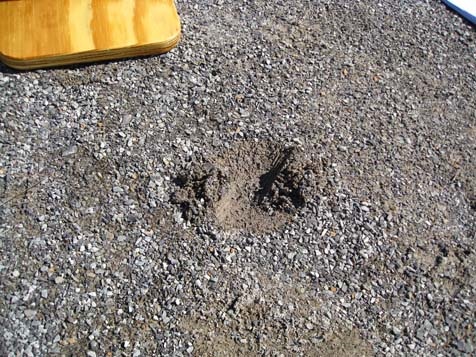
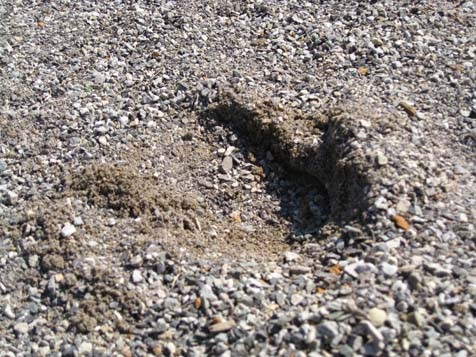
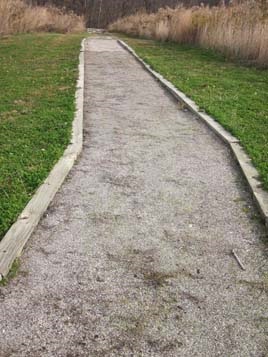
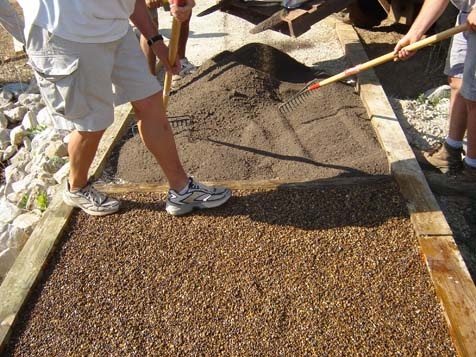
The trail segment is composed of 6 inches of ¼ inch minus limestone and dust and is 5 feet wide by 50 feet long. The segment contains timber edging. The surface was installed in two rolled and compacted 3 inch lifts. The segment maintained itself well in dry temperatures (June – August; 100 degree temps), remaining hard and compacted under foot. Following the first two days of heavy rainfall uncharacteristic for Indiana, the surface was loose under foot and was bogged down with water. Eventually, the surface developed an erosion ditch measuring approximately 16 feet and at a depth of approximately 3 inches. The surface never firmed back up under foot by the end of fall. After extended periods of no moisture and sun, the surface firms back up under foot.
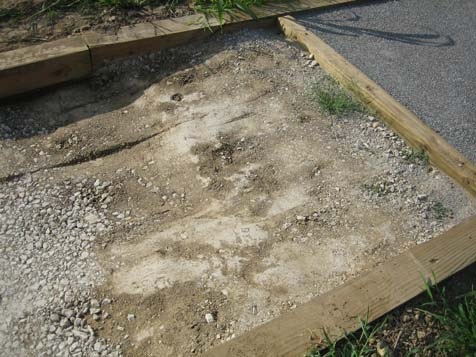
Quarter Inch Minus Limestone was installed in two rolled and compacted 3 inch lifts. August 9, 2007.
Quarter Inch Minus Limestone trail segment as second lift is rolled and compacted. August 9, 2007.
Quarter Inch Minus Limestone trail segment maintained itself in dry temperatures. October 19, 2007.
Quarter Inch Minus Limestone trail segment was loose under foot after heavy rainfall. March 13, 2008.
Quarter Inch Minus Limestone trail segment developed an erosion ditch. March 13, 2008.
Quarter Inch Minus Limestone trail segment would only firm up after extended periods of no moisture. March 17, 2009.
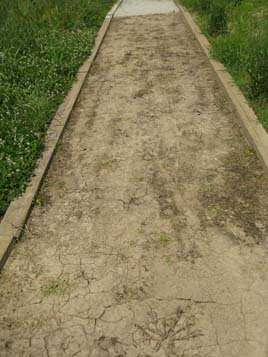
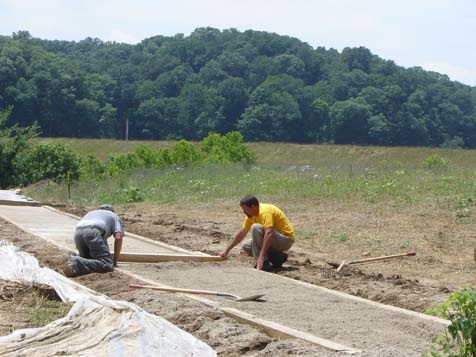
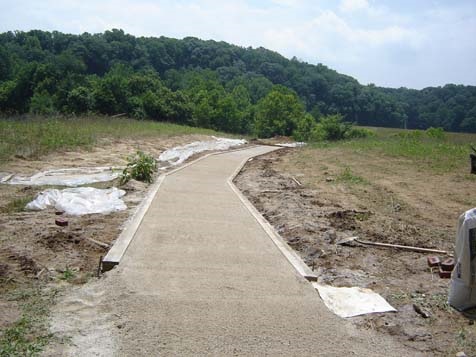
¾ Inch Minus and ¼ Inch Minus Limestone
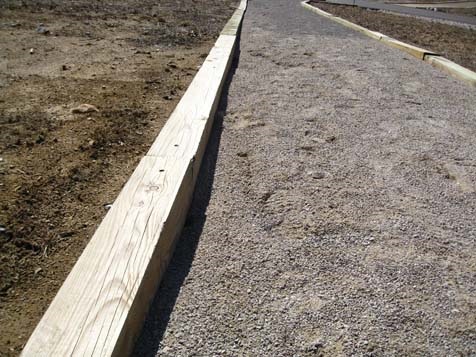
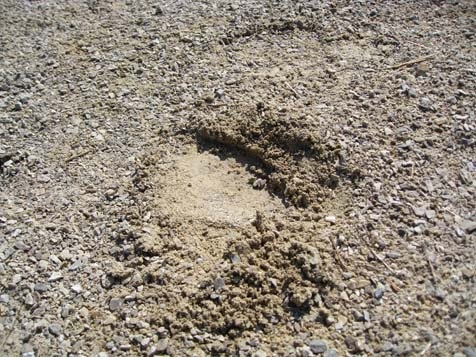
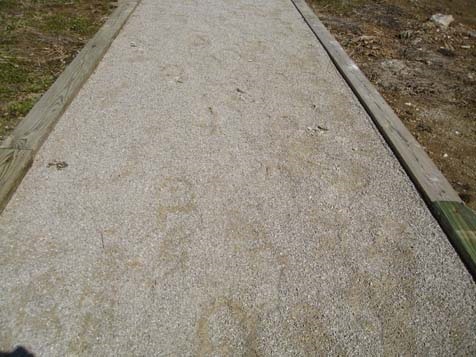
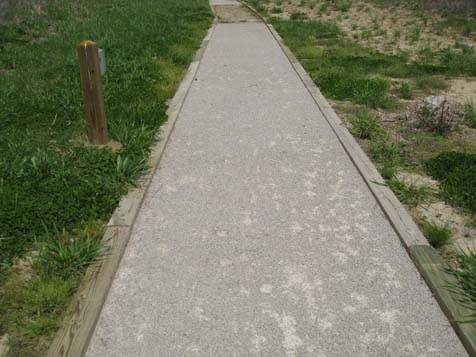
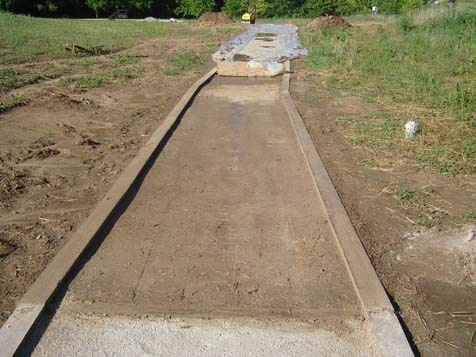
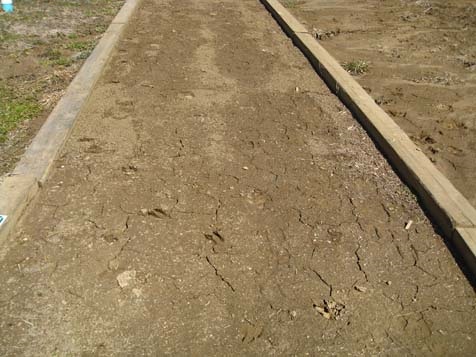
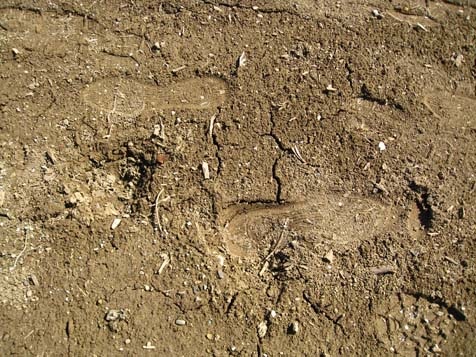
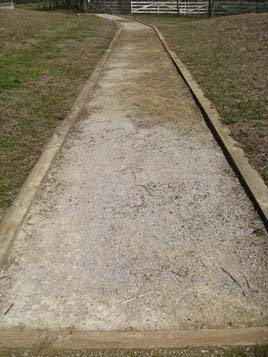
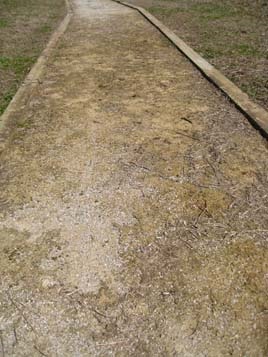
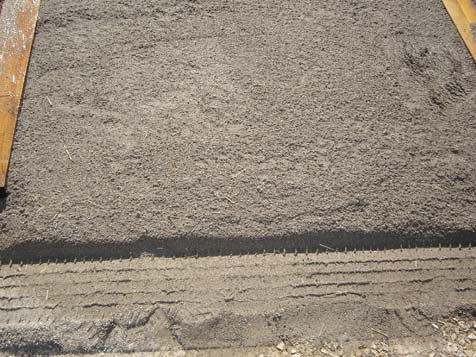
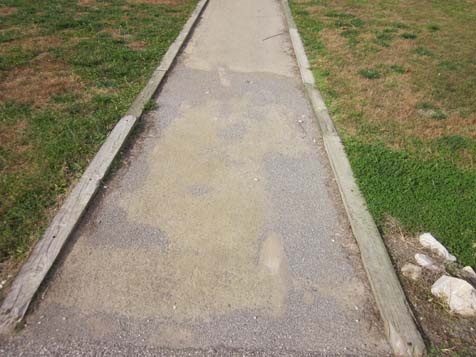
The trail segment is composed of 4 inches of ¾ inch minus limestone and approximately 50 percent dust as a base; and a 2 inch top‐dressing of ¼ inch minus limestone and dust. This trail segment is 5 feet wide by 50 feet long and contains timber edging. This segment maintained itself well in dry temperatures (June – August; 100 degree temps), remaining hard and compacted under foot. It did then show signs of becoming loose under foot at the first two days of heavy rainfall. The surface stayed soft under foot, enough to see footprints compacted and not return to the surface, but did not show any signs of erosion. The surface appeared to become firm and stable under foot more quickly than the ¼ inch surface; most likely as a result of a base composed of larger fines to allow for more adequate drainage.
Three Quarter Inch Minus Base and Quarter Inch Minus Top Limestone trail segment is composed of 4 inch base; and a 2 inch top-dressing. August 9, 2007.
Three Quarter Inch Minus Base and Quarter Inch Minus Top Limestone trail segment maintained itself in dry temperatures. October 19, 2007.
Three Quarter Inch Minus Base and Quarter Inch Minus Top Limestone trail segment after heavy rain. March 13, 2008.
Three Quarter Inch Minus Base and Quarter Inch Minus Top Limestone trail segment firmed back up more quickly than the ¼ inch surface. May 6, 2008.
Three Quarter Inch Minus Base and Quarter Inch Minus Top Limestone trail segment showed signs of footprints after heavy rain. March 17, 2009.
Three Quarter Inch Minus Base and Quarter Inch Minus Top Limestone trail segment after heavy rain. March 17, 2009.
Three Quarter Inch Minus Base and Quarter Inch Minus Top Limestone trail segment after heavy rain. March 17, 2009.
Three Quarter Inch Minus Base and Quarter Inch Minus Top Limestone trail segment became firm and stable under foot more quickly than the ¼ inch surface. November 2, 2011.
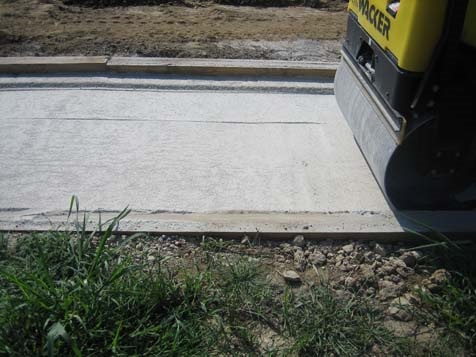
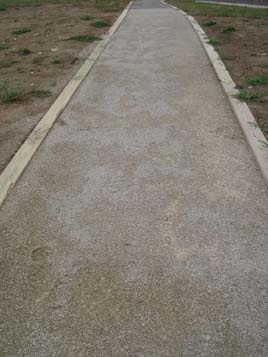
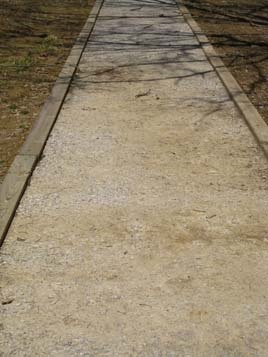
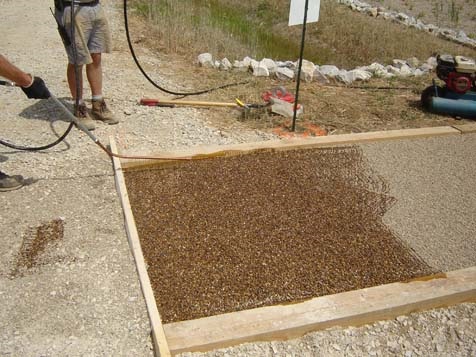
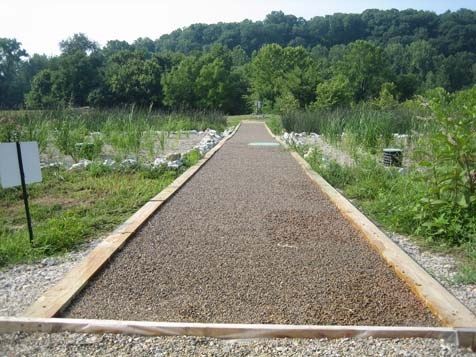
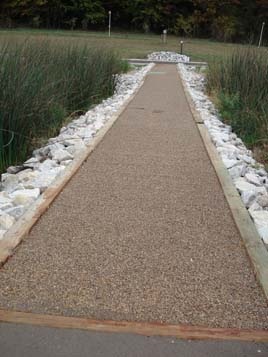
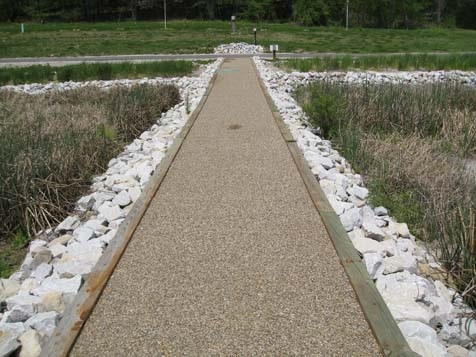
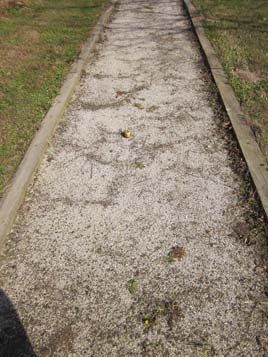
¾ Inch Minus Limestone
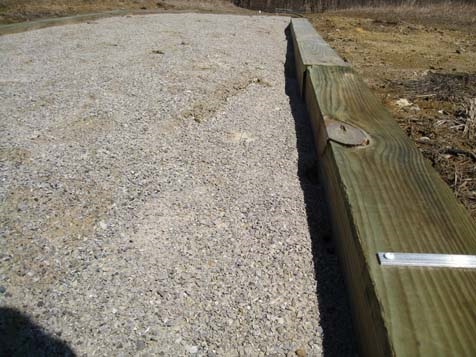
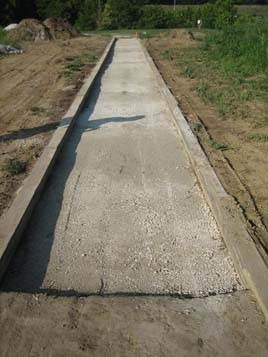
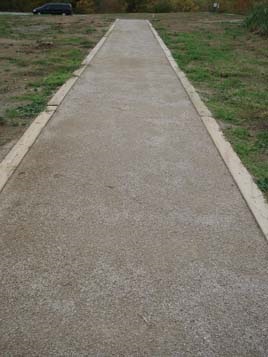
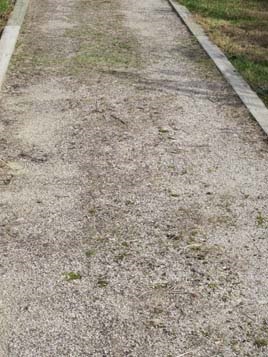
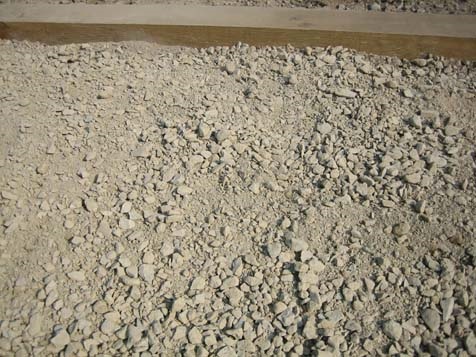
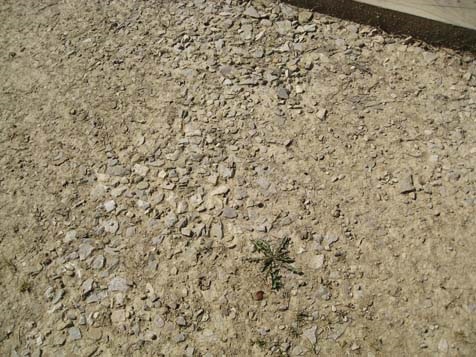
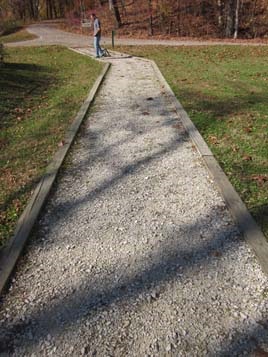
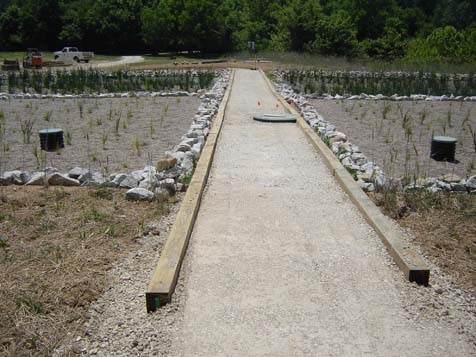
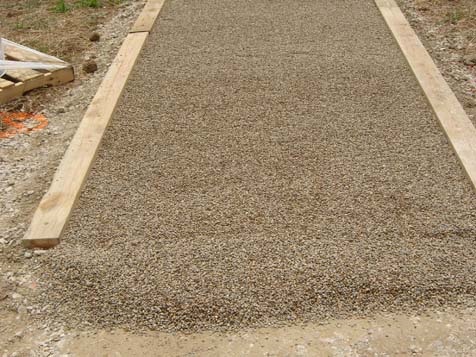
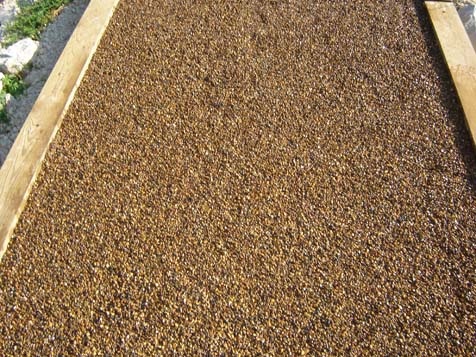
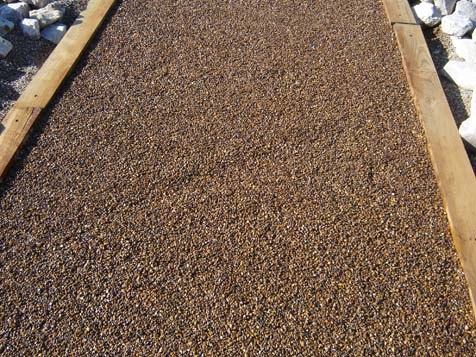
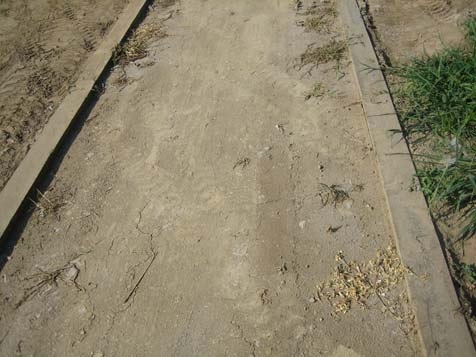
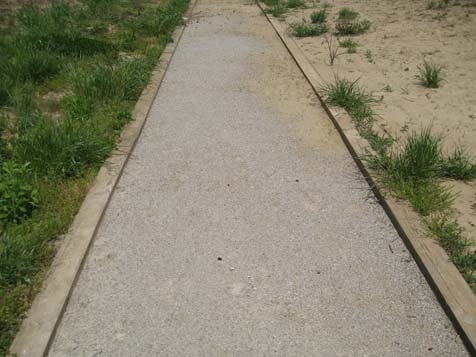
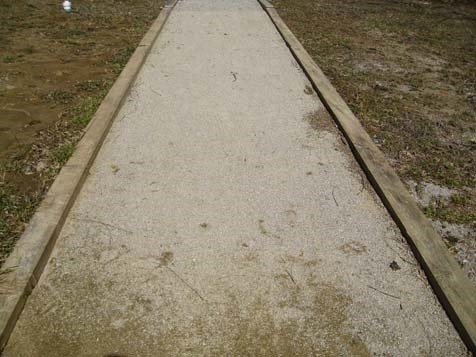
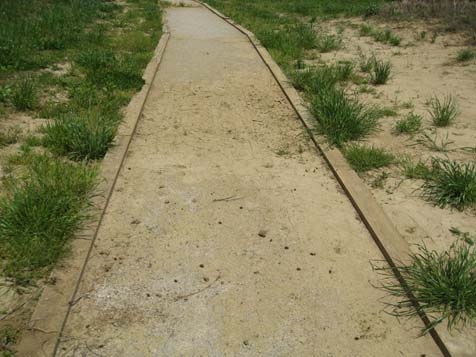
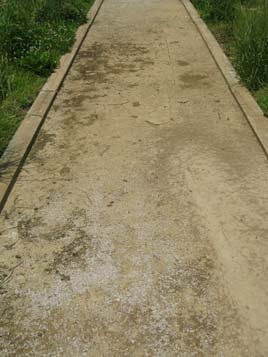
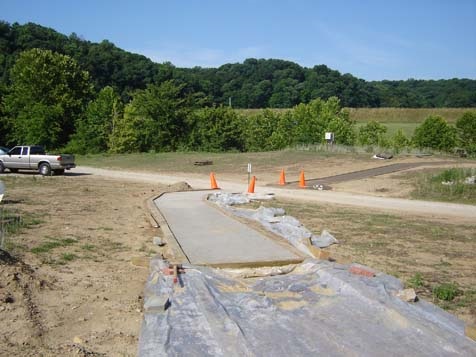
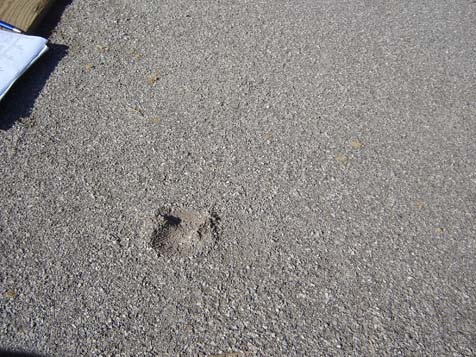
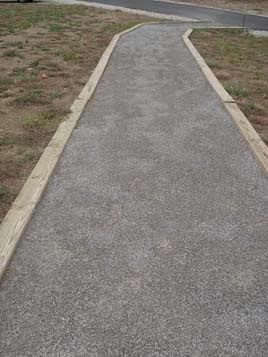
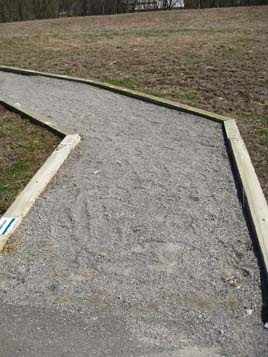
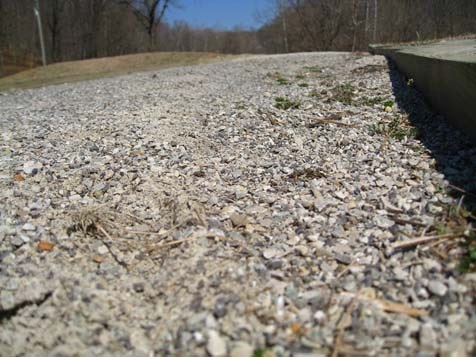
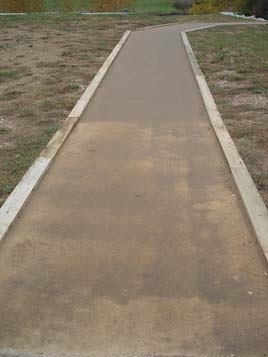
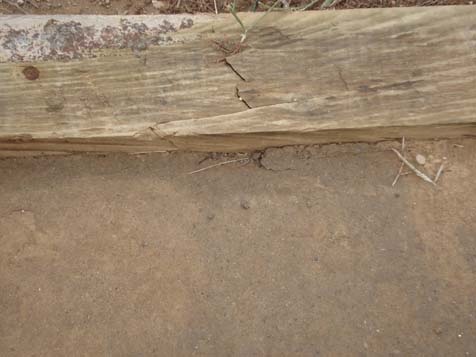
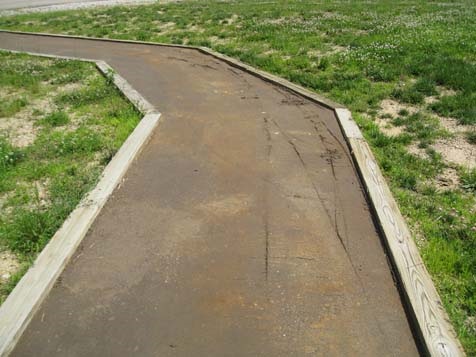
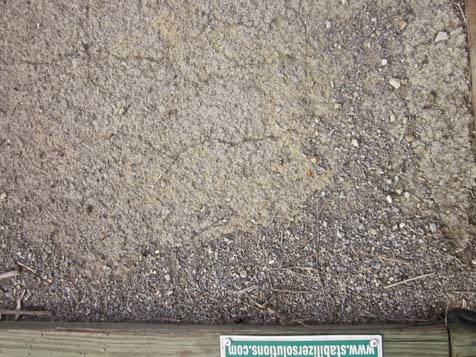
The trail segment is composed of two three inch lifts of ¾ inch minus limestone and approximately 50 percent dust. This trail segment is 5 feet wide by 200 feet long. The segment contains timber edging. This trail segment maintained itself well in dry temperatures (June – August; 100 degree temps), remaining hard and compacted under foot. After the same two days of uncharacteristically heavy rainfall (as noted in the ¼ inch minus segment), the surface had evidence of water pooling on the surface, as there were lines of pine needles but the surface remained unchanged. It was still firm under foot through the end of the testing in fall. The surface does have a prevalence of the larger fines working their way to the surface, but not affecting the way in which the surface is bound to keep it firm. It would be an item to consider when evaluating the intended use of a trail for those visitors using mobility devices and assistive devices such as crutches and canes.
Three Quarter Inch Minus Limestone trail segment is composed of two three inch lifts with 50 percent dust. August 1, 2007.
Three Quarter Inch Minus Limestone trail segment with 50 percent dust has first lift compacted. August 1, 2007.
Three Quarter Inch Minus Limestone with 50 percent dust after first lift is compacted. August 1, 2007.
Three Quarter Inch Minus Limestone trail segment has second lift installed. August 3, 2007.
Three Quarter Inch Minus Limestone trail segment has second lift compacted. August 3, 2007.
Three Quarter Inch Minus Limestone with 50 percent dust after two lifts installed and compacted. August 6, 2007.
Three Quarter Inch Minus Limestone trail segment where water pooled after rain. March 13, 2008.
Three Quarter Inch Minus Limestone trail segment where water pooled after rain. March 13, 2008.
Three Quarter Inch Minus Limestone trail segment almost one year after installation. June 12, 2008.
Three Quarter Inch Minus Limestone trail segment remained firm under foot. March 17, 2009.
Three Quarter Inch Minus Limestone trail segment showed prevalence of larger fines working their way to the surface. November 2, 2011.
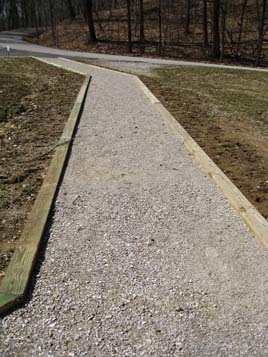
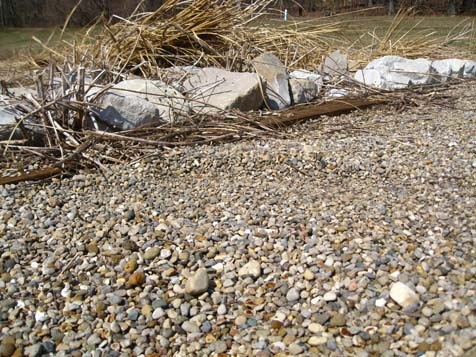
Klingstone 400
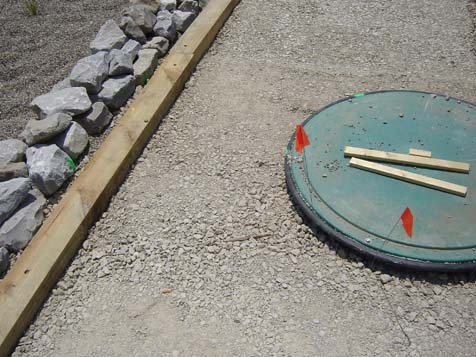
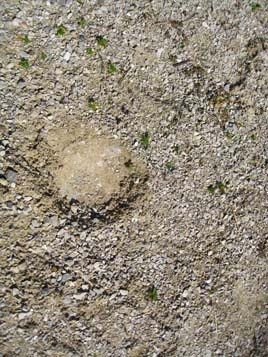
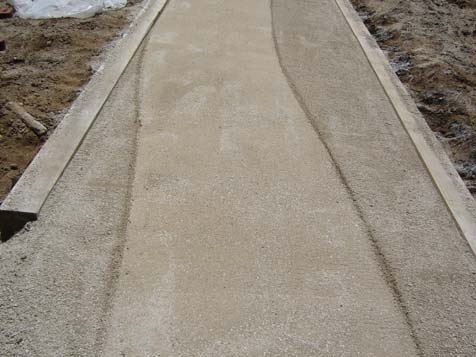
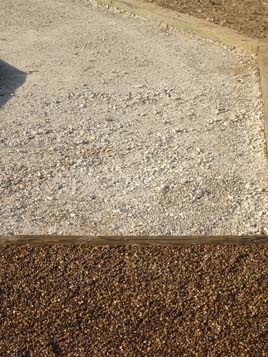
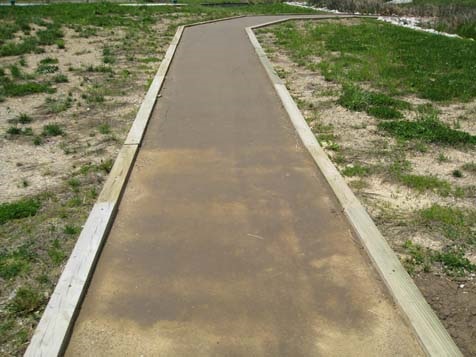
The trail segment is composed of the stabilizer, Klingstone 400 and is 5 feet wide by 104 feet long. The segment contains timber edging. The Klingstone 400 is applied to materials on top of a base, which is composed of 4 inches of ¾ inch minus limestone and dust. The top-dress is 2 inches of ¼ inch washed pea gravel (round river rock) sprayed with Klingstone 400 to seal the pea gravel. Over time, the only noticeable changes to the surface are a fading of the color (which started as an “amber”, has washed out because of sun exposure, and is blending with the surroundings) and a very small amount of loose fines coming to the surface. The surface was installed around a sewage drain and was not broken away from or deteriorated around it.
Klingstone base preparation of ¾ inch minus limestone and dust. June 13, 2007.
Klingstone base preparation of ¾ inch minus limestone and dust. June 13, 2007.
Klingstone top dress preparation of ¼ inch washed pea gravel (round river rock). June 16, 2007.
Klingstone top dress ¼ inch washed pea gravel is prepared. June 16, 2007.
Klingstone top dress ¼ inch washed pea gravel is leveled. June 16, 2007.
Klingstone trail segment is prepared for spray application. June 16, 2007.
Top dress is sprayed with Klingstone 400 to seal the pea gravel. June 16, 2007.
Klingstone 400 has been sprayed to top surface. June 16, 2007.
Klingstone 400 spray left to dry. June 16, 2007.
Klingstone trail surface more than a month after installation. August 1, 2007.
Klingstone amber color has started to fade. October 19, 2007.
Klingstone surface almost a year after installation. May 6, 2008.
Klingstone loose fines coming to surface. March 17, 2009.
Klingstone almost two years after installation has small amount of loose fines coming to surface. March 17, 2009.
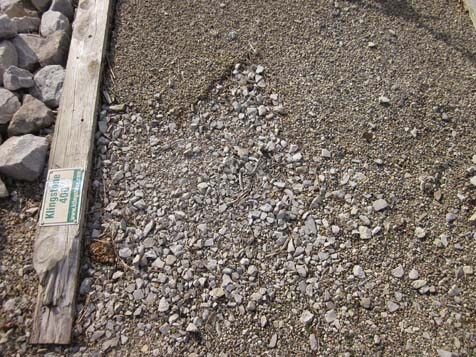
Klingstone at beginning of trail segment has started to wash out. November 22, 2011.
Klingstone at beginning of trail segment has started to wash out. November 22, 2011.
Klingstone surface has started to recede from timber edging. November 22, 2011.
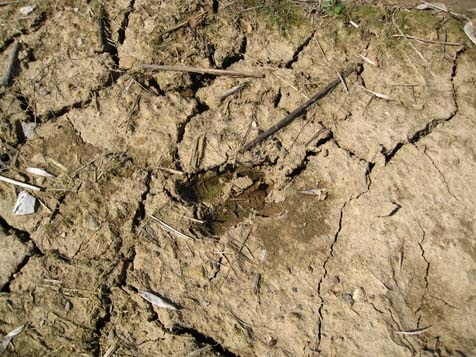
Polypavement
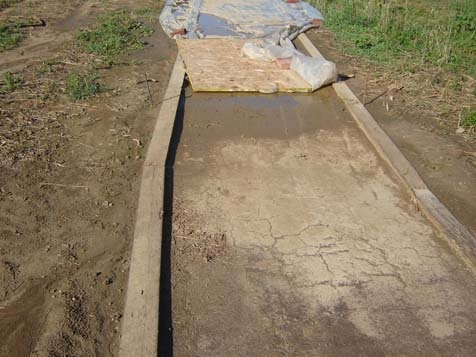
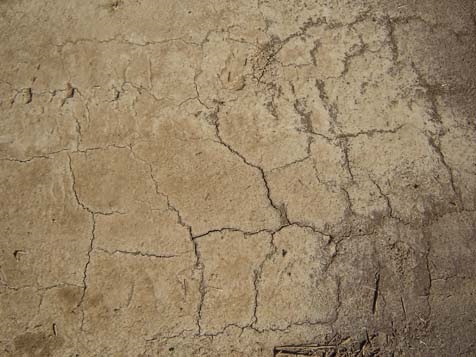
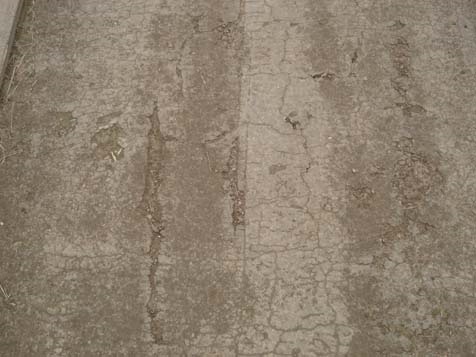
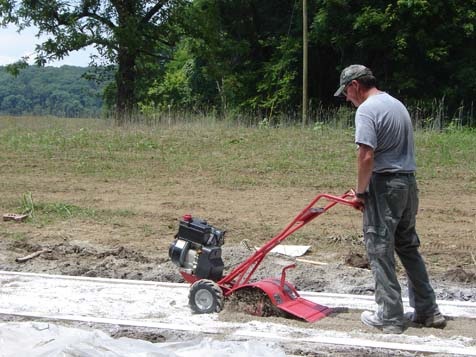
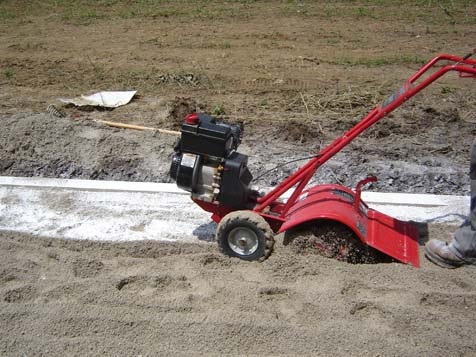
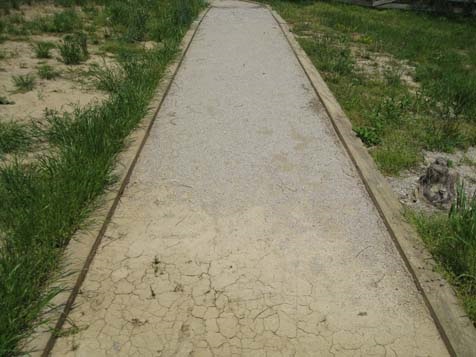
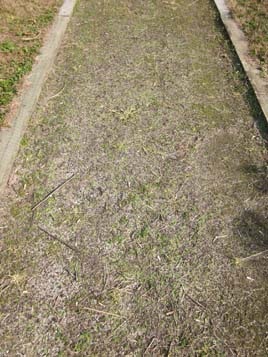
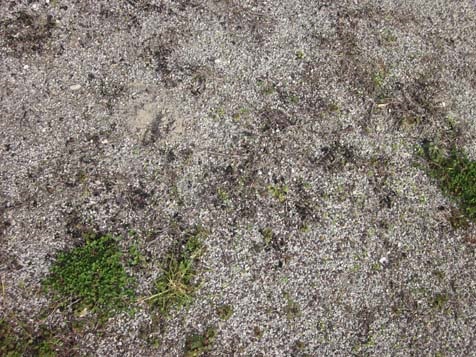
The trail segment is composed of the stabilizer, Polypavement and is 5 feet wide by 30 feet long. The segment contains timber edging. The Polypavement is applied to a base of compacted native soils and is then mixed into an additional 2 inches of tilled soil. The surface started to show signs of cracking, sinking and softening after the first round of tests when the temperature was still mild and warm (June – August; 100 degree temps). After uncharacteristically heavy rainfall, the surface became the same texture as mud. Upon drying up, the surface remained cracked and was heaving along the full width of the trail. The material just under the surface of the segment, contains cracks and heaving and stayed wet and therefore soft under foot. NCA continued to test the surface to ensure consistency in data collection, despite the initial impression that the Polypavement application was not maintaining itself. It appeared that the top layer of the surface was all that was left of the stabilizer and the remaining surface had returned to its natural soil state. The assumption is that this surface, because of its natural soil base, never got the opportunity to set up properly because it was installed in wetlands where the soil naturally maintains more moisture.
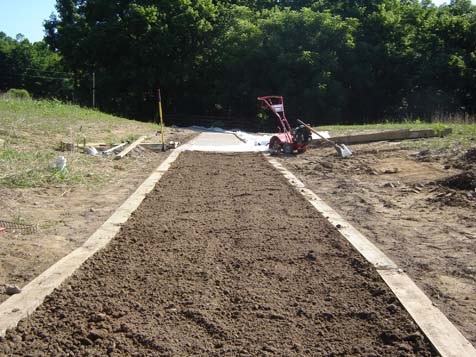
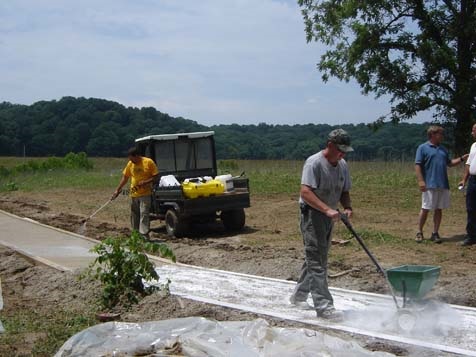
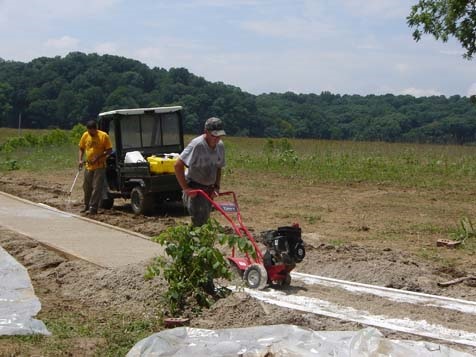
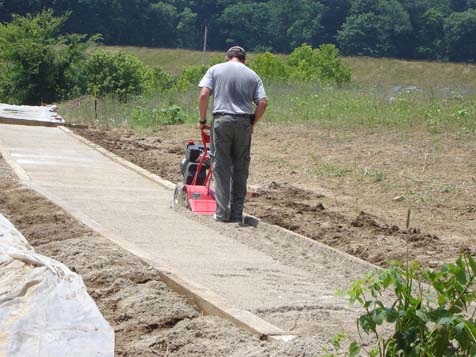
Polypavement is applied to a base of compacted native soils and mixed into an additional 2 inches of tilled soil. July 3, 2007.
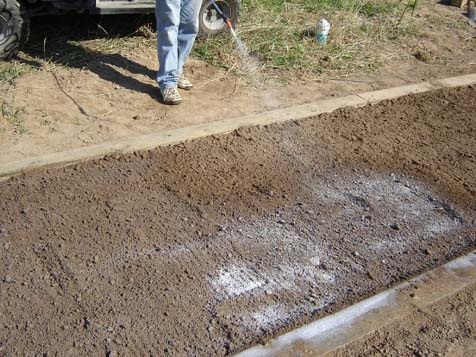
Polypavement is applied to a base of compacted native soils and mixed into an additional 2 inches of tilled soil. July 3, 2007.
Polypavement trail segment started to show signs of cracking and softening after the first round of tests. July 6, 2007.
Polypavement trail segment started to show signs of cracking and softening after the first round of tests. July 6, 2007.
Polypavement trail segment shows cracking. July 6, 2007.
Polypavement trail segment after heavy rains remained cracked. August 9, 2007.
Polypavement trail segment with cracks and heaving along width of trail. October 19, 2007.
Polypavement trail segment would dry with cracks and heaving after heavy rail. March 13, 2008.
Polypavement trail segment would remain soft underfoot. March 13, 2008.
Polypavement trail segment shows cracks. May 6, 2008.
Polypavement trail segment a year after installation shows top layer is all that is left of the stabilizer. June 12, 2008.
Polypavement trail segment almost two years after installation shows top layer of stabilizer and remaining surface returned to its natural soil base. March 17, 2009.
Polypavement trail segment may not have set up properly due to the moist soil of the wetlands. March 17, 2009.
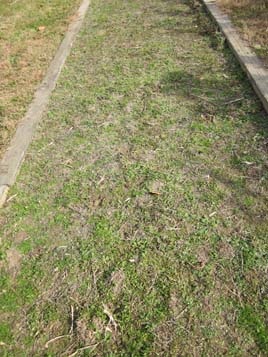
Polypavement trail segment overgrown with vegetation. November 2, 2011.
Soiltac Liquid Mix-In
The trail segment is composed of the stabilizer, Soiltac Liquid Mix-in and is 5 feet wide by 30 feet long. The segment contains timber edging. The Soiltac Liquid Mix-in is applied to a base of 2 inches of native soil. Soiltac Liquid Mix-in is then tilled into 4 inches of ¼ inch minus loose limestone aggregate. The surface is compacted and then sprayed to seal. The stabilizer has a penetration depth of 4 inches. After the first heavy rainfall, the surface seemed to maintain itself well. It was only slightly soft under foot, showing footprint indentations, but seemed to firm back up. There were no noticeable drainage issues for this surface. This segment performed better than its topical application counterpart (see the note in the liquid topical application).
Soiltac Liquid Mix-In is applied to a base of 2 inches of native soil. June 27, 2007.
Soiltac Liquid Mix-In is then tilled into 4 inches of ¼ inch minus loose limestone aggregate. June 27, 2007.
Soiltac Liquid Mix-In is then tilled into 4 inches of ¼ inch minus loose limestone aggregate. June 27, 2007.
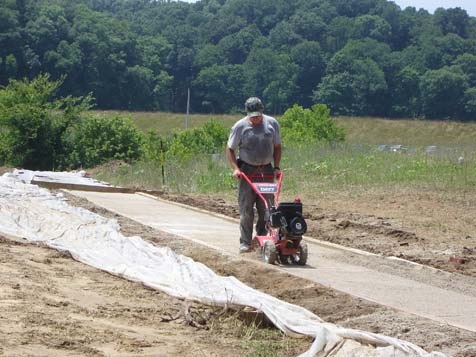
Photo 58 Soiltac Liquid Mix-In surface is tilled. June 27, 2007.
Soiltac Liquid Mix-In trail segment is leveled. June 27, 2007.
Soiltac Liquid Mix-In trail segment is prepared. June 27, 2007.
Soiltac Liquid Mix-In trail segment is compacted. June 27, 2007.
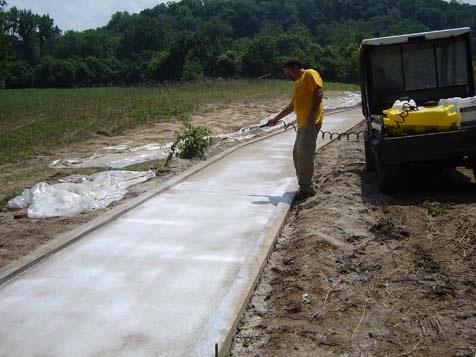
Soiltac Liquid Mix-In trail segment is sprayed to seal with a penetration of 4 inches. June 27, 2007.
Soiltac Liquid Mix-In trail segment seemed to maintain itself well. March 13, 2008.
Soiltac Liquid Mix-In trail segment was only slightly soft under foot, showing footprint indentations. March 13, 2008.
Soiltac Liquid Mix-In more than one year after installation seemed to maintain itself. June 12, 2008.
Soiltac Liquid Mix-In almost two years after installation. March 17, 2009.
Soiltac Liquid Mix-In segment performed better than its topical application counterpart. March 17, 2009
Soiltac Liquid Mix-In performed better than its topical application counterpart. November 2, 2011.
Soiltac Liquid Topical
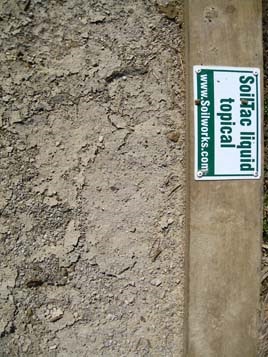
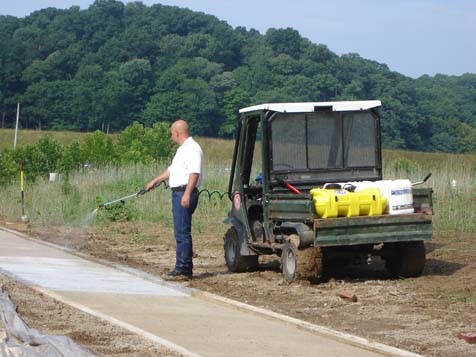
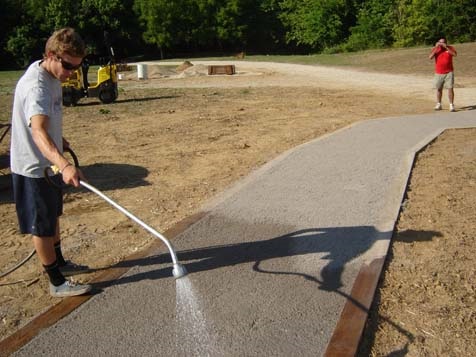
The trail segment is composed of the stabilizer, Soiltac Liquid Topical, and is 5 feet wide by 30 feet long. The segment contains timber edging. The Soiltac Liquid Topical is applied to a base of 2 inches of native soil. Soiltac Liquid Topical is mixed with water and sprayed onto 4 inches of ¼ inch minus compacted limestone aggregate. The stabilizer has a penetration depth of 1/8 inch. The first noticeable signs of change for this surface came after the first heavy rainfall at the March 2008 testing. The surface showed signs of runoff and became soft under foot (footprints were evident). The surface remained soft under foot through the final testing, but some areas even more so than other areas where the water had pooled and the surface had not firmed back up. Upon the advice of the stabilizer company, topical applications should not be utilized to stabilize trail surfaces, but are to be utilized when dust control and erosion is necessary. It can be applied to mix-in stabilizers during the installation and during maintenance to help achieve a more firm and stable surface.
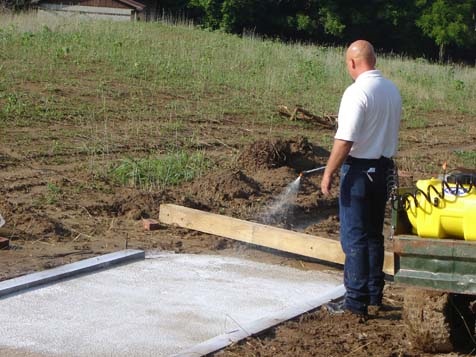
Soiltac Liquid Topical is applied to a base of 2 inch native soil, mixed with water and sprayed onto 4 inches of ¼ minus compacted limestone aggregate. June 27, 2007.
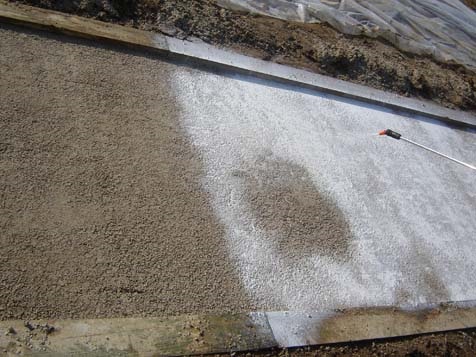
Soiltac Liquid Topical has a penetration depth of 1/8 inch. June 27, 2007.
Soiltac Liquid Topical trail segment showed change after a heavy rainfall. March 13, 2008.
Soiltac Liquid Topical trail segment became soft under foot. March 13, 2008.
Soiltac Liquid Topical trail segment showed signs of runoff. March 13, 2008.
Soiltac Liquid Topical trail segment remained soft where water had pooled. May 6, 2008.
Soiltac Liquid Topical trail segment remained soft where water had pooled. March 17, 2009.
Soiltac Liquid Topical trail segment showed footprints. March 17, 2009.
Soiltac Liquid Topical trail segment showed runoff. March 17, 2009.
Soiltac Liquid Topical trail segment remained soft through the final testing. November 2, 2011.
Soiltac Liquid Topical trail segment remained soft through the final testing. November 2, 2011.
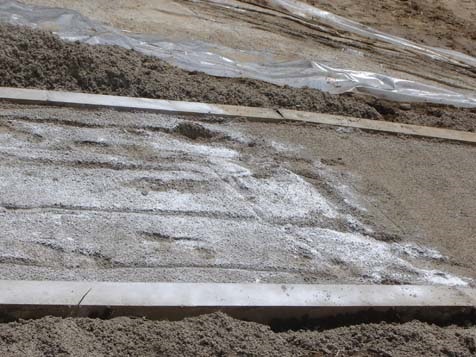
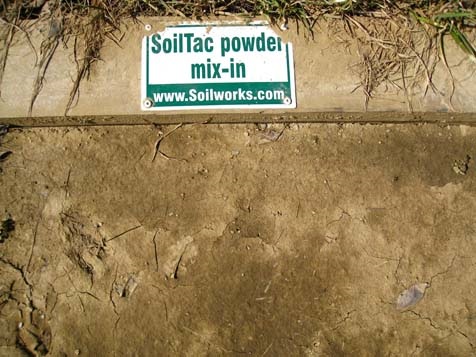
Soiltac Powder Mix-In
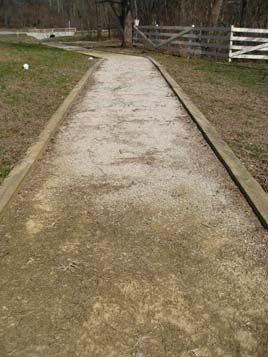
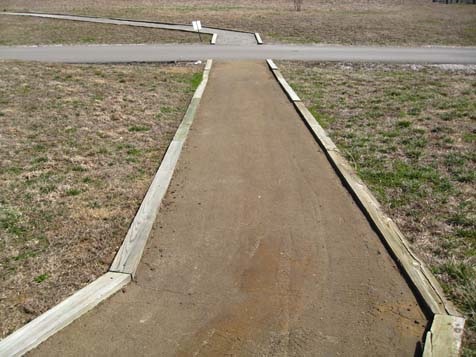
The trail segment is composed of the stabilizer, Soiltac Powder Mix-in, and is 5 feet wide by 30 feet long. The segment contains timber edging. The Soiltac Powder Mix-in is applied to a base of 2 inches of native soil. Soiltac Powder Mix-in is applied to the surface with a spreader, tilled, smoothed, and then compacted. It is then sprayed to seal the surface. The stabilizer has a penetration depth of 4 inches. This trail segment maintained itself through to the last date of testing, with only minor evidence of the surface softening, but always becoming firm again. There was no constructed drainage mechanisms that would be considered appropriate in the trail construction industry for this surface, therefore the water runoff from the adjacent earth mound flowed directly across this segment. Where there was water flow crossing the segment, the surface was soft under foot but returned to a natural surface state.
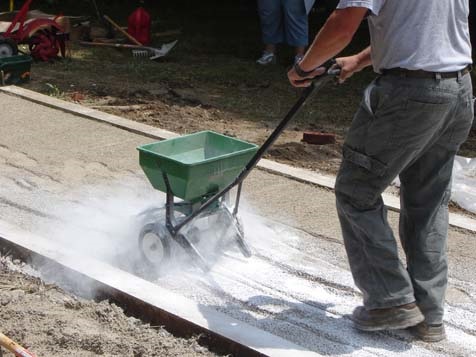
Soiltac Powder Mix-In is applied to a base of 2 inches of native soil. June 27, 2007
Soiltac Powder Mix-In is applied to a base of 2 inches of native soil. June 27, 2007.
Soiltac Powder Mix-In is tilled into the 2 inch base of native soil. June 27, 2007.
Soiltac Powder Mix-In has a penetration depth of 4 inches. June 27, 2007.
Soiltac Powder Mix-In is smoothed and compacted. June 27, 2007.

Soiltac Powder Mix-In is sprayed to seal the surface. June 27, 2007.
Soiltac Powder Mix-In almost a year after installation. March 13, 2008.
Soiltac Powder Mix-In trail segment maintained its condition a year after installation. March 13, 2008.
Soiltac Powder Mix-In softened surface would become firm again. May 6, 2008.
Soiltac Powder Mix-In almost two years after installation. March 17, 2009.
Soiltac Powder Mix-In does not have a constructed drainage mechanism considered appropriate for trail construction. March 17, 2009.
Soiltac Powder Mix-In showed only minor evidence of softening at the end of the study. November 2, 2011.
Soiltac Powder Mix-In trail segment with water crossing would soften and then return to natural surface state. November 2, 2011.
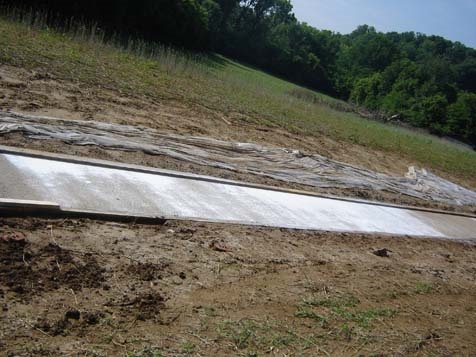
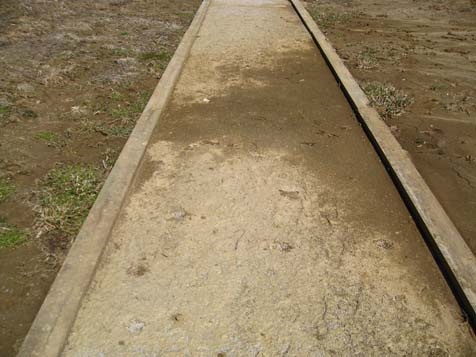
Soiltac Powder Topical
The trail segment is composed of the stabilizer, Soiltac Powder Topical, and is 5 feet wide by 30 feet long. The segment contains timber edging. The Soiltac Powder Topical is applied to a base of 2 inches of native soil. Soiltac Powder Topical is mixed with water and sprayed onto 4 inches of ¼ inch minus compacted limestone aggregate. The stabilizer has a penetration depth of 1/8 inch. As with the other three Soiltac surface applications, the first signs of change for this surface came after the first heavy rainfall at the March 2008 testing. After the rain, the stabilizer formed a solid paper-thin elastic layer on top of the surface. It should be noted that runoff was a problem onto this surface from the adjacent earth mound that was not controlled by constructed drainage. The surface was soft under foot and showed footprints. Like the other Soiltac Topical application, this segment never seemed to firm up. The same guidance is recommended for the Soiltac Powder Topical application as the Soiltac Liquid Topical application. Upon the advice of the stabilizer company, topical applications should not be utilized to stabilize trail surfaces, but are to be utilized when dust control and erosion is necessary. It can be applied to mix-in stabilizers during the installation and during maintenance to help achieve a more firm and stable surface.
Soiltac Powder Topical is applied to a base of 2 inches of native soil and 4 inches of ¼ inch minus compacted limestone aggregate. June 27, 2007.
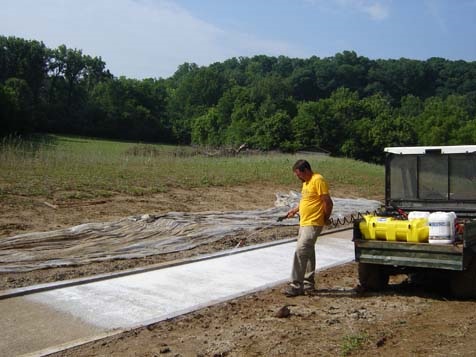
Soiltac Powder Topical is applied to a base of 2 inches of native soil and 4 inches of ¼ inch minus compacted limestone aggregate. June 27, 2007.
Soiltac Powder Topical has a penetration of 1/8 inch. June 27, 2007.
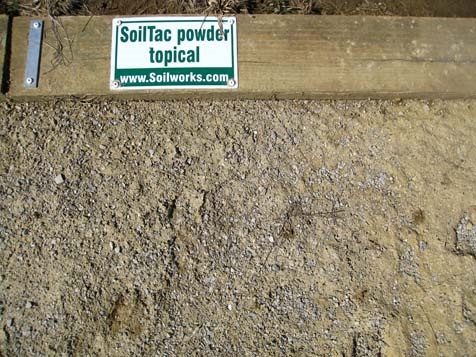
Soiltac Powder Topical has formed a solid paper-thin layer after a heavy rainfall. March 13, 2008.
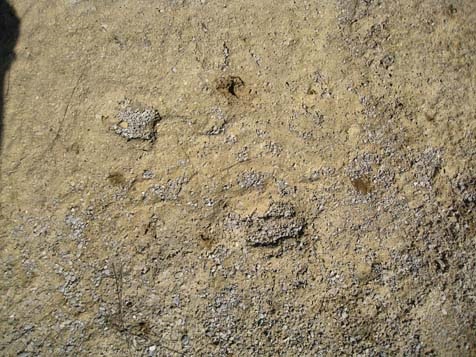
Soiltac Powder Topical was soft under foot and showed footprints. March 13, 2008.
Soiltac Powder Topical with runoff from adjacent landscape. March 13, 2008.
Soiltac Powder Topical almost a year after installation. May 6, 2008.
Soiltac Powder Topical one year after installation. June 12, 2008.
Soiltac Powder Topical almost two years after installation. March 17, 2009.
Soiltac Powder Topical more than four years after installation. November 2, 2011.
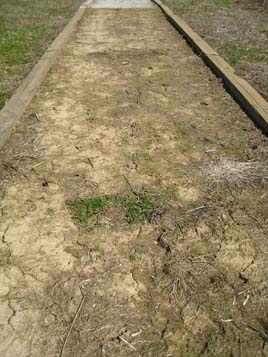
Stabilizer
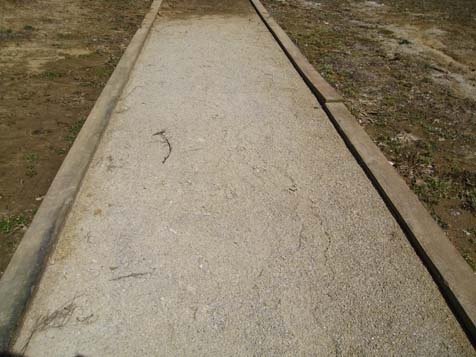
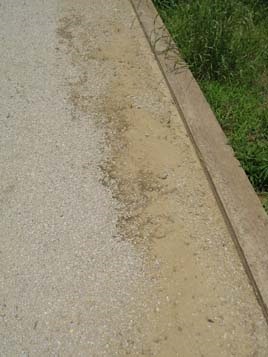
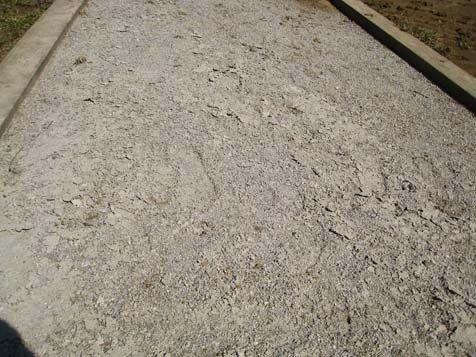
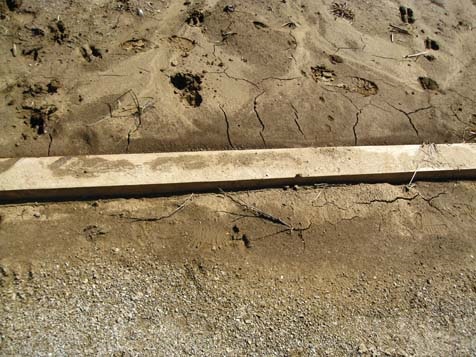
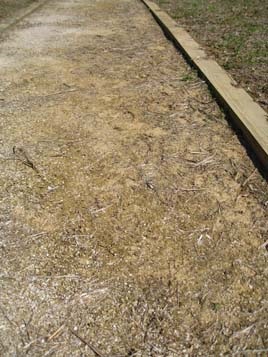
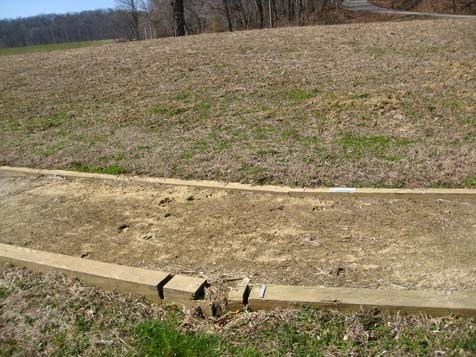
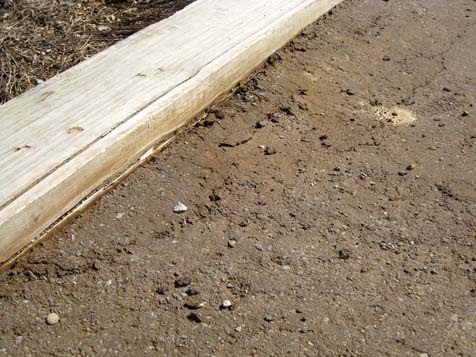
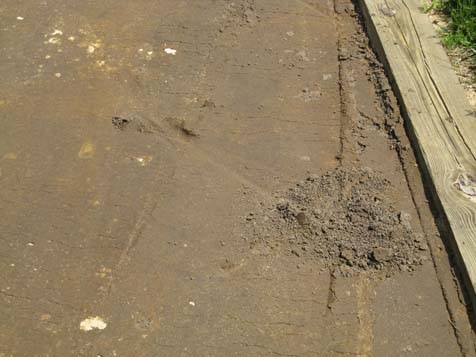
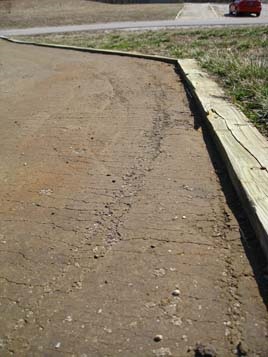
The trail segment is composed of the stabilizer, Stabilizer, and is 5 feet wide by 50 feet long. The segment contains timber edging. The Stabilizer is applied to a base of 3 inches of compacted native soils. Stabilizer arrives pre-mixed with ¼ inch minus aggregate and is applied at a 3-inch depth on top of the base. The surface maintained itself for the most part through the first round of testing after installation (June – August; 100 degree temps) with the exception of loose fines that appeared on the surface. After the heavy rainfall, the surface had runoff composed of the loose fines from the trail segment. It was not until the testing conducted in March 2008 that the surface showed large signs of deterioration. There were gullies created in the surface because of runoff; these were found both down the middle of the trail segment and along the timber edging. The surface would need maintenance to return it to its original state.
Stabilizer is applied to a base of 3 inches of compacted native soil. June 19, 2007.
Stabilizer arrives pre-mixed with ¼ inch minus aggregate. June 19, 2007.
Stabilizer is applied at a 3 inch depth on top of the base. June 21, 2007.
Stabilizer trail segment is leveled at installation. June 21, 2007.
Stabilizer trail segment is prepared. June 21, 2007.
Stabilizer trail segment is prepared. June 21, 2007.
Stabilizer trail segment installation. July 3, 2007.
Stabilizer surface shows an indentation from the surface testing. July 6, 2007.
Stabilizer trail segment shows loose fines at top of surface. July 6, 2007.
Stabilizer trail segment shows loose fines at top of surface. October 19, 2007.
Stabilizer trail segment shows loose fines at top of surface. October 19, 2007.
Stabilizer trail segment has runoff from heavy rainfall. March 13, 2008.
Stabilizer trail segment shows loose fines from heavy rainfall. March 13, 2008.
Stabilizer trail segment shows indentation from surface testing. March 13, 2008.
Stabilizer trail segment more than a year after installation. May 6, 2008.
Stabilizer trail segment almost two years after installation. March 17, 2009.
Stabilizer trail segment shows gullies created in surface from runoff. March 17, 2009.
Stabilizer trail segment shows deterioration from runoff along timber edging. March 17, 2009.
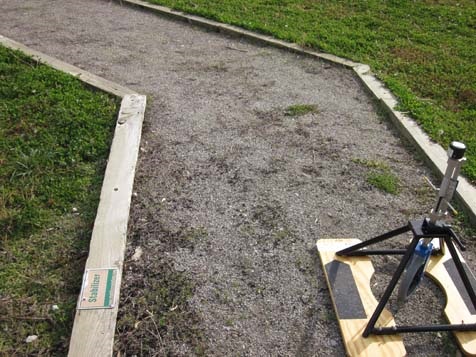
Stabilizer trail segment shows deterioration. November 2, 2011.
Stabilizer trail segment shows deterioration in middle of the trail. November 2, 2011.
Stabilizer trail segment shows deterioration along timber edging. November 2, 2011.
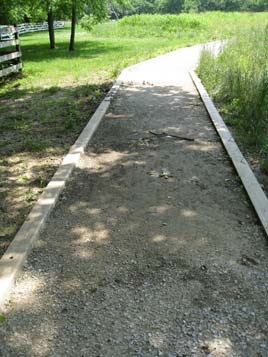
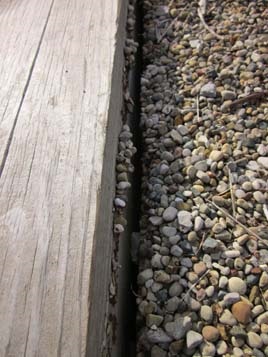
StaLok
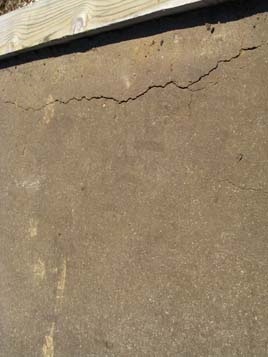
The trail segment is composed of the stabilizer, StaLok, and is 5 feet wide by 72 feet long. The segment contains timber edging. The StaLok is applied to a base of 3 inches of compacted native soils. StaLok arrives pre‐mixed with ¼ inch minus aggregate and is applied at a 2-inch depth on top of the base. The surface maintained itself through the first round of testing (June – August; 100 degree temps). During the testing performed in August 2007, it was noted that an individual had walked on the surface at the Wetlands dedication and left marks in the surface of a depth of approximately ½ inch. Upon returning a couple months later, not for testing, it was noted that the surface had repaired itself. The surface also had the pattern of behaving this way when maintenance vehicles rode over it as well. After the heavy rainfall, the only noticeable factor was pooling of the water on the lower points of the surface; StaLok is impervious so it repels the water. The surface remained firm and stable. The other noticeable effects of the surface noted during the March 2008 testing were cracking approximately 6 inches from the timber edging.
StaLok arrives pre-mixed with ¼ inch minus aggregate. June 21, 2007.
StaLok is applied to a base of 3 inches of compacted native soil. June 21, 2007.
StaLok is applied at a 2 inch depth on top of the base. June 21, 2007.
StaLok is applied at a 2 inch depth on top of the base. June 21, 2007.
StaLok surface is compacted. June 21, 2007.
95 StaLok surface is compacted. June 21, 2007.
StaLok trail segment maintained itself through first round of testing. October 19, 2007.
StaLok trail surface had a pattern of wear and repairing itself. March 13, 2008.
StaLok trail segment was noted for repairing itself. March 13, 2008.
StaLok trail segment was noted for showing indentations and then repairing itself. May 6, 2008.
StaLok trail segment with wheelchair marks would repair itself. June 12, 2008.
StaLok trail segment with wheelchair marks would repair itself. June 12, 2008.
StaLok trail segment previously shown with marks had repaired itself. March 17, 2009.
StaLok trail segment previously shown with marks had repaired itself. March 17, 2009.
StaLok trail segment shows cracking next to timber edging. November 2, 2011.
StaLok trail segment had some pooling of water at lower points of the surface. November 2, 2011.
StaLok trail segment with pooling of water. November 2, 2011.
StaLok trail segment maintained itself through first round of testing. October 19, 2007.
Photos were also collected at various points in the 51 months, always at testing and occasionally through the length of the study when major weather and/or events happened. Included in Appendix D are photos of some of the significant changes to the surfaces mentioned above and some additional photos to offer a different glimpse of the surfaces.
Summary of Results
The qualitative and quantitative data show that the trail segments constructed of ¾ inch minus limestone aggregate, Klingstone 400 soil stabilizer, and StaLok stabilizer maintained a more consistently firm and stable surface than the other trail segment surface materials. The implications of these preliminary data are that a trail composed of an all-aggregate material, when constructed to the above-mentioned parameters, could be maintained with little to no maintenance as a firm and stable surface. The intent of the study was to discover a natural surface trail material that utilized a soil stabilizer or aggregate material. However, recommendations for future study call for a cost comparison of aggregate versus soil stabilizer trail surface materials, therefore depending on the results of future research, the best alternative to a concrete, asphalt or boardwalk surface, could be an aggregate surface trail because of the lower cost of aggregate.
Recommendations for Future Research
The evaluation of the 11 trail surface materials in this study has provided valuable information in regards to soil stabilizers and natural aggregate trails installed in the Midwest region. Research of this kind did not exist until the formulation of this study. The information obtained from this study can serve as a point of reference for other entities in the Midwest region that will be installing natural surface trails on areas with low volume of traffic.
Environmental factors such as rain, frost, and thaw conditions, shaded versus sunny trail segments, soil composition, and natural drainage play a critical role in the firmness and stability of a trail surface. Utilizing the data collected from this study to compare to installations of the same materials in other regions of the country are necessary.
The data collected for each trail segment denotes that all of the trail surfaces meet some varying degree of firmness and stability; further research should be conducted using human test subjects to determine the accuracy of the degrees of firmness and stability. A larger sample of individuals with disabilities who use a variety of different mobility devices (manual and power wheelchairs, walkers, crutches, etc.) should be tested on these surfaces.
A cost comparison of natural aggregate trail surfaces and trail surfaces that are composed of soil stabilizers should be conducted. This cost comparison should involve the cost of the product, the cost of any additional aggregate necessary for stabilizer mix and/or the trail base, the equipment and labor costs associated with the installation, and the maintenance costs associated with ensuring the surface maintains itself as a firm and stable surface. The long-term maintenance costs for different surfaces could drive the purchasing decision and have greater influence with decision makers if more research data on this question were available to trail managers.
User Comments/Questions
Add Comment/Question