National Trail Surface Study
Final Report
February 2014

Staff Liaison
Bill Botten
U.S. Access Board
1331 F Street, NW, Suite 1000
Washington, DC 20004-1111
(202) 272-0080 (Voice)
(202) 272-0082 (TTY)
www.access-board.gov

Project Team
Nicole Montembeault, Principal Investigator
Dr. Sherril York, Executive Director
National Center on Accessibility
501 N Morton St, Suite 109
Bloomington, IN 47404-3732
(812) 856-4422 (Voice)
(812) 856-4421 (TTY)
www.ncaonline.org


Acknowledgements
The National Trail Surfaces Study has taken a number of turns over the past several years. For their assistance in the original longitudinal study of surfaces, we wish to thank the stabilizer companies that contributed the materials for installation at Bradford Woods, and the staff at Bradford Woods for allowing the test surfaces to be installed and for providing maintenance records. We also thank the trail managers across the country participated in the online survey of trail surfaces. Without the commitment to the inclusion of people with disabilities and the burning desire to have the research questions answered, this study in its many forms would not have been possible.
Abstract
Trails provide opportunities for people to connect with the natural environment in a variety of settings and are places for all individuals, including people with disabilities. Individuals with disabilities have the same desire to explore nature and physical barriers such as inaccessible surfaces and routes can hamper or even prevent opportunities to participate in the outdoor leisure experience for people with a disability. The purpose of the longitudinal surface study was to evaluate a variety of trail surface materials, and their ability to meet proposed accessibility requirements of firmness and stability from initial installation and maintenance over 51 months.
The research questions included:
-
Does each of the 11 trail surface materials meet or exceed the classifications for firmness and stability as proposed by the US Access Board in their 2007 Notice of Proposed Rulemaking for Outdoor Developed Areas?
-
When evaluating the firmness and stability of each of the 11 trail surface materials, how does each of the 11 trail surface materials compare to themselves over a 51 month time period?
-
When evaluating the firmness and stability of each of the 11 trail surface materials, how does each surface compare to each of the other surfaces over a 51 month time period?
Results from the longitudinal study of trail surfaces included 11 different surface materials installed at Bradford Woods a unit of Indiana University and located in Martinsville, IN. All surface materials displayed varying issue(s) over time that may influence the materials performance and therefore the need for possible frequent maintenance. The implications of quantitative and qualitative data are that a trail composed of an all-aggregate material, when constructed to specified parameters, could be maintained with little to no maintenance as a firm and stable surface.
In addition to the longitudinal surface study, an electronic survey was conducted of trail managers throughout the United States. The purpose of the trails surface survey was to provide qualified professionals, resource specialists and operations staff of parks and other recreational properties with trails in the United States with descriptive and/or comparative information about the status of construction practices of pedestrian/hiker, natural surface trails in the United States. Despite a sixty-one percent survey access rate of survey invitees, the overall completion rate was extremely low. Therefore, the results can be addressed in terms of a general trend in types of surface materials used. The majority of trail surfaces were natural materials that did not use soil stabilizers. However, information on construction practices and maintenance issues was limited in the responses received.
Overview
In 2007 the National Center on Accessibility (NCA) entered into an agreement with the U.S. Access Board and National Park Service to investigate natural firm and stable surface alternatives when creating accessible pedestrian trails, including crushed stones, packed soil, and other natural material. In some cases, natural materials may be bonded with synthetic materials to provide durable firm and stable trail surfaces. The original scope of work for this research project involved a longitudinal study that would examine the influence of five key variables: hydrology, climate, soil condition, grade and cross slope on the accessibility of trail surfaces. The project would involve the installation of 5‒7 different test surfaces in various regions of the country with periodic testing and evaluation of those surfaces by local trained operators. Test plots of eleven different surface materials were installed at Bradford Woods in Martinsville Indiana.
A number of contributing circumstances contributed to the need for a change in the scope of work for this project. When the economic down turn occurred beginning in 2008, entities that had agreed to participate as test sites were forced to withdraw. In addition, stabilizer companies that agreed to provide the applications for the different surface materials for the test plots were unable to provide the labor for installation to the proposed test sites. As a result, only the original test plots installed at Bradford Woods were available for longitudinal testing. In consultation with and with agreement of the Access Board in September 2009, NCA modified the objective of the trail surface study. The experimental trail sections already under testing at Bradford Woods would continue to be tested and data were recorded over 51 months. However, instead of installing and testing new trail plots at selected sites around the country, NCA would actively seek out sites that had stabilizer products already applied and currently being used on natural surface pedestrian trails. Repeated requests were made of stabilizer product companies for trail locations, but few responses were received. Most locations identified did not qualify as pedestrian trails under the definition in the Draft Final Accessibility Guidelines for Outdoor Developed Areas issued by the US Access Board in 2009. Therefore, in January 2010, the National Center on Accessibility issued an interim report on the National Trails Surface Study, which included only the data collected at Bradford Woods up until that date.
Modification to the Scope of Work – Electronic Survey
After filing the January 2010 interim report, investigators at the National Center on Accessibility pursued various research designs and methodologies to properly answer several research questions. As a result of discussions with the U.S. Access Board and the National Park Service, the National Center on Accessibility modified the experimental design of the project. In addition to the continuation of the longitudinal surface testing protocol at Bradford Woods, a new research methodology was designed to provide a pilot test of the methodology and a survey instrument to address some of the research questions from the original study.
Research questions that were to be addressed in this survey included:
1. Geographic, demographic, and political information: type of management agency, park location,trail name, age of trail, length and width of trail, traffic on trail, and similar data
2. Surface product information: product name, manufacturer, initial cost of installation
3. Decisions related to trail: vendor access and information pattern, installation contractor, warranties and guarantees
4. Pre-installation specifications: soil type and composition, surrounding ecosystem, slope and grade of surface
5. Sub-base installation: date of installation, aggregate type, aggregate depth, cost of sub-base, manufacturer, contactor or staff completing installation, time duration for installation, cost of labor for installation
6. Product installation: date of installation, surface product, manufacturer, contactor or staff completing installation, time duration for installation, cost of labor for installation
7. Maintenance: reports of initial repair by type and cost, reports of on-going and continuing repair by type and cost, ease of repair, staff/personnel required to perform repairs and maintenance, cost of labor to perform repair, cost of material to perform repair
8. Product issues: quality of instructions from manufacturer and/or vendor, surface characteristics over time (i.e. uneven wear, settling, cracking, buckling, ruts)
Oklahoma State University was contracted to conduct a survey of professionals in parks and recreation who manage trails designed, developed, and maintained with the natural surface materials or applicable bonded synthetic materials. The survey was administered in the fall of 2011 through the summer of 2012.
This report provides the results of the longitudinal study of the firmness and stability of trail surface materials located at Bradford Woods, at Indiana University. It also provides the national survey results of trail managers administered by Oklahoma State University on the types and characteristics of trail surfaces currently being used around the country.
Background
There are an estimated 56.7 million people with disabilities in the United States (U.S. Census Bureau, 2010). Approximately one in five individuals have some type of functional limitation that substantially limits one or more major life activities.
Growing public awareness of the barriers to persons with disabilities has led to several pieces of federal legislation that have an effect on the design of recreation facilities. Chief among these are the Architectural Barriers Act of 1968 (PL 90‒480), Section 504 of the Rehabilitation Act of 1973 (PL 93‒112), and the Americans with Disabilities Act of 1990 (PL 101‒336), as amended by PL 110‒325 (September 25, 2008).
In order for people with disabilities to benefit on the same level as people without disabilities, leisure and recreation services must be inclusive and accessible (Stumbo, Wang & Pegg, 2011). Recreation opportunities give people with and without disabilities the opportunity to increase their quality of life and to benefit from and contribute to their own health and wellness (National Center on Accessibility, 2008).
The World Health Organization (2011) refers to disability as “the negative aspects of the interaction between individuals with a health condition…and personal and environmental factors…”(p. 7). One of the disabling barriers is a lack of accessibility in not only the built environment, but also the natural environment in which many leisure and recreation experiences take place.
Health data for people with disabilities, DATA2010, measures health at the population level (Centers for Disease Control and Prevention, 2010). While these data highlight improvements in health over the previous decade, they clearly reveal specific health disparities for people with disabilities. Compared with people without disabilities, people with disabilities are, among other things, more likely to:
-
Not engage in fitness activities
-
Be overweight or obese
-
Have high blood pressure
-
Experience symptoms of psychological distress
-
Receive less social-emotional support, (Healthy People 2020)
The U.S. Access Board is the federal agency responsible for producing guidelines for creating accessible environments. On June 20, 2007, the Access Board issued a Notice of Proposed Rulemaking (NPRM) for Accessibility Guidelines for Outdoor Developed Areas (U.S. Access Board, 2007) covered under the Architectural Barriers Act (ABA). On October 19, 2009, the Access Board issued the revised version of these guidelines, titled Draft Final Accessibility Guidelines for Outdoor Developed Areas. Upon completion of the US Access Board’s rulemaking process and adoption by the Department of Justice, all new construction or alteration projects being built on Federal Lands will be required to comply with the Outdoor Developed Areas guidelines. Following the adoption of these guidelines at the federal level, they will then become enforceable for those entities covered under the Americans with Disabilities Act (ADA). These entities include private, state, and local entities. The Draft Final Guidelines for Outdoor Developed Areas includes accessibility requirements for camping facilities, beach access routes, viewing areas, picnic facilities and trails.
As a result of the U.S. Access Board's Draft Final Accessibility Guidelines for Outdoor Developed Areas, entities are utilizing the document as a best practice until adoption and accessible trails are now a facet of recreation that is to be made accessible to the maximum extent feasible (U.S. Access Board, 2009). This is an important progression as trails serve a wide variety of functions, including expanding transportation routes, offering recreational opportunities, and protecting sensitive environments by focusing traffic on a suitable tread (Marion & Leung, 1996).
The impetus for the National Trails Surface study was to investigate alternatives to the typical firm and stable surface materials of asphalt, concrete, or boardwalk. It is a common misconception that in order to make a trail surface firm and stable, it needs to be paved. Professionals have found that using soil stabilizers, or natural aggregates, can be effective alternatives to creating a trail surface that meets accessibility guidelines (Boone, 2008).
An individual's mental, physical, and emotional well-being is positively affected by the action of hiking on trails. Factors such as being in nature, participating in a physical challenge, socializing with others in an inclusive recreational environment all contribute to an increased well-being. The desire to enjoy this type of outdoor recreational experience is equal amongst individuals with and without disabilities. Research shows that recreating is a necessary action when looking at increasing an individual's overall well-being. The technical provisions of the Draft Final Accessibility Guidelines for Outdoor Developed Areas (U.S. Access Board, 2009) for trails requires a trail surface that is firm and stable. The guidelines are currently being applied as a best practice set of guidelines for Federal, State, Local and Private entities. In an attempt to preserve the natural trail experience (i.e. not concrete, asphalt and boardwalk surface materials), recreation professionals have identified a need to find alternative firm and stable trail surfaces.
The National Organization on Disability and Kessler Foundation, in conjunction with Harris Interactive, studied the attitudes, experiences, and level of participation of Americans with disabilities. The study identified 13 indicators of the quality of life and standard living of Americans with disabilities. Since 1986, the Surveys of Americans with Disabilities measured the gaps on 10 of these indicators between people with and without disabilities; in 2010 three new indicators were added which were access to mental health services, technology, and overall financial situation (Kessler Foundation & National Organization on Disability, 2010). The intent of the 2010 research was to measure the size of the gaps on the 13 indicators between people with and without disabilities 20 years after the passage of the ADA; determine which gaps are and are not closing and by how much compared to earlier research; provide benchmarking for measuring future progress; and to examine additional measures of quality of life that may be relevant in today’s environment. The 10 indicators that were tracked over the course of six surveys were: employment, poverty, education, health care, access to transportation, socializing, going to restaurants, attendance at religious services, political participation, and satisfaction with life. According to this survey, individuals with disabilities felt 27 percent less satisfied with life than individuals without disabilities (Kessler Foundation & National Organization on Disability, 2010). Since the data from this survey indicate that individuals with disabilities are more likely to feel less satisfied with life, it is important to explore how participation in leisure activities can benefit and contribute to feelings of satisfaction and overall wellness among this population.
Many factors affect life satisfaction, but according to recent research, leisure satisfaction is considered a significant predictor of life satisfaction (Beggs & Elkins, 2010). Using the most recognized and utilized standardized instrument for understanding leisure satisfaction developed by Beard & Ragheb (1980), various studies have measured leisure satisfaction amongst individuals. The Leisure Satisfaction Scale is comprised of six factors that were identified using principal component analysis. The factors are psychological, educational, social, relaxation, physiological, and aesthetic (Beggs & Elkins, 2010). Beard and Ragheb described the psychological component as the psychological benefits of the leisure activity such as enjoyment, sense of freedom, involvement, and challenge. The educational factor relates to how individuals learn about themselves and their surroundings. The social dimension refers to the rewarding relationships with other individuals that are created in leisure activity participation and referred to the relaxation factor as the relief from strain and stress of everyday life. The physiological component refers to physical fitness, weight control, and well‐being. The aesthetic dimension was explained as how well individuals found the leisure environment to be pleasing, interesting, beautiful, and well designed.
Various elements may affect life satisfaction levels; however, research has shown that leisure is a major contributor to feelings of health, wellness, and high quality of life (Hall, 2005). Leisure is a means through which improvements can be made in areas such as physical, psychological, and social wellness. Shank, Coyle, Boyd, & Kinney (1996), believe recreation, leisure and play improve quality of life as well as “improve and maintain physical and psychological health and well-being” (p. 190). Research has shown that people with disabilities usually desire the same outcomes as anyone else when participating in physical activities. Those outcomes include: the ability for individuals with and without disabilities to equally benefit from physical activities (and a concomitant sense of fun), competency in doing the activity, psychological and safe environments, easy access on a regular basis, a minimum of negative consequences, and participation companions (i.e., family or friends) (Henderson, 1999). The environment can either limit or facilitate physical activity among people with disabilities. The desired outcomes of recreation participation are oftentimes not achieved due to physical limitations in the environment. To facilitate physical activity among people with disabilities, the environment must be modified to eliminate barriers (Rimmer, Riley, Wang, Rauworth, & Jurkowski, 2004). Individuals with and without disabilities develop passions for particular leisure activities and recreational sports. This research project focuses on decreasing physical barriers to participation of individuals with disabilities in the outdoor environment, and specifically on trails. The natural environment can be inherently inaccessible for people with disabilities. Rough and uneven surfaces make it difficult to push a wheelchair, maintain balance, or use other devices to help with mobility.
Individuals with disabilities often face increased constraints to participation in leisure and recreation. Attitudes, inaccessible environments and a limited understanding of possibilities prevent individuals with disabilities from benefiting from leisure and recreation. Poor health and limited physical functioning are the biggest barriers to leisure for individuals with disabilities (McCormick, 2000). Non-accessible trails can be a barrier to participation for some individuals, therefore, ensuring that trails are accessible helps to facilitate what research is proving that individuals with disabilities need fewer barriers to participation. Entities are not always afforded the opportunity to provide trails that are asphalt, concrete or boardwalk. Referring back to Beard and Ragheb’s Leisure Satisfaction Scale, both the psychological and aesthetic components of the scale would denote that individuals with disabilities would derive more satisfaction from a trail that provides a more challenging and natural experience over a trail that is paved and not challenging. The outdoor environment offers a separate experience from an urban setting and a visitor to the outdoor environment, whether with or without a disability, comes seeking that particular type of experience. Therefore, additional research is required to provide alternative surface options for constructing and maintaining firm and stable trails.
Trail management entities and/or individuals are looking for alternatives to concrete or asphalt trail surfaces that will prove to be firm and stable for their projects. There is some existing research on aggregate and/or organic or natural by‐product trail surface options, such as an article done by Anasazi Trails, Inc. on surfacing used along the Rio Grande trail corridor (Anasazi Trails, Inc., 2008), but additional research is necessary for other areas of the country.
Part I. A Longitudinal Study of Trail Surfaces Final Report
I. Introduction to the Study
Purpose
For many years, the National Center on Accessibility (NCA) at Indiana University received questions from organizations, agencies and individuals on how to make natural surface trails firm and stable. The inquires centered on what materials would provide a firm and stable surface so people with disabilities could have a quality trail experience AND would blend in with and be friendly to the environment. In 2004, the National Center on Accessibility initiated a research study of trail surfaces funded by the U.S. Access Board. The longitudinal study objective was to evaluate the ability of a variety of aggregate and organic or natural by-product soil stabilizer trail surface materials to meet firmness and stability accessibility guidelines over a five-year period of use (data were collected over 51 months).
Background
June 20, 2007, the Access Board issued proposed guidelines for outdoor developed areas that include requirements for newly constructed or altered trails. Technical requirements for trails include the provision that trails that are accessible meet firmness and stability guidelines. Advisory information in the guidelines discusses the use of a Rotational Penetrometer to measure the firmness and stability of surfaces that are located on trails. According to U.S. Access Board Notice of Proposed Rulemaking (NPRM) for Outdoor Developed Areas contained in the June 20, 2007 Federal Register, firmness is defined as “the degree of surface resistance to deformation, especially by indentation or the movement of objects;” stability is defined as “the degree to which a surface resists change from contaminants or applied force, so that when the contaminant or force is removed, the surface returns to its original condition.” The proposed guidelines provided a table in an advisory that listed the firmness and stability classifications and their respective amounts of penetration calculated in inches (Table 3). These calculations were based on the findings of a small research project on firm and stable exterior surfaces conducted for the U.S. Access Board by Beneficial Designs in 1999.
The means and materials used to establish firm and stable exterior surfaces are diverse. Crushed stone, fines, packed soil, and other natural materials can provide a firm and stable surface. Natural materials bonded with synthetic materials are also hypothesized to provide the required degree of stability and firmness” (Final Report, US Access Board's Regulatory Negotiating Committee, 1999).
In the past, there have been a number of studies that have examined alternatives to asphalt and concrete as suitable materials for making trails accessible to people with disabilities. Most notably, the USDA Forest Service and the U.S. Department of Transportation/Federal Highway Administration have for years been conducting research on various stabilizers and other products as possible uses for trail stabilization. The overall objective of the NCA Trail Surface study was to contribute to the existing body of knowledge to determine which combination of stabilizer materials and aggregates provide the most firm and stable pedestrian use trail in different environments, climates and regions.
Modifications to the Longitudinal Study
In 2006, NCA began the recruitment of various sites to participate in the original study objectives. Entities such as the National Park Service, US Forest Service, and city Parks and Recreation departments were the central focus of the recruitment process. By the end of 2006, NCA had initial commitments from a number of state or federal outdoor recreation entities to provide test sites for the trail surface study, however, the down turn in the economy and additional factors such as lack of ability to commit labor hours and installation resources, resulted in those commitments being withdrawn. From the perspective of the individual potential sites, the original study objectives and methods for achieving them relied heavily on their ability to contribute their own money and labor to the study procedures; both resources that we saw become quickly depleted and/or significantly diminish. Potential study participants expressed concern in the ability to fund the portions of the study previously agree to be financially responsible for, which included the aggregate material needed for both the base of the trail surface and the aggregate which was mixed with the stabilizer for the cases where necessary. Soon after the initial concerns were being expressed by potential participants, NCA began receiving notifications that due to economic hardships, potential test site staff were being let go, and therefore the labor required in the study parameters to install the surfaces, and to maintain and observe them, disappeared. Another difficulty the potential test site location had was the ability to maintain the trails surface study site through the proposed five-year period of time. Most entities felt the timeframe was too long, and while they understood the need for the longevity in terms of receiving the most accurate data on the surface, it was not within their capability to meet those parameters. NCA received letters that cited these difficulties in addition to others. Financial restraints were not the only obstacle NCA faced in the beginning phases of the study. It was also difficult navigating through the research process of the National Parks Service, which is where a lot of the study energy was initially invested in gaining participation for the study. While many parks agreed to the study, and even got so far as to identify installation locations, the process of applying for in-the-park research from an outside agency made it impossible in some parks for the study to move forward. It became apparent that conducting the installation, maintenance, monitoring, and data collection at locations throughout the country was not feasible at that current time. As a result, the longitudinal data collected and reported for Part I of this study over 51 months, is limited to the Bradford Woods site in Martinsville, Indiana. The scope of the study again changed course to continue to discover other methods of contributing to the research on firm and stable natural trail surface alternative. The results of the change in scope is discussed in Part II of this report.
II. Research Methodology
In 2004, the National Center on Accessibility began the development of protocols for a National trails surface study to evaluate alternatives to asphalt, concrete and boardwalk as suitable materials for making trails accessible to people with disabilities. By 2007 installation of surface materials for testing was begun at Bradford Woods located at Indiana University.
The following are the three research questions explored in “Section III: Result of the Study”:
-
Does each of the 11 trail surface materials meet or exceed the classifications for firmness and stability as proposed by the US Access Board in their 2007 Notice of Proposed Rulemaking for Outdoor Developed Areas?
-
When evaluating the firmness and stability of each of the 11 trail surface materials, how does each of the 11 trail surface materials compare to themselves over a 51 month time period?
-
When evaluating the firmness and stability of each of the 11 trail surface materials, how does each surface compare to each of the other surfaces over a 51 month time period?
Selection of Locations
The longitudinal trail study was limited to the one geographic location of Bradford Woods located in Martinsville, Indiana, 30 minutes south of Indianapolis Indiana. Bradford Woods is an auxiliary enterprise of Indiana University and is part of the academic mission of the School of Public Health and is a unit of the environment, hosts various programs throughout the year that focus on adventure education, environmental education, and therapeutic recreation. Bradford Woods also hosts retreats and runs various camps. The 11 test plots were installed in a previously undisturbed wetlands area where the maximum running slope of any of the sections was 7.6 percent. The trail segments did not see high visitor use, and were restricted to just pedestrian access. The following are the average high and low temperatures and precipitation for Martinsville Indiana as recorded by month:
Average Temperature & Precipitation January to June
| Jan | Feb | March | April | May | June | |
| Average high in °F | 35 | 40 | 51 | 63 | 73 | 81 |
| Average low in °F | 18 | 21 | 30 | 40 | 50 | 59 |
| Av. precipitation - inch | 2.56 | 2.44 | 3.5 | 4.25 | 4.72 | 3.98 |
Average Temperature & Precipitation July to December
| July | Aug | Sep | Oct | Nov | Dec | |
| Average high in °F | 85 | 84 | 77 | 66 | 53 | 40 |
| Average low in °F | 63 | 61 | 52 | 40 | 32 | 23 |
| Av. precipitation - inch | 4.21 | 4.21 | 3.23 | 3.03 | 3.86 | 3.15 |
This site is within driving distance of the Bloomington-based research team and easily accessed at any given time throughout the length of the study. Bradford Woods was selected as a result of a direct advertising recruitment method for testing sites. The study was advertised on NCA’s website and through a news release disseminated by the NCA. Direct conversations were had with colleagues within the Department of Recreation, Parks, and Tourism Studies within the School of Public Health - Bloomington, to help recruit Bradford Woods as a potential test site. The selection of the location of the trail surface plots was purposeful within its location in the Wetlands area at Bradford Woods. Previous locations for surface testing did not include the factors associated with a wetlands installation and this particular site such as:
-
A previously undisturbed ground surface;
-
Minimal running and cross slope percentages (under five percent);
-
Allows for manufacturer technical installation instructions to be met; and
-
A physical environment with distinct ground characteristics (i.e. higher moisture content, less drainage, etc.).
Selection of Trail Surface Materials
A review of trail surfacing products conducted for this project identified approximately 80 different trail surface materials that promoted providing an accessible trail surface (PEL Consulting, 2004). Those trail surface materials that were similar products were listed together within each of five major categories:
-
Constructed soil/aggregate surfaces (e.g. crushed aggregate or brick, pre‐stabilized granite, aggregate fines, organic or natural by-product soil stabilizers);
-
Geosynthetics (e.g. geotextile, geocell, geoweb, geogrid);
-
Plastic and rubber solid surfaces (e.g. rubber mats, composite decking, plastic lumber, snow fence);
-
Wood surfaces (e.g. wood plank, chipped woods, engineered wood fiber); and
-
Brick and concrete surfaces (e.g. interlocking brick, concrete, asphalt).
The surfaces included in the study were chosen for inclusion as a result of three factors: donated product, ability to verify the stabilizer applications were a match for the native soils at Bradford Woods, and providing verification of the product being 100 percent natural, environmentally friendly product.
In order to ensure the validity of the study, exclusion criteria were then created based on limiting the scope of research to ensure the identified research questions could be answered. Based on the criteria for identifying firm and stable, organic or natural by-product surface materials, the following category of surface materials were identified for participation in the study:
-
Constructed soil/aggregate surfaces (e.g. crushed aggregate, pre-stabilized granite, aggregate fines, organic or natural by-product soil stabilizers).
A total of 11 surface materials (eight organic or natural by-product soil stabilizers, and three aggregate surfaces) were chosen based on their compatibility with existing soil and/or aggregate composition, and the manufacturer’s ability to provide lab results to verify the authenticity of the statement that their product is either an organic or a natural by-product. The following are the 11 surface materials evaluated in the study:
-
¼ inch minus crushed limestone and dust
-
¾ inch minus crushed limestone and dust
-
¾ inch minus crushed limestone and dust base and ¼ inch minus crushed limestone and dust top dress
-
Klingstone 400
-
Stabilizer
-
StaLok
-
Soiltac Liquid Mix-in
-
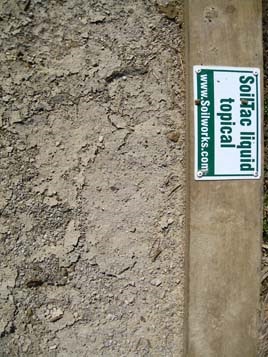
Soiltac Liquid Topical
-
Soiltac Powder Mix-in
-
Soiltac Powder Topical
-
Polypavement
Delimitations
The study was delimited in scope by the following:
-
Data from this study were obtained from a longitudinal study administered through the National Center on Accessibility (NCA) at Indiana University;
-
One category of surface materials, constructed soil/aggregate surfaces out of six identified were chosen for participation in the study;
-
Size of the site limited total number of trail surface products that were able to be installed;
-
Trail surfaces were evaluated on site using a Rotational Penetrometer (RP) to determine firmness and stability of the surface; and
-
Firmness and stability readings were evaluated based on the recommended values of the U.S. Access Board in the Notice of Proposed Rulemaking for Outdoor Developed Areas (U.S. Access Board, 2007).
Limitations
The study is limited in scope by the following:
-
Ability to generalize findings to trails in other locations with the same surfaces applied. Surfaces installed in other locations vary in terms of design parameters, frequency and type of use, site conditions, weather and climate;
-
The sections of installed trail surface materials see different uses and frequency at Bradford Woods. Higher visitor usage, and varying types of usage, can affect the surface material;
-
Not all soil stabilizers were able to be installed at the chosen site location due to soil/aggregate incompatibility thus limiting the ability to test a wider variety of surfaces which would contribute to a larger data set for comparison;
-
Climate, adverse weather conditions, seasonal changes, and precipitation may affect trail surface materials; those differences in other locations cannot be accounted for with this study;
-
Surfaces needed to be maintained and were maintained in order to ensure their safe usage for the daily operation of Bradford Woods.
Assumptions
In 2007 the U.S. Access Board published values for firmness and stability in the NPRM for Outdoor Developed Areas based on use of the Rotational Penetrometer. For the purpose of this study, it was assumed that:
-
A Rotational Penetrometer can be used to determine firmness and stability for trail surfaces as they relate to accessibility
Definitions of Terms
For the purpose of this study and further discussion, the following terms will be used:
Aggregate. Crushed limestone (crushed shale or rock in regions that limestone is not available), natural soils, or dirt that is brought in from a different location than the actual site.
Firmness. The degree of surface resistance to deformation, especially by indentation or the movement of objects (U.S. Access Board, 2007).
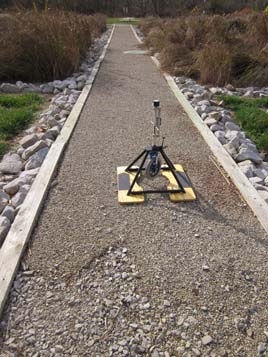
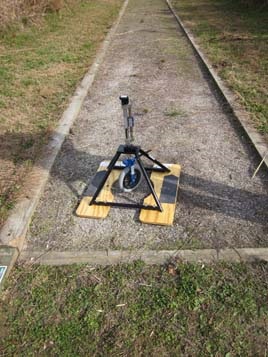
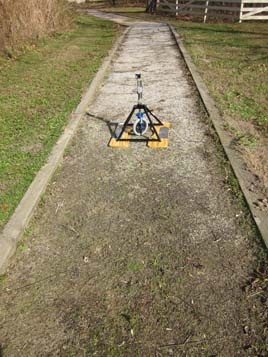
Rotational Penetrometer. The instrument used in field-testing to test for compliance with the Outdoor Developed Areas Guidelines firmness and stability recommendations. The Rotational Penetrometer, developed by Beneficial Designs, uses a wheelchair caster placed on a spring loaded caliber in a metal tripod frame which suspends the caster about 6 inches over the surface. When the caster is released, the spring load gauge replicates the force of an individual in a wheelchair over a given surface. The penetration into the surface is measured for readings of “firmness.” The test for stability requires the caster of the Rotational Penetrometer to be moved from side to side to determine the horizontal displacement of the surface material.
Soil Stabilizer. A product that is applied either topically, or mixed-in that acts as a binding agent to either native soils or an additional type of aggregate. The soil stabilizers chosen for this study are all "green" products meaning that they come from natural by products.
Stability. The degree to which a surface resists change from contaminants or applied force, so that when the contaminant or force is removed, the surface returns to its original condition (U.S. Access Board, 2007).
Trail. A pedestrian route developed primarily for outdoor recreational purposes (U.S. Access Board, 2009).
Data Collection Procedures
The trail surface site is hosted by Bradford Woods but NCA staff collected all data. While the site for the study was not kept confidential and the test plots are identified by signage, no data results have been posted prior to this final report.
Upon consent to participate in this study, the site owner (Bradford Woods) was asked to designate a site coordinator to provide the principal investigator (NCA Trail Study Coordinator Nikki Montembeault) with any additional information necessary for data collection, such as vendor information, cost of product installation, materials needed, and any mandatory maintenance required. Consent from the manufacturers of the products consisted of the manufacturers agreeing to the release of their product names and data collected on their surfaces to the public, and to be used for future research endeavors. Within a maximum of one month from each surface installation, a preliminary accessibility assessment of the trail surface was conducted and the surfaces were tested for firmness and stability with the Rotational Penetrometer. This was considered the first set of data collected for the longitudinal study. Accessibility assessments and trail surface testing for firmness and stability were conducted on average, three months per year for 51 months. In addition to the data collected with the Rotational Penetrometer, photos were taken of individual surface materials at both the time of the installation and during the assessments; observational notes were recorded about surface conditions at the time of the assessments and external factors that may have influenced or affected the surfaces positively or adversely. Those external factors noted included external weather temperature, recent extreme weather conditions, sun and shade conditions of the trail, and season of the year (deduced by recording the month).
The 11 trail surface segments ranged in length from 30 feet – 200 feet (see the Qualitative and Observational Analysis by Surface Type for an accurate breakdown by trail surface segment). The parameters of the Rotational Penetrometer testing consisted of testing each trail segment for firmness and stability in five locations along the trail segment. The intent of the five firmness and stability readings was to ensure readings were gathered from various locations within the segment in the event that trail surface conditions varied. Potential causes for variation might be running and cross slope, a difference in drainage and/or adjacent runoff, and sun vs. shade location of reading locations.
Instrumentation for Analysis
One instrument, the Rotational Penetrometer (Figure A), was used for data collection. An on-site inspection form (Appendix C) was created to collect data on the 11 trail segments including Rotational Penetrometer readings, inspection location in feet from trailhead, ruts, tread obstacles, or other surface abnormalities. Testing for wheelchair accessibility specific to firmness and stability was conducted with the application of the Rotational Penetrometer as developed by Beneficial Designs.
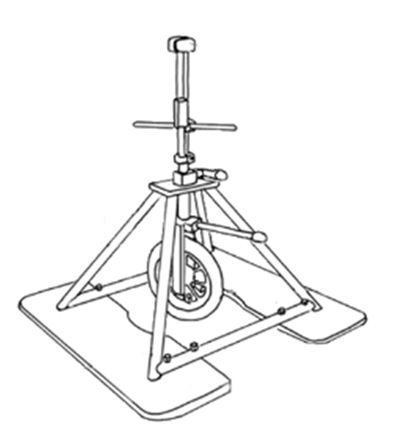
Figure A Rotational Penetrometer
Treatment of Data
The research design for this study was developed to collect data on trail surface conditions, evaluate individual surface performances over time, note deficiencies, and compare across surface types. Through further analysis, results of trail surface tests for firmness and stability were compared within surface composition categories and across surface composition categories to determine the mean, range and standard deviation of each surface type. Descriptive statistics were used for analysis of data. A one-way analysis of variance (ANOVA) was used to determine if there was any statistical significance between surface composition categories. Sequence charts were run and analyzed for each surface composition category to determine if any patterns, similarities and/or differences between surface compositions could be discerned. Lastly, qualitative data on the surface material conditions during the site visit was collected in order to provide a narrative description of findings.
III. Results of the Study
The purpose of the longitudinal study was to evaluate a variety of aggregate and organic or natural byproduct soil stabilizer trail surface materials for their ability to meet the recommended firmness and stability values established by the proposed accessibility guidelines over an extended period of time. The Notice of Proposed Rulemaking for Outdoor Developed Areas Accessibility Guidelines provides guidelines for firmness and stability, and the longitudinal trail surface study explored the following three research questions:
-
Does each of the 11 trail surface materials meet or exceed the classifications for firmness and stability as proposed by the US Access Board in their 2007 Notice of Proposed Rulemaking for Outdoor Developed Areas?
-
When evaluating the firmness and stability of each of the 11 trail surface materials, how does each of the 11 trail surface materials compare to themselves over a 51 month time period?
-
When evaluating the firmness and stability of each of the 11 trail surface materials, how does each surface compare to each of the other surfaces over a 51 month time period?
Performance for Surface Firmness and Stability
Table 1 identifies the 11 test surface materials, the dates of installation, and the date of the initial and final testing of surfaces at the Wetlands at Bradford Woods in Martinsville, Indiana:
| Table 1. Surface Material, Installation, Initial and Final Data Collection | |||
| Surface Material | Date of Installation | Date of Initial
Data Collection
|
Data of Final
Data Collection
|
| ¼ inch minus limestone | August 9, 2007 | August 16, 2007 | November 02, 2011 |
| ¾ inch minus & ¼ inch minus limestone | August 9, 2007 | August 16, 2007 | November 02, 2011 |
| ¾ inch minus limestone | August 1, 2007 | August 16, 2007 | November 02, 2011 |
| Klingstone 400 | June 19, 2007 | June 21, 2007 | November 02, 2011 |
| Polypavement | July 3, 2007 | June 6, 2007 | November 02, 2011 |
| Soiltac Liquid Mix-In | June 27, 2007 | July 6, 2007 | November 02, 2011 |
| Soiltac Liquid Topical | June 27, 2007 | July 6, 2007 | November 02, 2011 |
| Soiltac Powder Mix-In | June 27, 2007 | July 6, 2007 | November 02, 2011 |
| Soiltac Powder Topical | June 27, 2007 | July 6, 2007 | November 02, 2011 |
| Stabilizer | June 21, 2007 | July 6, 2007 | November 02, 2011 |
| StaLok | June 21, 2007 | July 6, 2007 | November 02, 2011 |
The surfaces were tested three times a year (with the exception of 2007 and 2010 when each of the surfaces were tested twice), over 51 months. The testing occurred in varying seasons to capture the way in which the climate change affects the surfaces. The firmness and stability means and standard deviations are important elements of the data collection and reporting process. However, a potentially more telling figure may reside in the minimum and maximum ranges for each. Table 2 provides the ranges, means and standard deviations for firmness and stability readings as measured by the Rotational Penetrometer.
| Table 2. Trail Surface Material and Firmness and Stability Data | ||||||
| Surface Material | Firmness Range | Firmness Mean | Firmness Standard Deviation | Stability Range | Stability Mean | Stability Standard Deviation |
| ¼ inch minus limestone | 0.16‒0.25 | 0.20 | 0.03 | 0.22‒0.71 | 0.43 | 0.17 |
| ¾ inch minus & ¼ inch minus limestone | 0.15‒0.27 | 0.18 | 0.03 | 0.21‒0.59 | 0.35 | 0.11 |
| ¾ inch minus limestone | 0.15‒0.19 | 0.17 | 0.01 | 0.21‒0.41 | 0.28 | 0.07 |
| Klingstone 400 | 0.15‒0.21 | 0.18 | 0.02 | 0.18‒0.27 | 0.22 | 0.02 |
| Poly-pavement | 0.16‒0.35 | 0.26 | 0.07 | 0.18‒0.70 | 0.44 | 0.18 |
| Soiltac Liquid Mix-In | 0.15‒0.25 | 0.19 | 0.03 | 0.17‒0.64 | 0.41 | 0.15 |
| Soiltac Liquid Topical | 0.15‒0.29 | 0.19 | 0.04 | 0.19‒0.74 | 0.40 | 0.18 |
| Soiltac Powder Mix-In | 0.14‒0.21 | 0.17 | 0.02 | 0.18‒0.49 | 0.33 | 0.10 |
| Soiltac Powder Topical | 0.16‒0.25 | 0.19 | 0.03 | 0.20‒0.60 | 0.33 | 0.12 |
| Stabilizer | 0.14‒0.23 | 0.18 | 0.03 | 0.27‒0.96 | 0.44 | 0.18 |
| StaLok | 0.14‒0.18 | 0.16 | 0.01 | 0.17‒0.24 | 0.20 | 0.02 |
To decipher the firmness and stability classifications of each of the trail surface materials, Table 3 was utilized. Table 3 depicts the firmness and stability classifications according to the NPRM for Outdoor Developed Areas. In 2004, at the start of the study, the identified table was referenced in the NPRM for Outdoor Developed Areas, but has since been removed from the Draft Final for Outdoor Developed Areas guidelines. The removal of the classifications was due in part to a lack of sufficient research to support the numerical associations of the firmness and stability ranges.
| Table 3. Firmness and Stability Classification per NRPM Outdoor Developed Areas | |
| Firmness Classification | Amount of Penetration |
| Very Firm | 0.3 inches or less |
| Moderately Firm | > 0.3 inches and < 0.5 inches |
| Not Firm | Greater than 0.5 inches |
| Stability Classification | Amount of Displacement |
| Very Stable | 0.5 inches or less |
| Moderately Stable | > 0.5 inches and < 1.0 inch |
| Not Stable | Greater than 1.0 inch |
Table 4 correlates the firmness and stability classifications of the surface means, to the data reading outputs. When classifying the firmness and stability means, the surfaces all test in the top (most firm and most stable) classification for firmness and stability. Meaning, these specific surface installations would be reported as firm and stable surfaces according to the US Access Board per the NPRM for Outdoor Developed Areas.
| Table 4. Firmness and Stability Classifications of Data Surface Material Means | ||
| Surface Material | Firmness Classification | Stability Classification |
| ¼ inch minus limestone | Very Firm | Very Stable |
| ¾ inch minus & ¼ inch minus limestone | Very Firm | Very Stable |
| ¾ inch minus limestone | Very Firm | Very Stable |
| Klingstone 400 | Very Firm | Very Stable |
| Polypavement | Very Firm | Very Stable |
| Soiltac Liquid Mix-In | Very Firm | Very Stable |
| Soiltac Liquid Topical | Very Firm | Very Stable |
| Soiltac Powder Mix-In | Very Firm | Very Stable |
| Soiltac Powder Topical | Very Firm | Very Stable |
| Stabilizer | Very Firm | Very Stable |
| StaLok | Very Firm | Very Stable |
However, when comparing readings for the firmness and stability ranges, the soil stabilizer and trail surface segment Polypavement, exceeds the range of “very firm” and would be classified as “moderately firm” (as seen in Table 5). The ¼ inch minus limestone, ¾ inch minus and ¼ inch minus limestone, Polypavement, Soiltac Liquid Mix-in, Soiltac Liquid Topical, Soiltac Powder Topical, and Stabilizer all exceed the stability classification of “very stable” and would all be classified as “moderately stable”. This is an important observation to make as trail surfaces are expected to meet the firmness and stability classifications to the maximum extent practicable for the total length of time that the trail is open to the general public and/or its visitors. Evidence of varying firmness and stability could lead to a surface becoming non-firm and non-stable over time.
| Table 5. Firmness and Stability Classifications of Data Surface Material Ranges | ||
| Surface Material | Firmness Classification | Stability Classification |
| ¼ inch minus limestone | Very Firm | Moderately Stable |
| ¾ inch minus & ¼ inch minus limestone | Very Firm | Moderately Stable |
| ¾ inch minus limestone | Very Firm | Very Stable |
| Klingstone 400 | Very Firm | Very Stable |
| Polypavement | Moderately Firm | Moderately Stable |
| Soiltac Liquid Mix-In | Very Firm | Moderately Stable |
| Soiltac Liquid Topical | Very Firm | Moderately Stable |
| Soiltac Powder Mix-In | Very Firm | Very Stable |
| Soiltac Powder Topical | Very Firm | Moderately Stable |
| Stabilizer | Very Firm | Moderately Stable |
| StaLok | Very Firm | Very Stable |
To best depict the firmness and stability of a surface as compared to itself over a period of time, it is easiest to examine graphs that depict the performance of the individual surfaces over the 51 months. Each graph contains the firmness mean in blue and stability mean in red along the vertical axis, and the date of data collection for each reading along the horizontal axis. The graph title identifies the surface material, and in addition, the composition of the material identified.
Each of the eleven surfaces shows a decline in stability from the point of installation and first rotational penetrometer test, to the last date of data collection at the end of the 51 month study. Whereas, only Soiltac Powder Topical and Polypavement show a decline in the firmness from the point of installation and first rotational penetrometer test, to the last date of data collection at the end of the 51 month study.
Figure B ¼ inch minus limestone aggregate
Figure C ¾ inch & ¼ inch minus limestone aggregate
Figure D ¾ inch minus limestone aggregate
Figure E Klingstone 400
Figure F Polypavement
Figure G Soiltac liquid mix‐in
Figure H Soiltac liquid topical
Figure I Soiltac powder mix‐in
Figure J Soiltac powder topical
Figure K Stabilizer
Figure L StaLok
Five different surface compositions make up the 11 various trail surfaces. The following is a breakdown of the five types of surfaces (the make-up of the surface) and the trail surfaces that are included in each:
-
Polyurethane: Klingstone 400
-
Vinyl Acetate Copolymer: Soiltac Liquid Topical, Soiltac Liquid Mix-in, Soiltac Powder Topical, and Soiltac Powder Mix-in
-
Organic Plant Material: Stabilizer
-
Polymer: StaLok and Polypavement
-
Aggregate and fines: ¼ inch minus limestone, ¾ inch minus base and ¼ inch minus top dress limestone, and ¾ inch minus limestone
Utilizing the firmness and stability means of each of the five different surface compositions, a one-way analysis of variance (ANOVA) was run to determine if there was a statistical significance between each of the five different surface composition types. A statistical significance between surface compositions would mean that on average, the surface composition that shows a statistical significance would have maintained a greater degree of firmness or stability over the study period. In order to be statistically significant, the firmness or stability means of one surface composition, when compared to another, would have to be equal to or less than .05. The analysis found that there was a statistical significance in stability between Klingstone 400 (polyurethane), all four Soiltac (vinyl acetate copolymer) surface compositions, the organic plant material, and the ¼ inch minus limestone aggregate surface. To illustrate this point, review Figure M and observe that according to the data collected on five surface compositions over 51 months, it is 95 percent (or .95) certain that the polyurethane surface composition (in this case Klingstone 400) remained more consistently stable than the other three surface compositions (vinyl acetate copolymer, organic plant material, and a ¼ inch minus aggregate surface).
Figure M Statistical significance of stability between surface compositions
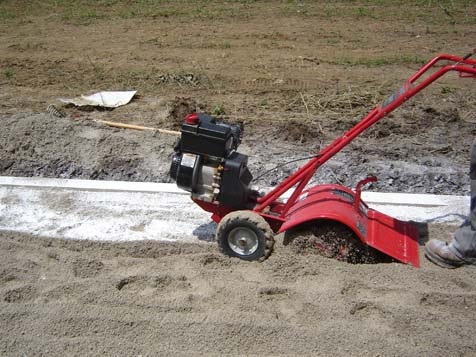
Installation of Aggregate Surfaces at Bradford Woods
The installation of the aggregate surfaces at Bradford Woods conformed to the following protocol:
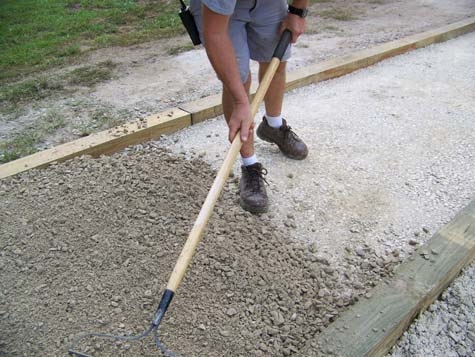
Prior to installing the crushed rock (aggregate) surfacing material, the trail bed shall be shaped to reflect the same linear grade and cross slope as the desired finished surface. The trail bed shall be uniformly smooth and compacted to a rate of 90 percent.
The rock shall be from a quarry and have angular fractured surfaces. It shall be ¾ inch minus 100 percent crushed and shall be free of vegetable matter and other potentially harmful substances. It shall be of such nature that it can be compacted readily under watering to form a firm and stable surface. The crushed rock shall be inspected by a representative of the contracting agency prior to delivery to the worksite to insure material quality. The crushed quarried rock shall conform to the grading requirements shown in Table 6.
| Table 6. Installation of Firm and Stable Aggregate Material at Bradford Woods | ||
| Sieve Sizes | ¾ inch Maximum Individual Test Result | Moving Average |
| 1” | 100 | 100 |
| ¾” | 87‒100 | 90‒100 |
| No. 4 | 30‒60 | 35‒55 |
| No. 30 | 5‒35 | 10‒30 |
| No. 200 | 0‒12 | 2‒9 |
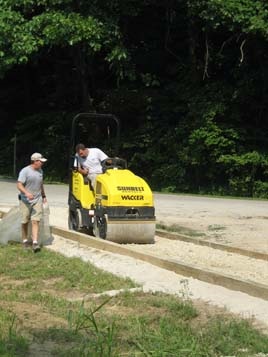
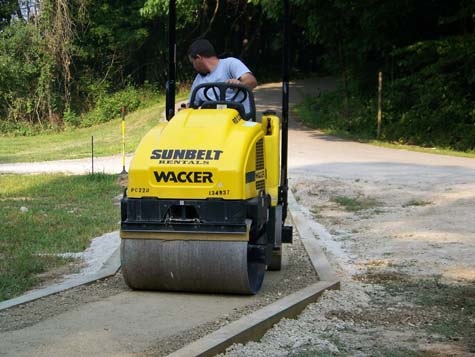
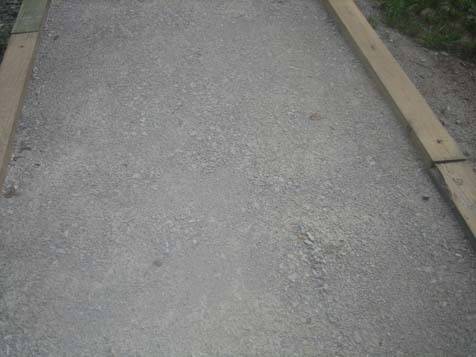
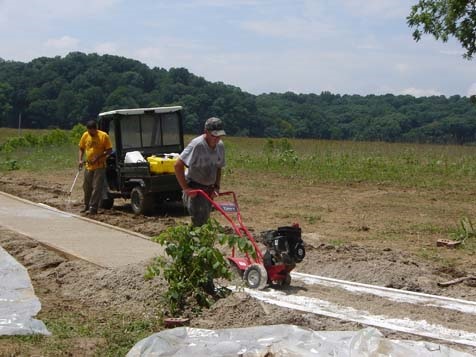
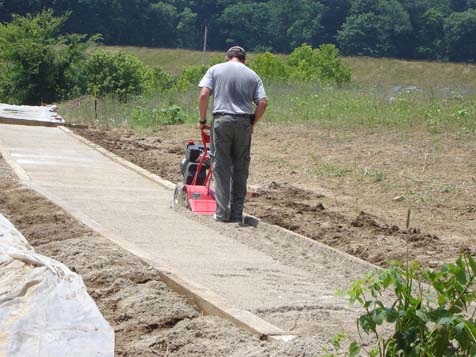
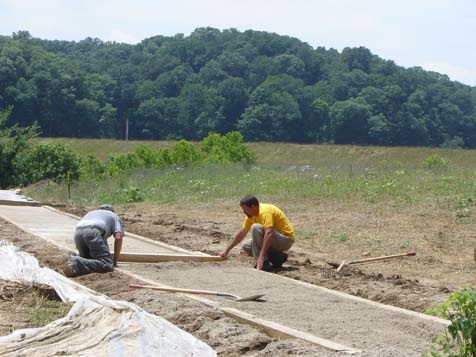
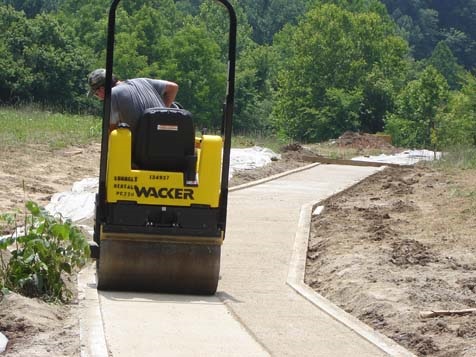
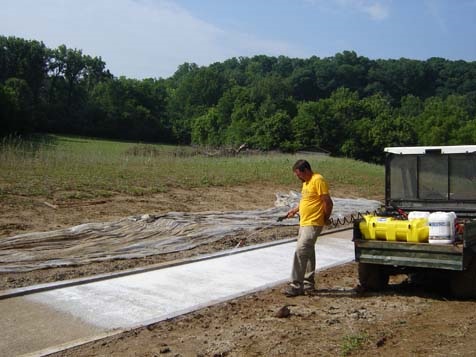
The crushed rock shall be applied to the trail bed at a minimum depth of 6 inches. The application shall be performed in two separate 3-inch lifts. Each lift shall be shaped to the proper linear grade and cross slope prior to compaction. Compaction shall be performed by using either a viberplate compactor or a vibratory roller and shall achieve a minimum compaction rate of 90 percent. The crushed rock shall be kept moist to achieve the maximum rate of compaction. Native soil shall be blended into the last 3-inch lift of crushed rock to soften the color and texture of the finished trail tread. The rate of application shall vary depending on the clay content of the native soil. The finished surface of the trail tread shall be uniformly smooth without holes or concave depressions that can trap water. Photos that illustrate the installation of each trail section are included in Appendix D.
Qualitative and Observational Analysis by Surface Type
The aggregate material listed below contains a size (inch), the label “minus”, and an aggregate type. In the Midwest, the primary aggregate material made available at quarries for distribution is Limestone; therefore, Limestone was the aggregate component used in the aggregate only trail segments. When ordering the aggregate material from the quarry, it is up to the individual placing the order, to decipher which size aggregates, percentage of aggregate, and percentage of fines will be included in the combined shipment of materials. Varieties of aggregate stone sizes were chosen for the trail segments in this study and they included stones that ranged from ¼ inch to ¾ inches.
To understand the “minus” meaning of the aggregate denoted, it is essential to explain the composition of the material as it leaves the quarries. For example for an order for ¾ inch minus limestone aggregate, the “minus” essentially means that the shipment of aggregate will include both stones and fines (small particles resembling dust) that are a maximum size of ¾ inches and smaller. Quarries produce aggregate specification sheets that they make available for each shipment of aggregate. The aggregate specification sheet will contain the sieve size (size of stone that is allowed to pass through the sieve to be included in the shipment) and the percent of that particular size that is included (percent passing). In the example, 100 percent of the stones that are ¾ inches are allowed to pass and will be included. Of the stones that are 3/8 inches, 77 percent of the stones are allowed to pass and will be included. Of the stones that are #4 (smaller than 3/8 inches), 46 percent of the stones are allowed to pass and will be included (so on and so forth). Anything that is identified as #200 is considered dust, so in this example, 11.3 percent is allowed to pass and will be included.
The size of the aggregate distributed is often of critical importance to the way the material performs. Too much of the smaller fines in comparison to the larger fines may contribute to more washout or erosion, whereas not enough smaller fines may lead to lots of loose, larger aggregate pieces that can contribute to a non-firm and non-stable surface.
Appendix D contains photos of the installation of each of the 11 trail segments, in addition to photos that chronicle the effects of time on the surfaces over 51 months.
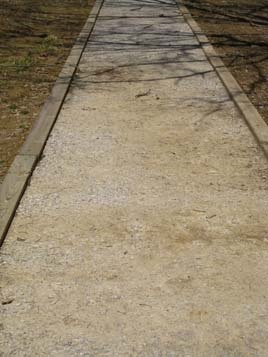
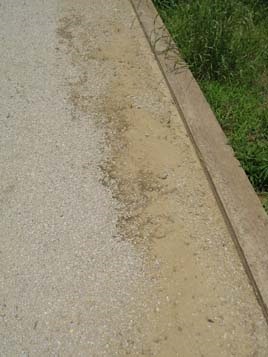
¼ Inch Minus Limestone
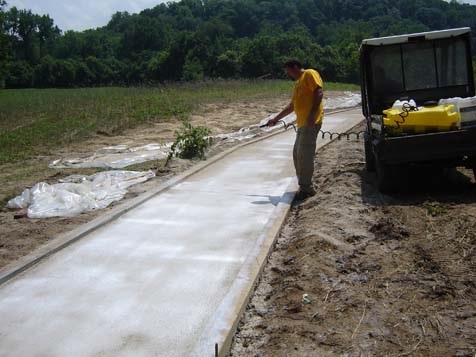
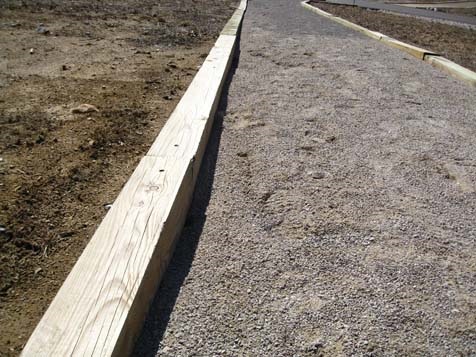
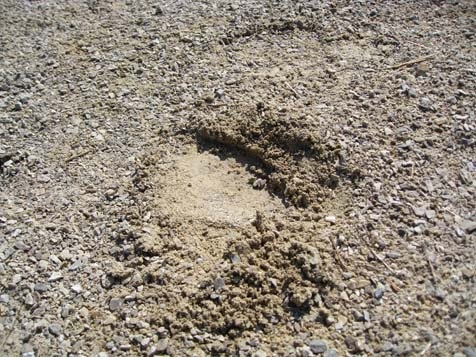
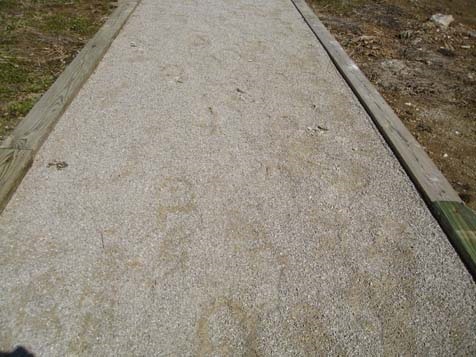
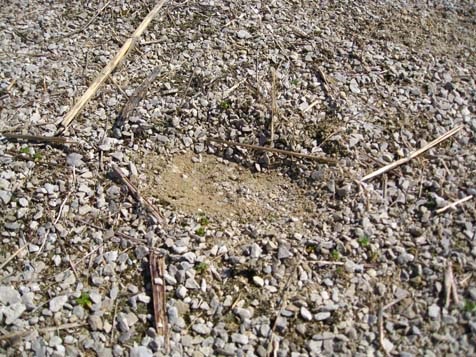
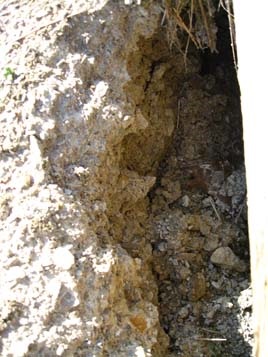
The trail segment is composed of 6 inches of ¼ inch minus limestone and dust and is 5 feet wide by 50 feet long. The segment contains timber edging. The surface was installed in two rolled and compacted 3 inch lifts. The segment maintained itself well in dry temperatures (June – August; 100 degree temps), remaining hard and compacted under foot. Following the first two days of heavy rainfall uncharacteristic for Indiana, the surface was loose under foot and was bogged down with water. Eventually, the surface developed an erosion ditch measuring approximately 16 feet and at a depth of approximately 3 inches. The surface never firmed back up under foot by the end of fall. After extended periods of no moisture and sun, the surface firms back up under foot.
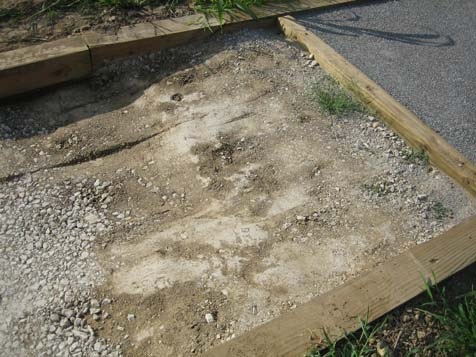
Quarter Inch Minus Limestone was installed in two rolled and compacted 3 inch lifts. August 9, 2007.
Quarter Inch Minus Limestone trail segment as second lift is rolled and compacted. August 9, 2007.
Quarter Inch Minus Limestone trail segment maintained itself in dry temperatures. October 19, 2007.
Quarter Inch Minus Limestone trail segment was loose under foot after heavy rainfall. March 13, 2008.
Quarter Inch Minus Limestone trail segment developed an erosion ditch. March 13, 2008.
Quarter Inch Minus Limestone trail segment would only firm up after extended periods of no moisture. March 17, 2009.
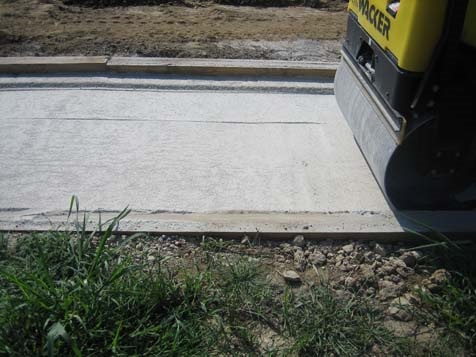
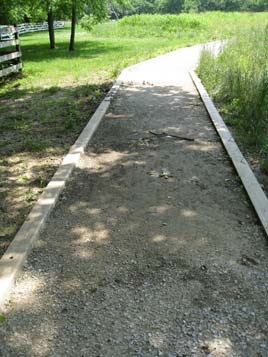
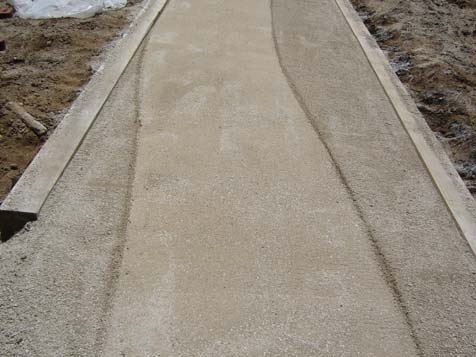
¾ Inch Minus and ¼ Inch Minus Limestone
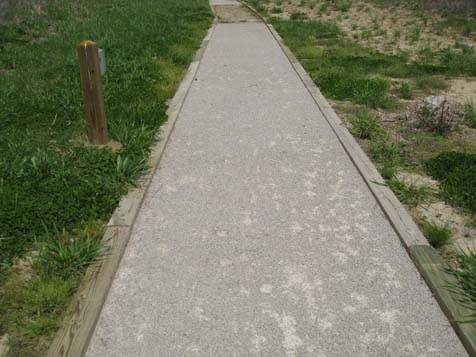
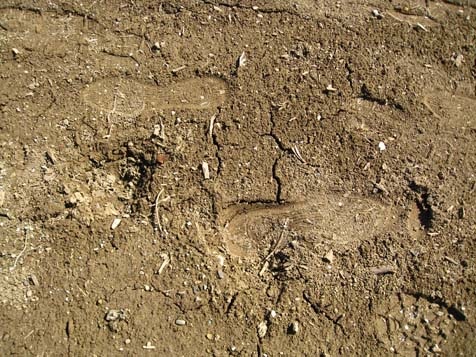
The trail segment is composed of 4 inches of ¾ inch minus limestone and approximately 50 percent dust as a base; and a 2 inch top‐dressing of ¼ inch minus limestone and dust. This trail segment is 5 feet wide by 50 feet long and contains timber edging. This segment maintained itself well in dry temperatures (June – August; 100 degree temps), remaining hard and compacted under foot. It did then show signs of becoming loose under foot at the first two days of heavy rainfall. The surface stayed soft under foot, enough to see footprints compacted and not return to the surface, but did not show any signs of erosion. The surface appeared to become firm and stable under foot more quickly than the ¼ inch surface; most likely as a result of a base composed of larger fines to allow for more adequate drainage.
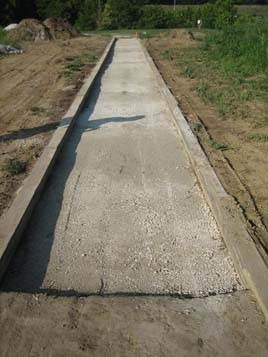
Three Quarter Inch Minus Base and Quarter Inch Minus Top Limestone trail segment is composed of 4 inch base; and a 2 inch top-dressing. August 9, 2007.
Three Quarter Inch Minus Base and Quarter Inch Minus Top Limestone trail segment maintained itself in dry temperatures. October 19, 2007.
Three Quarter Inch Minus Base and Quarter Inch Minus Top Limestone trail segment after heavy rain. March 13, 2008.
Three Quarter Inch Minus Base and Quarter Inch Minus Top Limestone trail segment firmed back up more quickly than the ¼ inch surface. May 6, 2008.
Three Quarter Inch Minus Base and Quarter Inch Minus Top Limestone trail segment showed signs of footprints after heavy rain. March 17, 2009.
Three Quarter Inch Minus Base and Quarter Inch Minus Top Limestone trail segment after heavy rain. March 17, 2009.
Three Quarter Inch Minus Base and Quarter Inch Minus Top Limestone trail segment after heavy rain. March 17, 2009.
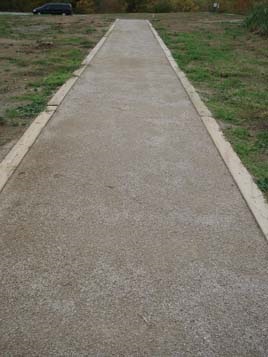
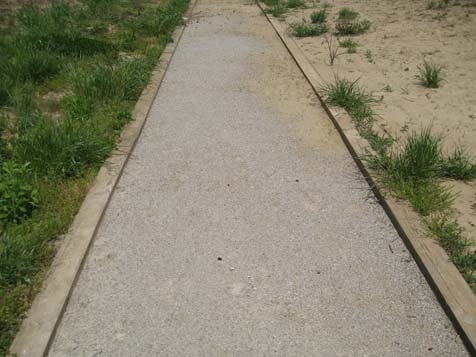
Three Quarter Inch Minus Base and Quarter Inch Minus Top Limestone trail segment became firm and stable under foot more quickly than the ¼ inch surface. November 2, 2011.
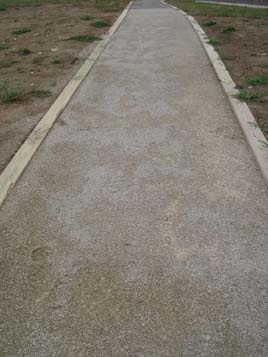
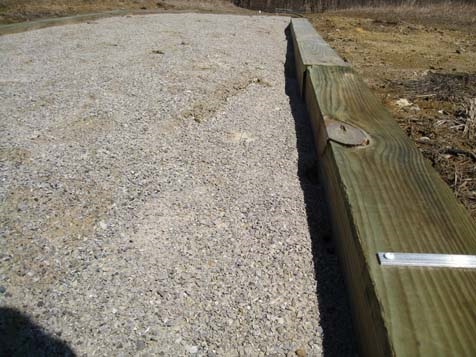
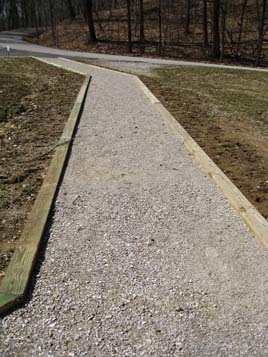
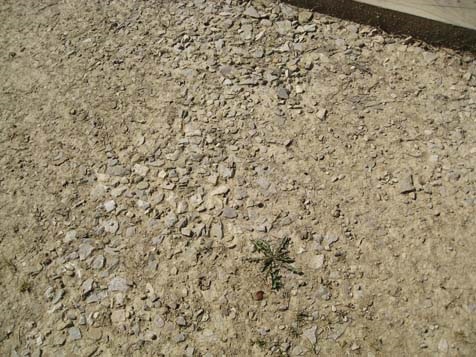
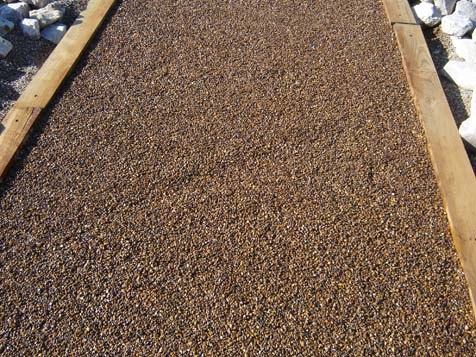
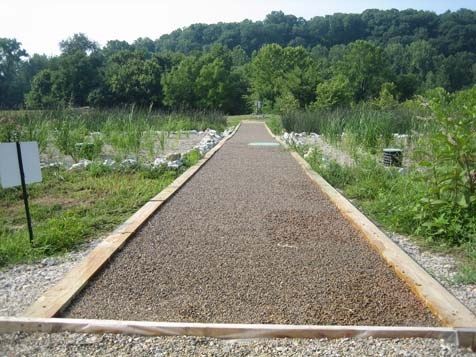
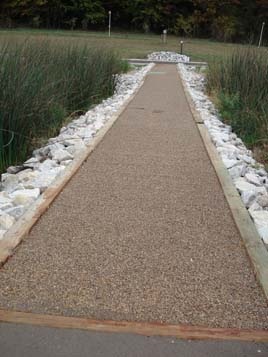
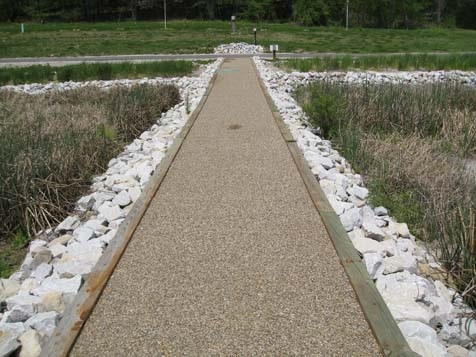
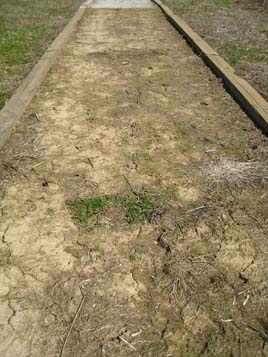
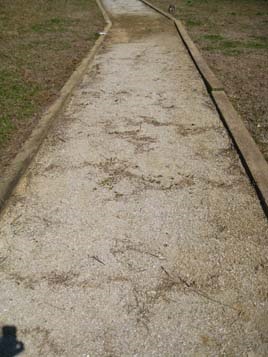
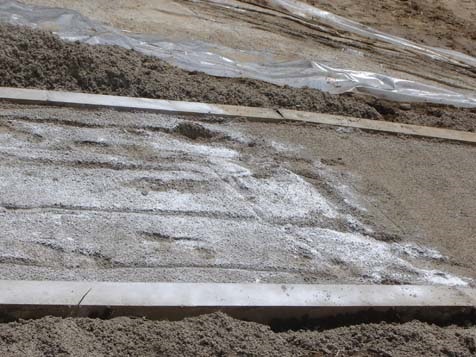
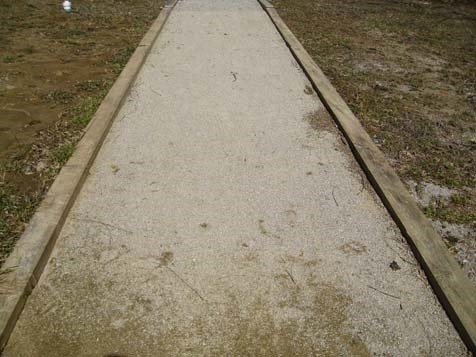
¾ Inch Minus Limestone
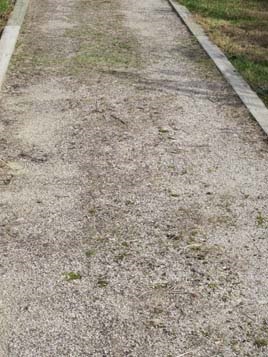
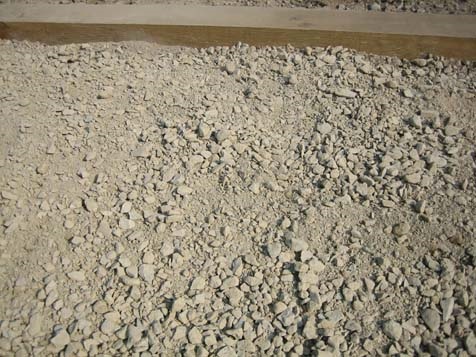
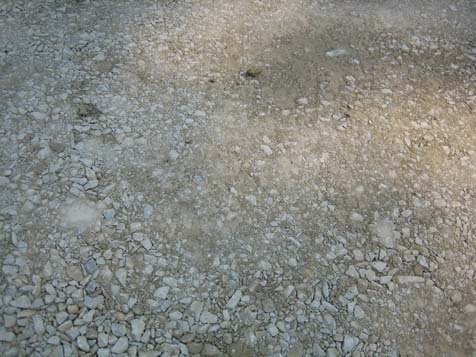
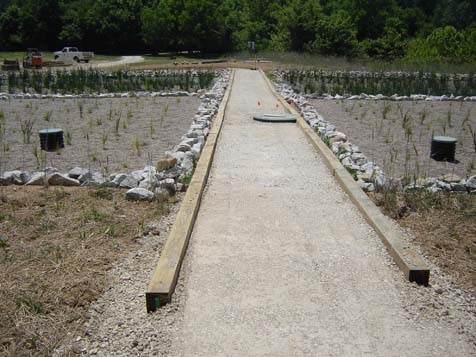
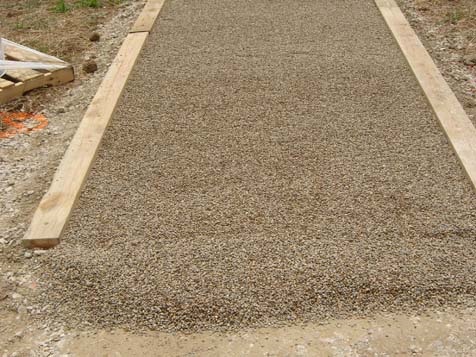
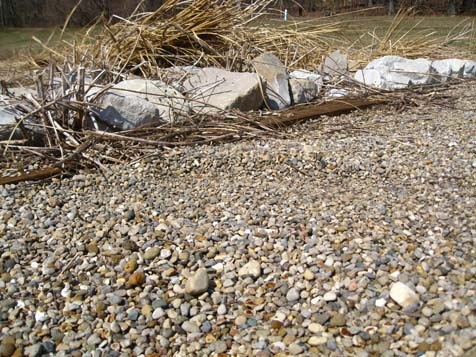
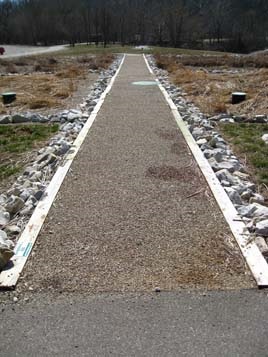
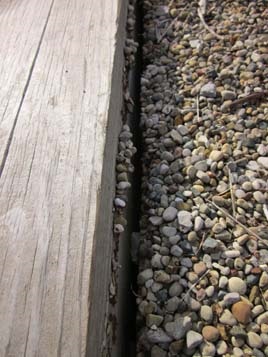
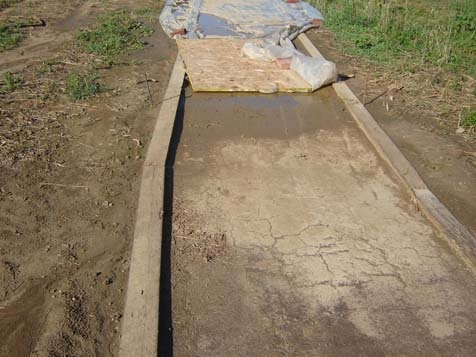
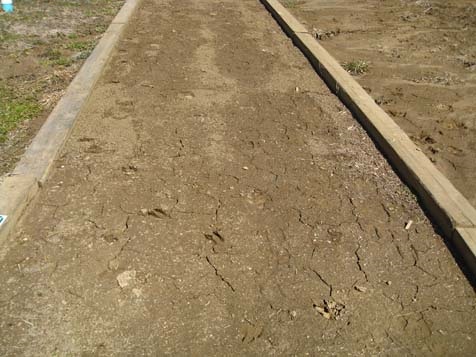
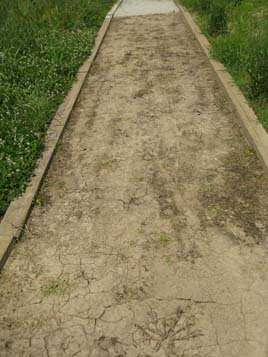
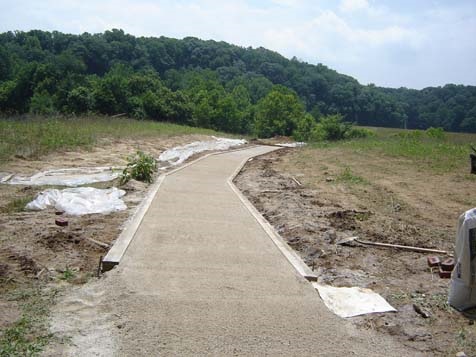
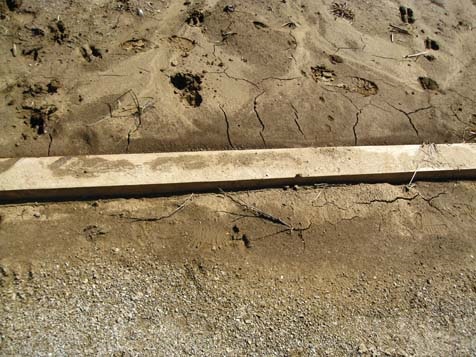
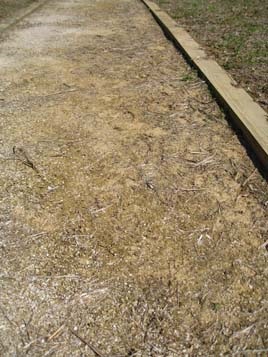
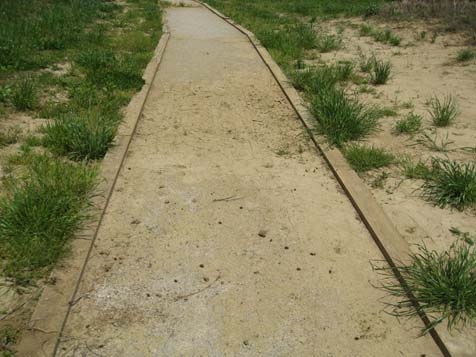
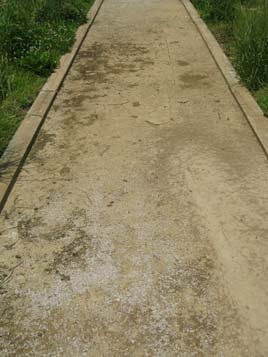
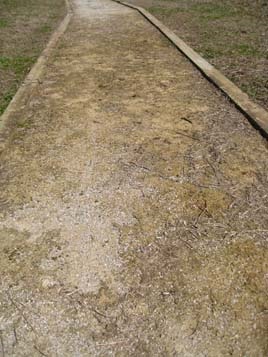
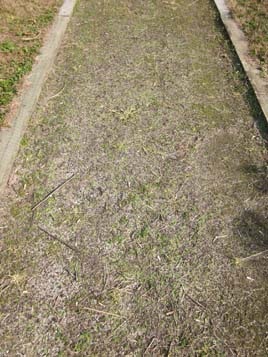
The trail segment is composed of two three inch lifts of ¾ inch minus limestone and approximately 50 percent dust. This trail segment is 5 feet wide by 200 feet long. The segment contains timber edging. This trail segment maintained itself well in dry temperatures (June – August; 100 degree temps), remaining hard and compacted under foot. After the same two days of uncharacteristically heavy rainfall (as noted in the ¼ inch minus segment), the surface had evidence of water pooling on the surface, as there were lines of pine needles but the surface remained unchanged. It was still firm under foot through the end of the testing in fall. The surface does have a prevalence of the larger fines working their way to the surface, but not affecting the way in which the surface is bound to keep it firm. It would be an item to consider when evaluating the intended use of a trail for those visitors using mobility devices and assistive devices such as crutches and canes.
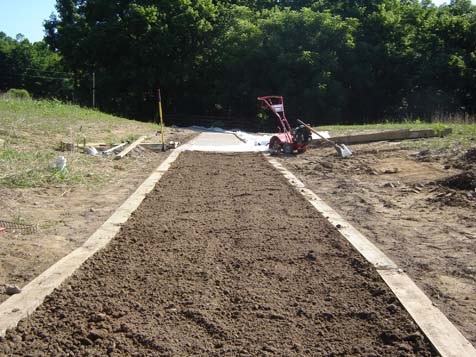
Three Quarter Inch Minus Limestone trail segment is composed of two three inch lifts with 50 percent dust. August 1, 2007.
Three Quarter Inch Minus Limestone trail segment with 50 percent dust has first lift compacted. August 1, 2007.
Three Quarter Inch Minus Limestone with 50 percent dust after first lift is compacted. August 1, 2007.
Three Quarter Inch Minus Limestone trail segment has second lift installed. August 3, 2007.
Three Quarter Inch Minus Limestone trail segment has second lift compacted. August 3, 2007.
Three Quarter Inch Minus Limestone with 50 percent dust after two lifts installed and compacted. August 6, 2007.
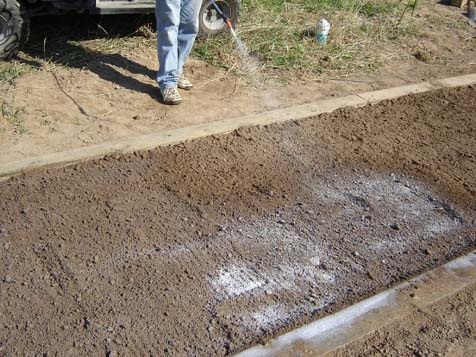
Three Quarter Inch Minus Limestone trail segment where water pooled after rain. March 13, 2008.
Three Quarter Inch Minus Limestone trail segment where water pooled after rain. March 13, 2008.
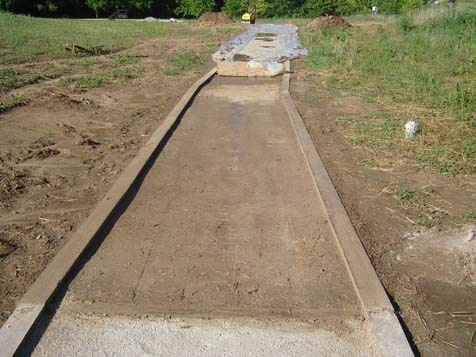
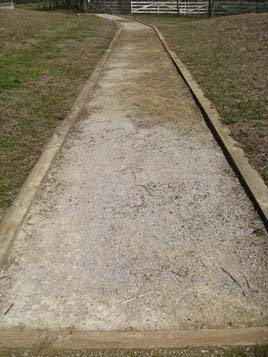
Three Quarter Inch Minus Limestone trail segment almost one year after installation. June 12, 2008.
Three Quarter Inch Minus Limestone trail segment remained firm under foot. March 17, 2009.
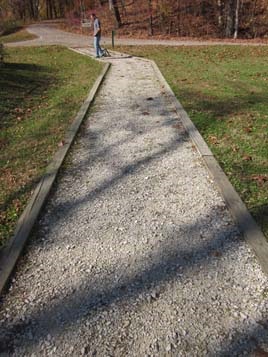
Three Quarter Inch Minus Limestone trail segment showed prevalence of larger fines working their way to the surface. November 2, 2011.
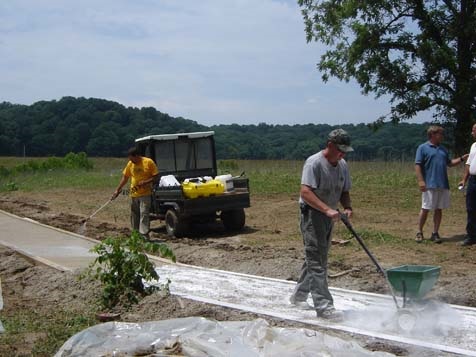
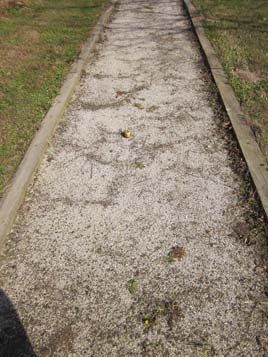
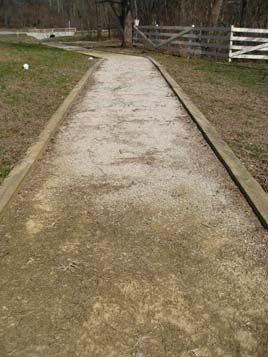
Klingstone 400
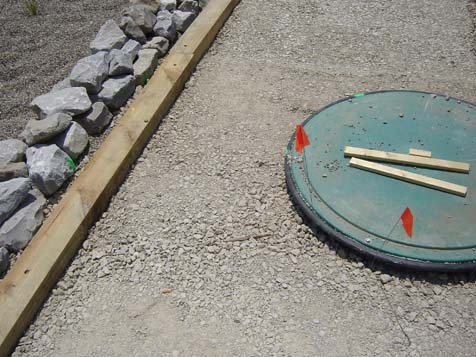
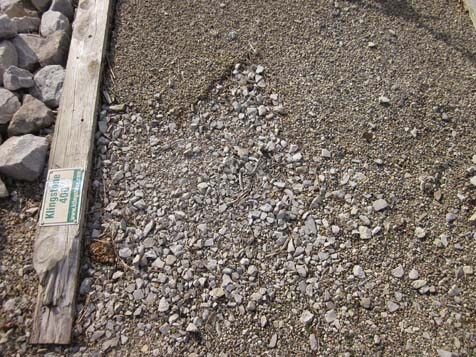
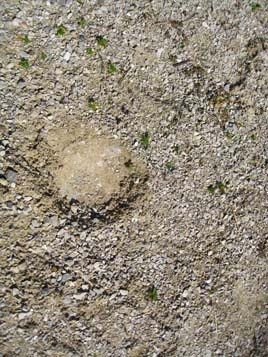
The trail segment is composed of the stabilizer, Klingstone 400 and is 5 feet wide by 104 feet long. The segment contains timber edging. The Klingstone 400 is applied to materials on top of a base, which is composed of 4 inches of ¾ inch minus limestone and dust. The top-dress is 2 inches of ¼ inch washed pea gravel (round river rock) sprayed with Klingstone 400 to seal the pea gravel. Over time, the only noticeable changes to the surface are a fading of the color (which started as an “amber”, has washed out because of sun exposure, and is blending with the surroundings) and a very small amount of loose fines coming to the surface. The surface was installed around a sewage drain and was not broken away from or deteriorated around it.
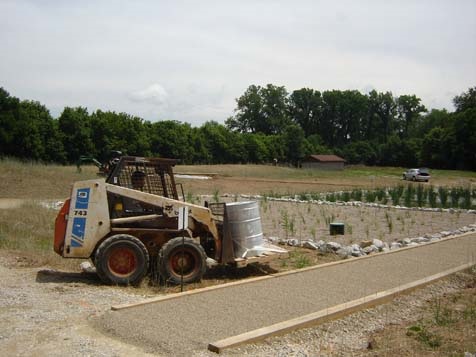
Klingstone base preparation of ¾ inch minus limestone and dust. June 13, 2007.
Klingstone base preparation of ¾ inch minus limestone and dust. June 13, 2007.
Klingstone top dress preparation of ¼ inch washed pea gravel (round river rock). June 16, 2007.
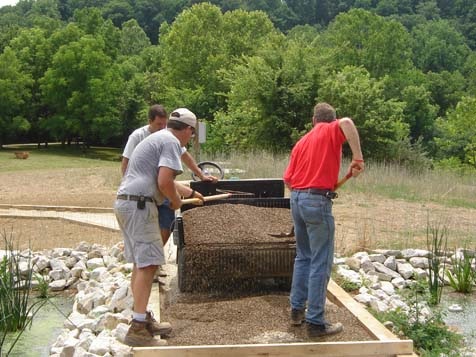
Klingstone top dress ¼ inch washed pea gravel is prepared. June 16, 2007.

Klingstone top dress ¼ inch washed pea gravel is leveled. June 16, 2007.
Klingstone trail segment is prepared for spray application. June 16, 2007.
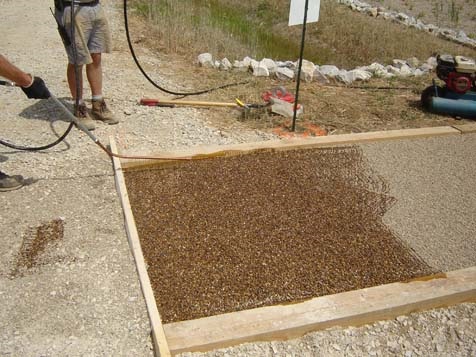
Top dress is sprayed with Klingstone 400 to seal the pea gravel. June 16, 2007.
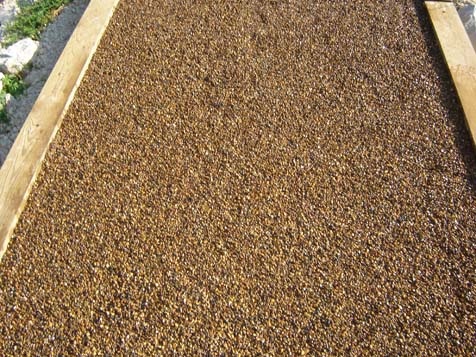
Klingstone 400 has been sprayed to top surface. June 16, 2007.
Klingstone 400 spray left to dry. June 16, 2007.
Klingstone trail surface more than a month after installation. August 1, 2007.
Klingstone amber color has started to fade. October 19, 2007.
Klingstone surface almost a year after installation. May 6, 2008.
Klingstone loose fines coming to surface. March 17, 2009.
Klingstone almost two years after installation has small amount of loose fines coming to surface. March 17, 2009.
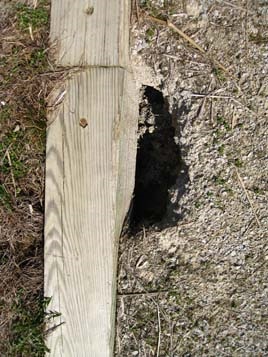
Klingstone at beginning of trail segment has started to wash out. November 22, 2011.
Klingstone at beginning of trail segment has started to wash out. November 22, 2011.
Klingstone surface has started to recede from timber edging. November 22, 2011.
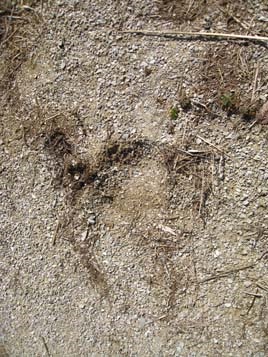
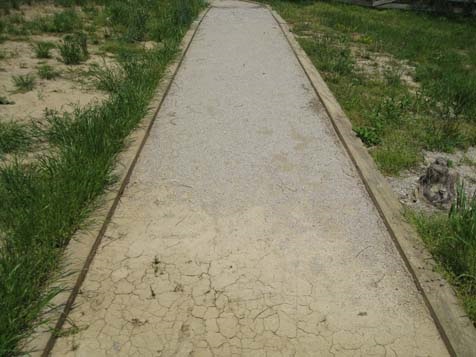
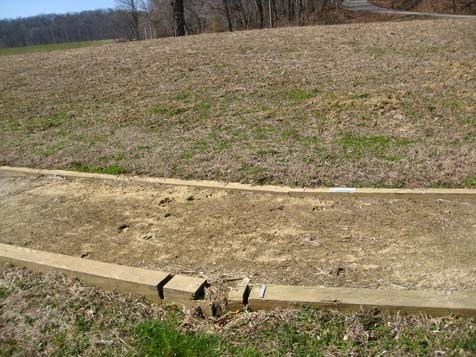
Polypavement
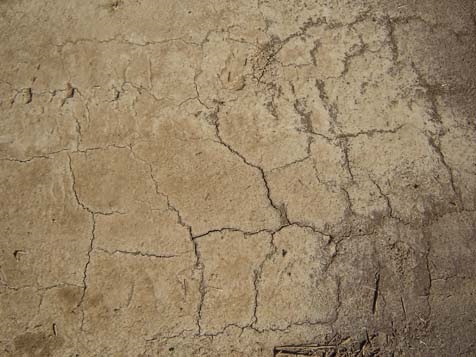
The trail segment is composed of the stabilizer, Polypavement and is 5 feet wide by 30 feet long. The segment contains timber edging. The Polypavement is applied to a base of compacted native soils and is then mixed into an additional 2 inches of tilled soil. The surface started to show signs of cracking, sinking and softening after the first round of tests when the temperature was still mild and warm (June – August; 100 degree temps). After uncharacteristically heavy rainfall, the surface became the same texture as mud. Upon drying up, the surface remained cracked and was heaving along the full width of the trail. The material just under the surface of the segment, contains cracks and heaving and stayed wet and therefore soft under foot. NCA continued to test the surface to ensure consistency in data collection, despite the initial impression that the Polypavement application was not maintaining itself. It appeared that the top layer of the surface was all that was left of the stabilizer and the remaining surface had returned to its natural soil state. The assumption is that this surface, because of its natural soil base, never got the opportunity to set up properly because it was installed in wetlands where the soil naturally maintains more moisture.
Polypavement is applied to a base of compacted native soils and mixed into an additional 2 inches of tilled soil. July 3, 2007.
Polypavement is applied to a base of compacted native soils and mixed into an additional 2 inches of tilled soil. July 3, 2007.
Polypavement trail segment started to show signs of cracking and softening after the first round of tests. July 6, 2007.
Polypavement trail segment started to show signs of cracking and softening after the first round of tests. July 6, 2007.
Polypavement trail segment shows cracking. July 6, 2007.
Polypavement trail segment after heavy rains remained cracked. August 9, 2007.
Polypavement trail segment with cracks and heaving along width of trail. October 19, 2007.
Polypavement trail segment would dry with cracks and heaving after heavy rail. March 13, 2008.
Polypavement trail segment would remain soft underfoot. March 13, 2008.
Polypavement trail segment shows cracks. May 6, 2008.
Polypavement trail segment a year after installation shows top layer is all that is left of the stabilizer. June 12, 2008.
Polypavement trail segment almost two years after installation shows top layer of stabilizer and remaining surface returned to its natural soil base. March 17, 2009.
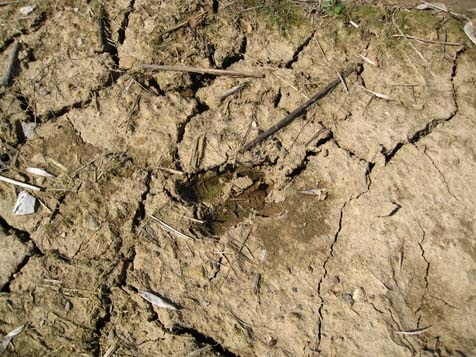
Polypavement trail segment may not have set up properly due to the moist soil of the wetlands. March 17, 2009.
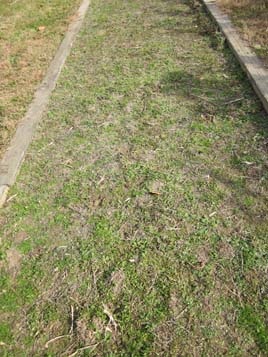
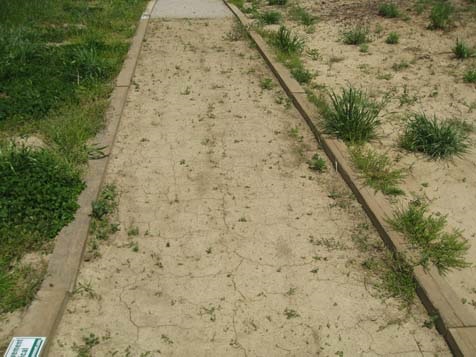
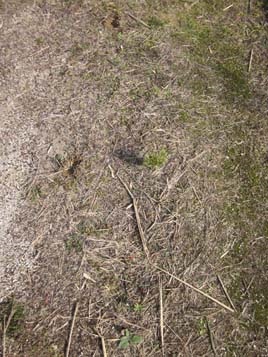
Polypavement trail segment overgrown with vegetation. November 2, 2011.
Soiltac Liquid Mix-In
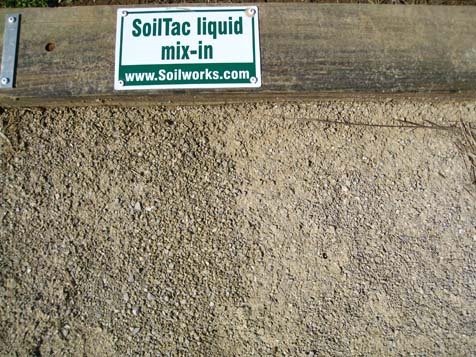
The trail segment is composed of the stabilizer, Soiltac Liquid Mix-in and is 5 feet wide by 30 feet long. The segment contains timber edging. The Soiltac Liquid Mix-in is applied to a base of 2 inches of native soil. Soiltac Liquid Mix-in is then tilled into 4 inches of ¼ inch minus loose limestone aggregate. The surface is compacted and then sprayed to seal. The stabilizer has a penetration depth of 4 inches. After the first heavy rainfall, the surface seemed to maintain itself well. It was only slightly soft under foot, showing footprint indentations, but seemed to firm back up. There were no noticeable drainage issues for this surface. This segment performed better than its topical application counterpart (see the note in the liquid topical application).
Soiltac Liquid Mix-In is applied to a base of 2 inches of native soil. June 27, 2007.
Soiltac Liquid Mix-In is then tilled into 4 inches of ¼ inch minus loose limestone aggregate. June 27, 2007.
Soiltac Liquid Mix-In is then tilled into 4 inches of ¼ inch minus loose limestone aggregate. June 27, 2007.
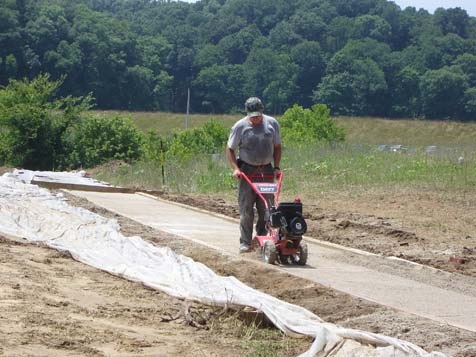
Photo 58 Soiltac Liquid Mix-In surface is tilled. June 27, 2007.
Soiltac Liquid Mix-In trail segment is leveled. June 27, 2007.
Soiltac Liquid Mix-In trail segment is prepared. June 27, 2007.
Soiltac Liquid Mix-In trail segment is compacted. June 27, 2007.

Soiltac Liquid Mix-In trail segment is sprayed to seal with a penetration of 4 inches. June 27, 2007.
Soiltac Liquid Mix-In trail segment seemed to maintain itself well. March 13, 2008.
Soiltac Liquid Mix-In trail segment was only slightly soft under foot, showing footprint indentations. March 13, 2008.
Soiltac Liquid Mix-In more than one year after installation seemed to maintain itself. June 12, 2008.
Soiltac Liquid Mix-In almost two years after installation. March 17, 2009.
Soiltac Liquid Mix-In segment performed better than its topical application counterpart. March 17, 2009
Soiltac Liquid Mix-In performed better than its topical application counterpart. November 2, 2011.
Soiltac Liquid Topical
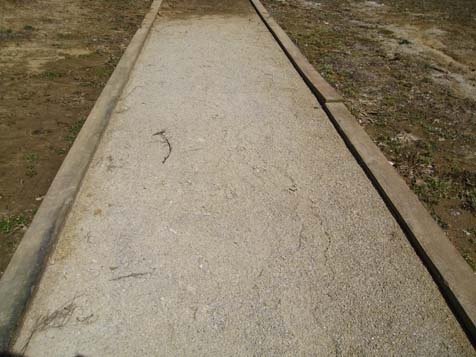
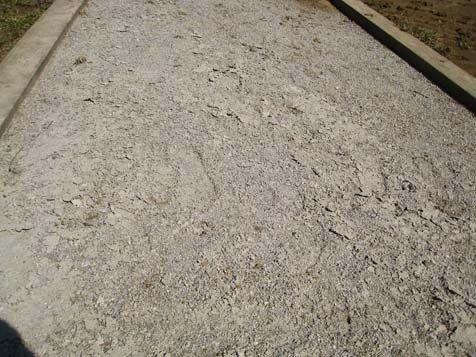
The trail segment is composed of the stabilizer, Soiltac Liquid Topical, and is 5 feet wide by 30 feet long. The segment contains timber edging. The Soiltac Liquid Topical is applied to a base of 2 inches of native soil. Soiltac Liquid Topical is mixed with water and sprayed onto 4 inches of ¼ inch minus compacted limestone aggregate. The stabilizer has a penetration depth of 1/8 inch. The first noticeable signs of change for this surface came after the first heavy rainfall at the March 2008 testing. The surface showed signs of runoff and became soft under foot (footprints were evident). The surface remained soft under foot through the final testing, but some areas even more so than other areas where the water had pooled and the surface had not firmed back up. Upon the advice of the stabilizer company, topical applications should not be utilized to stabilize trail surfaces, but are to be utilized when dust control and erosion is necessary. It can be applied to mix-in stabilizers during the installation and during maintenance to help achieve a more firm and stable surface.
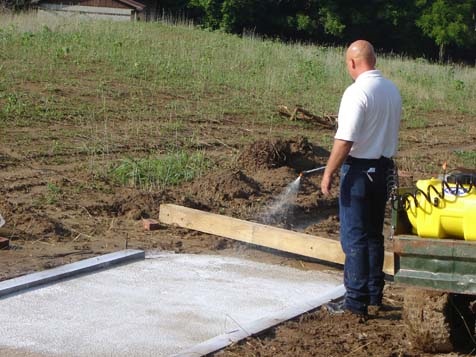
Soiltac Liquid Topical is applied to a base of 2 inch native soil, mixed with water and sprayed onto 4 inches of ¼ minus compacted limestone aggregate. June 27, 2007.
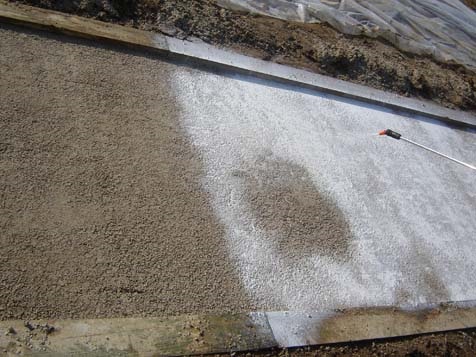
Soiltac Liquid Topical has a penetration depth of 1/8 inch. June 27, 2007.
Soiltac Liquid Topical trail segment showed change after a heavy rainfall. March 13, 2008.
Soiltac Liquid Topical trail segment became soft under foot. March 13, 2008.
Soiltac Liquid Topical trail segment showed signs of runoff. March 13, 2008.
Soiltac Liquid Topical trail segment remained soft where water had pooled. May 6, 2008.
Soiltac Liquid Topical trail segment remained soft where water had pooled. March 17, 2009.
Soiltac Liquid Topical trail segment showed footprints. March 17, 2009.
Soiltac Liquid Topical trail segment showed runoff. March 17, 2009.
Soiltac Liquid Topical trail segment remained soft through the final testing. November 2, 2011.
Soiltac Liquid Topical trail segment remained soft through the final testing. November 2, 2011.
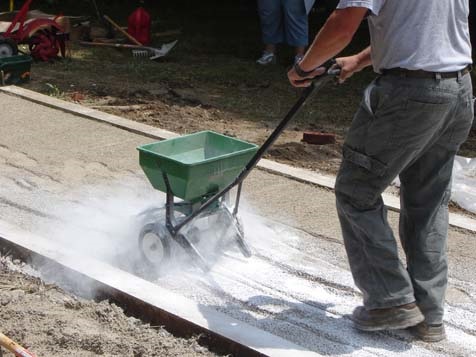
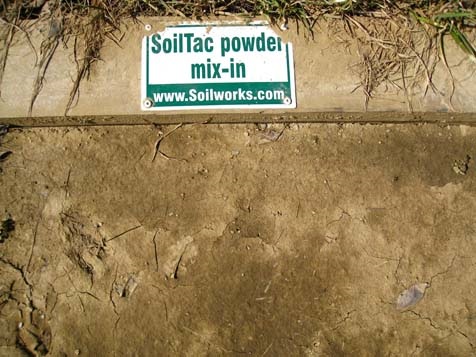
Soiltac Powder Mix-In
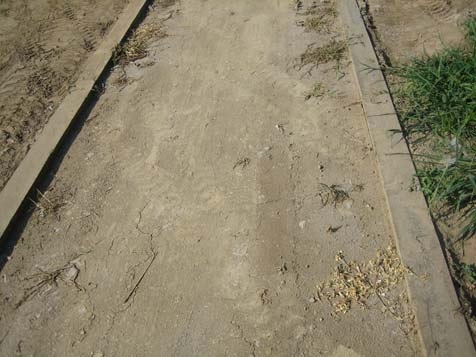
The trail segment is composed of the stabilizer, Soiltac Powder Mix-in, and is 5 feet wide by 30 feet long. The segment contains timber edging. The Soiltac Powder Mix-in is applied to a base of 2 inches of native soil. Soiltac Powder Mix-in is applied to the surface with a spreader, tilled, smoothed, and then compacted. It is then sprayed to seal the surface. The stabilizer has a penetration depth of 4 inches. This trail segment maintained itself through to the last date of testing, with only minor evidence of the surface softening, but always becoming firm again. There was no constructed drainage mechanisms that would be considered appropriate in the trail construction industry for this surface, therefore the water runoff from the adjacent earth mound flowed directly across this segment. Where there was water flow crossing the segment, the surface was soft under foot but returned to a natural surface state.
Soiltac Powder Mix-In is applied to a base of 2 inches of native soil. June 27, 2007
Soiltac Powder Mix-In is applied to a base of 2 inches of native soil. June 27, 2007.

Soiltac Powder Mix-In is tilled into the 2 inch base of native soil. June 27, 2007.
Soiltac Powder Mix-In has a penetration depth of 4 inches. June 27, 2007.
Soiltac Powder Mix-In is smoothed and compacted. June 27, 2007.

Soiltac Powder Mix-In is sprayed to seal the surface. June 27, 2007.
Soiltac Powder Mix-In almost a year after installation. March 13, 2008.
Soiltac Powder Mix-In trail segment maintained its condition a year after installation. March 13, 2008.
Soiltac Powder Mix-In softened surface would become firm again. May 6, 2008.
Soiltac Powder Mix-In almost two years after installation. March 17, 2009.
Soiltac Powder Mix-In does not have a constructed drainage mechanism considered appropriate for trail construction. March 17, 2009.
Soiltac Powder Mix-In showed only minor evidence of softening at the end of the study. November 2, 2011.
Soiltac Powder Mix-In trail segment with water crossing would soften and then return to natural surface state. November 2, 2011.
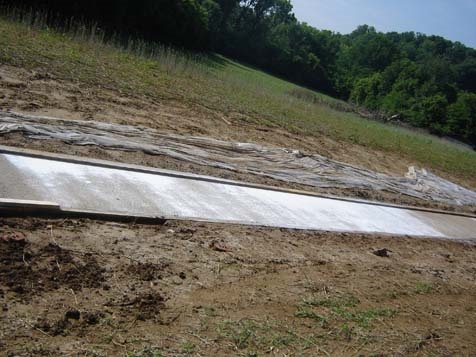
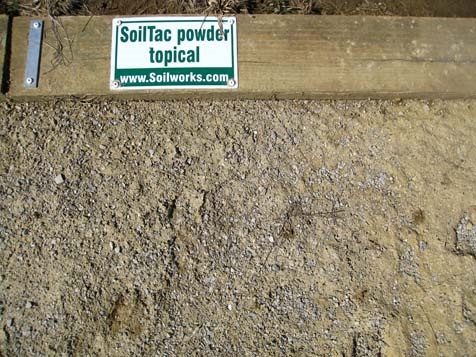
Soiltac Powder Topical
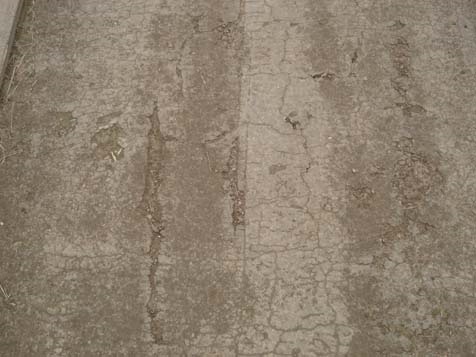
The trail segment is composed of the stabilizer, Soiltac Powder Topical, and is 5 feet wide by 30 feet long. The segment contains timber edging. The Soiltac Powder Topical is applied to a base of 2 inches of native soil. Soiltac Powder Topical is mixed with water and sprayed onto 4 inches of ¼ inch minus compacted limestone aggregate. The stabilizer has a penetration depth of 1/8 inch. As with the other three Soiltac surface applications, the first signs of change for this surface came after the first heavy rainfall at the March 2008 testing. After the rain, the stabilizer formed a solid paper-thin elastic layer on top of the surface. It should be noted that runoff was a problem onto this surface from the adjacent earth mound that was not controlled by constructed drainage. The surface was soft under foot and showed footprints. Like the other Soiltac Topical application, this segment never seemed to firm up. The same guidance is recommended for the Soiltac Powder Topical application as the Soiltac Liquid Topical application. Upon the advice of the stabilizer company, topical applications should not be utilized to stabilize trail surfaces, but are to be utilized when dust control and erosion is necessary. It can be applied to mix-in stabilizers during the installation and during maintenance to help achieve a more firm and stable surface.
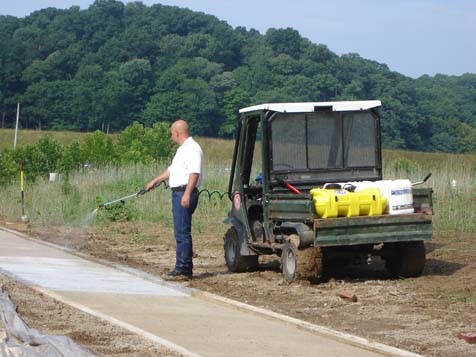
Soiltac Powder Topical is applied to a base of 2 inches of native soil and 4 inches of ¼ inch minus compacted limestone aggregate. June 27, 2007.
Soiltac Powder Topical is applied to a base of 2 inches of native soil and 4 inches of ¼ inch minus compacted limestone aggregate. June 27, 2007.
Soiltac Powder Topical has a penetration of 1/8 inch. June 27, 2007.
Soiltac Powder Topical has formed a solid paper-thin layer after a heavy rainfall. March 13, 2008.
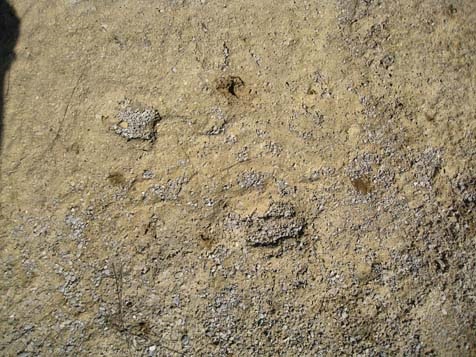
Soiltac Powder Topical was soft under foot and showed footprints. March 13, 2008.
Soiltac Powder Topical with runoff from adjacent landscape. March 13, 2008.
Soiltac Powder Topical almost a year after installation. May 6, 2008.
Soiltac Powder Topical one year after installation. June 12, 2008.
Soiltac Powder Topical almost two years after installation. March 17, 2009.
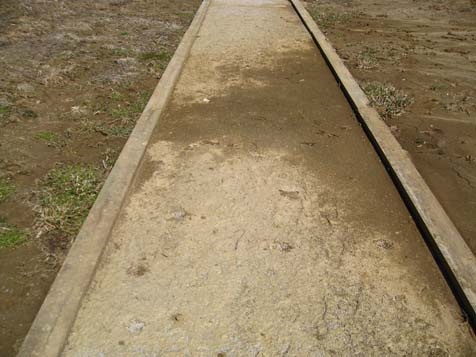
Soiltac Powder Topical more than four years after installation. November 2, 2011.
Stabilizer
The trail segment is composed of the stabilizer, Stabilizer, and is 5 feet wide by 50 feet long. The segment contains timber edging. The Stabilizer is applied to a base of 3 inches of compacted native soils. Stabilizer arrives pre-mixed with ¼ inch minus aggregate and is applied at a 3-inch depth on top of the base. The surface maintained itself for the most part through the first round of testing after installation (June – August; 100 degree temps) with the exception of loose fines that appeared on the surface. After the heavy rainfall, the surface had runoff composed of the loose fines from the trail segment. It was not until the testing conducted in March 2008 that the surface showed large signs of deterioration. There were gullies created in the surface because of runoff; these were found both down the middle of the trail segment and along the timber edging. The surface would need maintenance to return it to its original state.
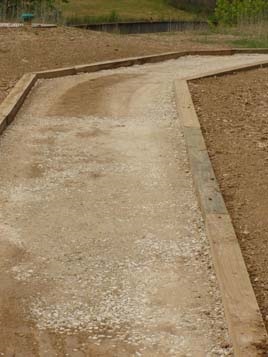
Stabilizer is applied to a base of 3 inches of compacted native soil. June 19, 2007.
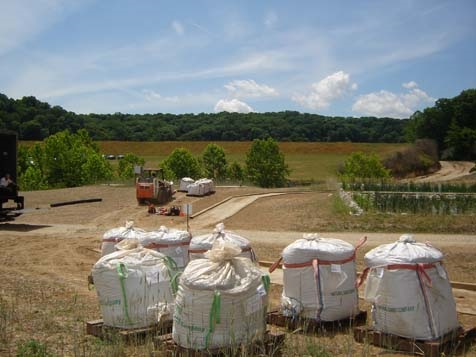
Stabilizer arrives pre-mixed with ¼ inch minus aggregate. June 19, 2007.
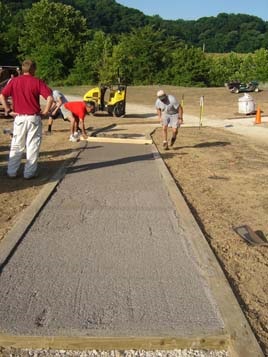
Stabilizer is applied at a 3 inch depth on top of the base. June 21, 2007.
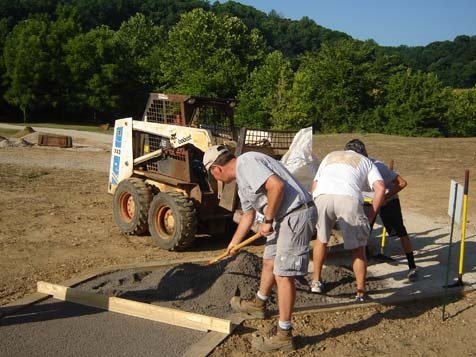
Stabilizer trail segment is leveled at installation. June 21, 2007.
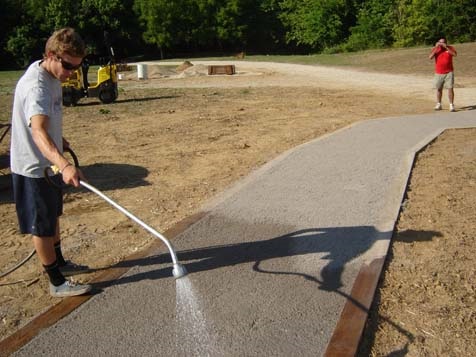
Stabilizer trail segment is prepared. June 21, 2007.
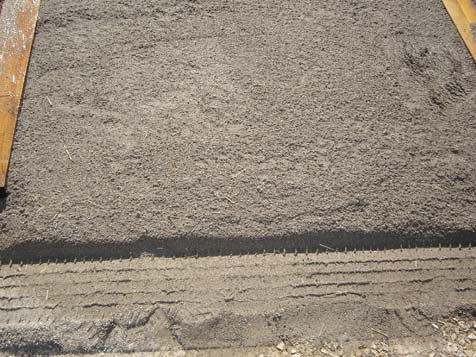
Stabilizer trail segment is prepared. June 21, 2007.
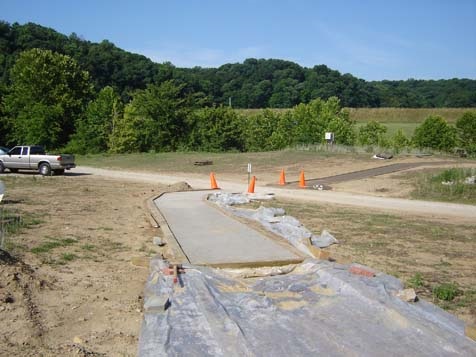
Stabilizer trail segment installation. July 3, 2007.
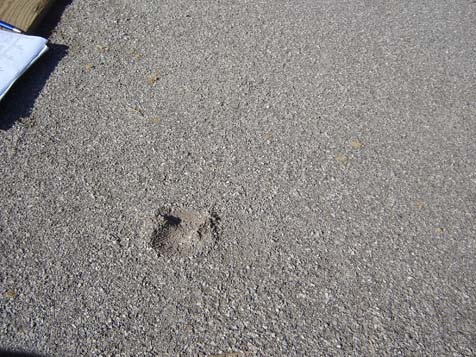
Stabilizer surface shows an indentation from the surface testing. July 6, 2007.
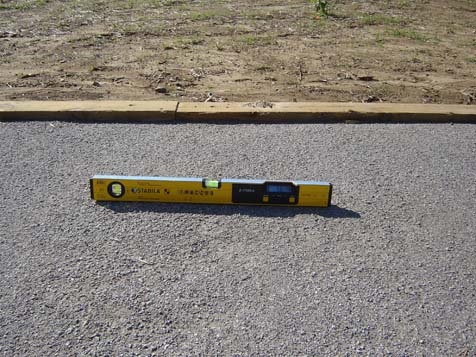
Stabilizer trail segment shows loose fines at top of surface. July 6, 2007.
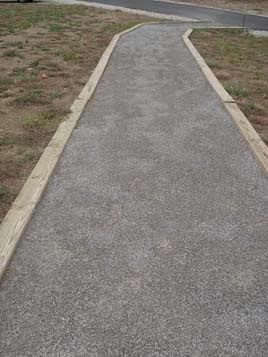
Stabilizer trail segment shows loose fines at top of surface. October 19, 2007.
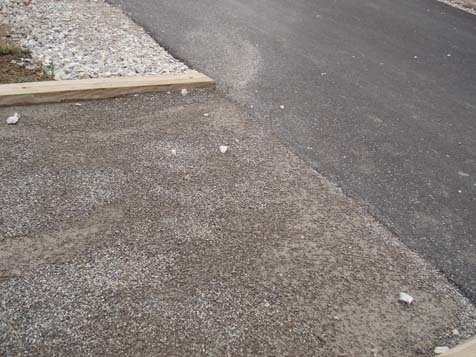
Stabilizer trail segment shows loose fines at top of surface. October 19, 2007.
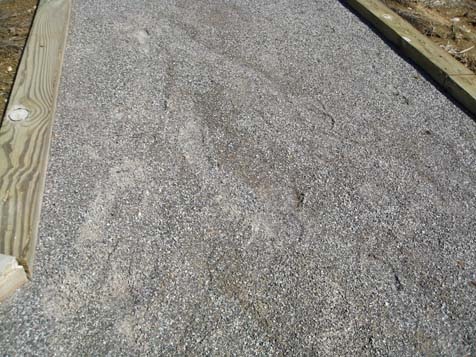
Stabilizer trail segment has runoff from heavy rainfall. March 13, 2008.
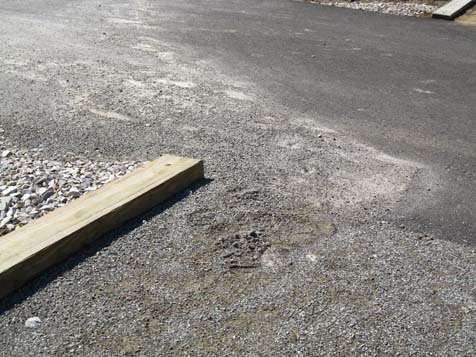
Stabilizer trail segment shows loose fines from heavy rainfall. March 13, 2008.
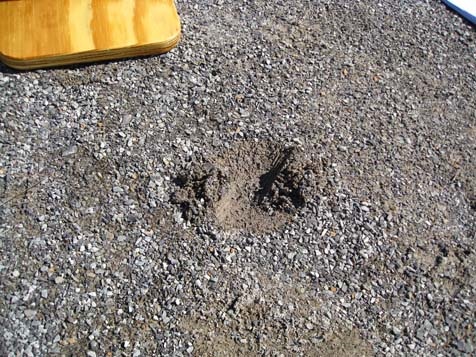
Stabilizer trail segment shows indentation from surface testing. March 13, 2008.
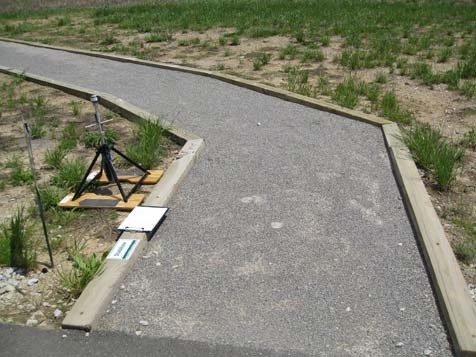
Stabilizer trail segment more than a year after installation. May 6, 2008.
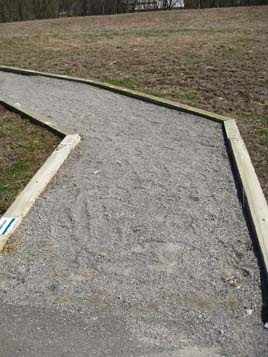
Stabilizer trail segment almost two years after installation. March 17, 2009.
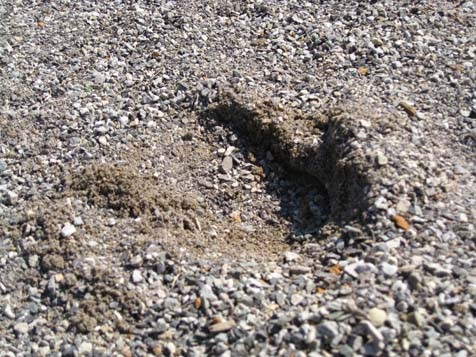
Stabilizer trail segment shows gullies created in surface from runoff. March 17, 2009.
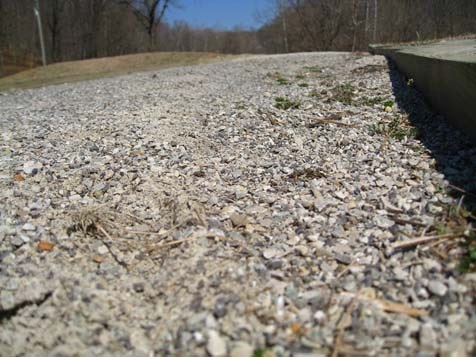
Stabilizer trail segment shows deterioration from runoff along timber edging. March 17, 2009.
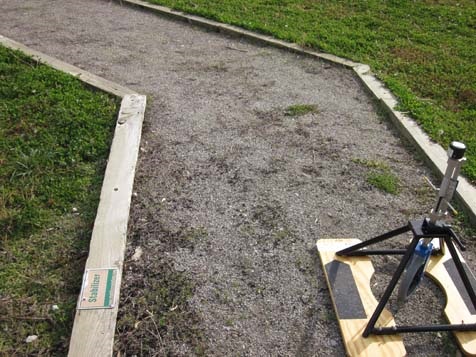
Stabilizer trail segment shows deterioration. November 2, 2011.
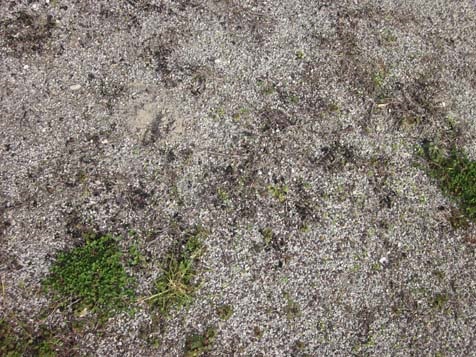
Stabilizer trail segment shows deterioration in middle of the trail. November 2, 2011.
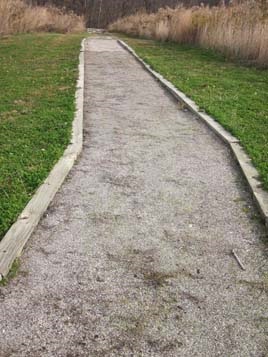
Stabilizer trail segment shows deterioration along timber edging. November 2, 2011.
StaLok
The trail segment is composed of the stabilizer, StaLok, and is 5 feet wide by 72 feet long. The segment contains timber edging. The StaLok is applied to a base of 3 inches of compacted native soils. StaLok arrives pre‐mixed with ¼ inch minus aggregate and is applied at a 2-inch depth on top of the base. The surface maintained itself through the first round of testing (June – August; 100 degree temps). During the testing performed in August 2007, it was noted that an individual had walked on the surface at the Wetlands dedication and left marks in the surface of a depth of approximately ½ inch. Upon returning a couple months later, not for testing, it was noted that the surface had repaired itself. The surface also had the pattern of behaving this way when maintenance vehicles rode over it as well. After the heavy rainfall, the only noticeable factor was pooling of the water on the lower points of the surface; StaLok is impervious so it repels the water. The surface remained firm and stable. The other noticeable effects of the surface noted during the March 2008 testing were cracking approximately 6 inches from the timber edging.
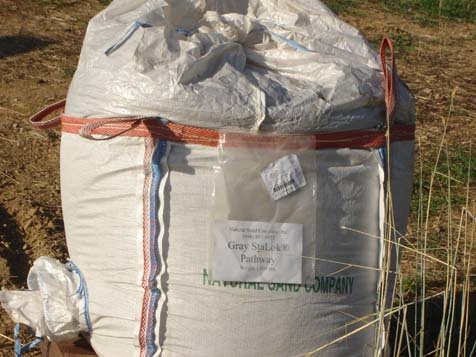
StaLok arrives pre-mixed with ¼ inch minus aggregate. June 21, 2007.
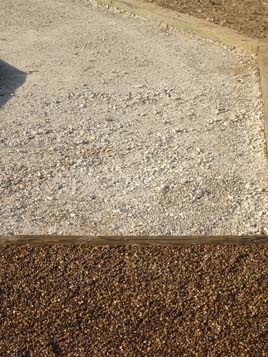
StaLok is applied to a base of 3 inches of compacted native soil. June 21, 2007.
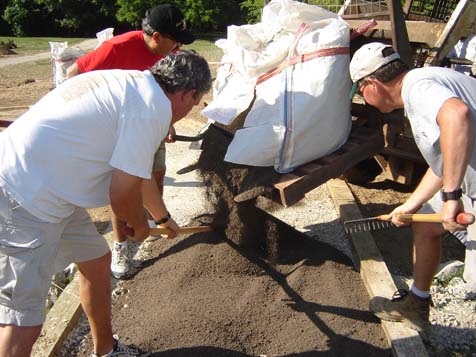
StaLok is applied at a 2 inch depth on top of the base. June 21, 2007.
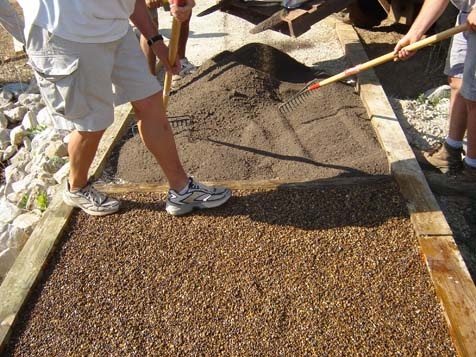
StaLok is applied at a 2 inch depth on top of the base. June 21, 2007.
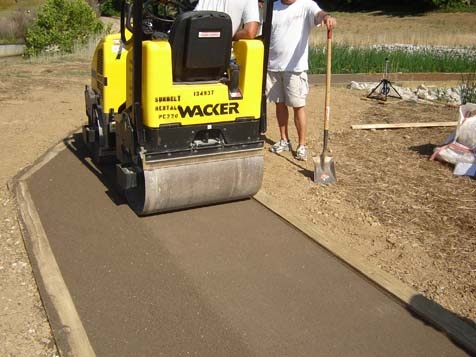
StaLok surface is compacted. June 21, 2007.
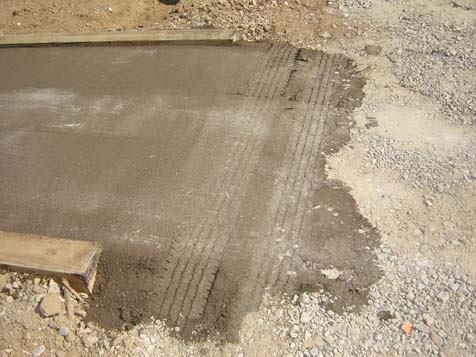
95 StaLok surface is compacted. June 21, 2007.
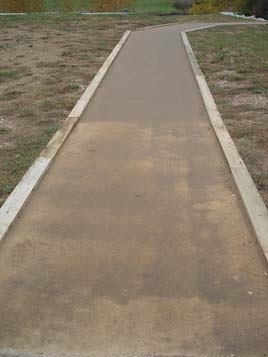
StaLok trail segment maintained itself through first round of testing. October 19, 2007.
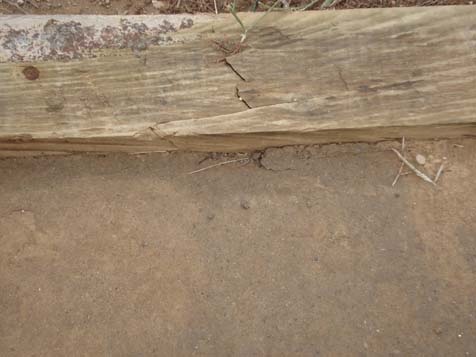
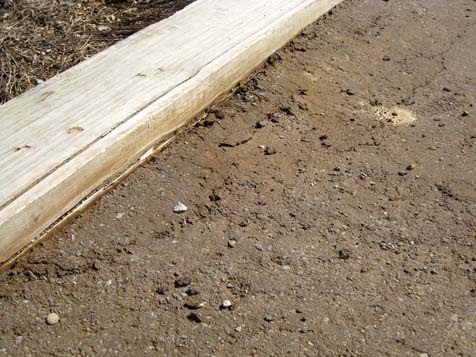
StaLok trail surface had a pattern of wear and repairing itself. March 13, 2008.
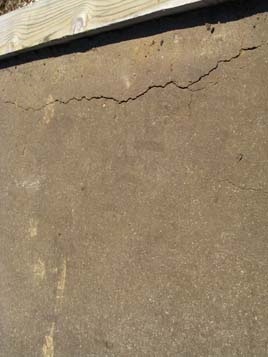
StaLok trail segment was noted for repairing itself. March 13, 2008.
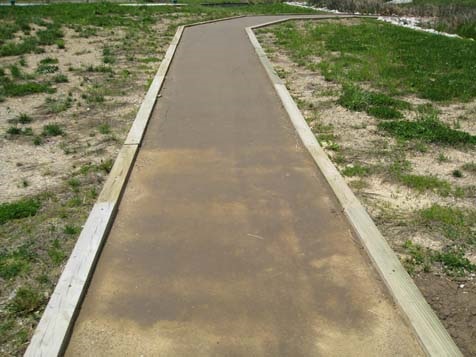
StaLok trail segment was noted for showing indentations and then repairing itself. May 6, 2008.
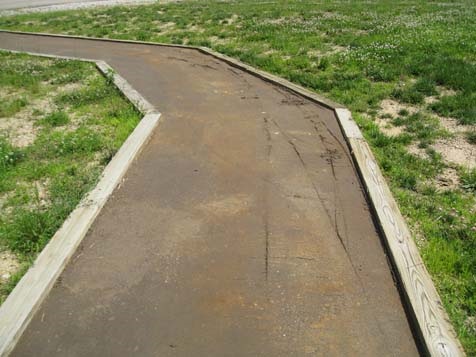
StaLok trail segment with wheelchair marks would repair itself. June 12, 2008.
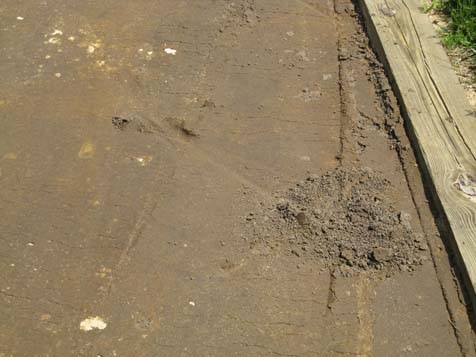
StaLok trail segment with wheelchair marks would repair itself. June 12, 2008.
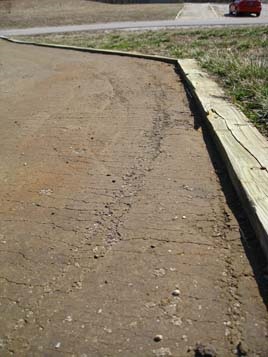
StaLok trail segment previously shown with marks had repaired itself. March 17, 2009.
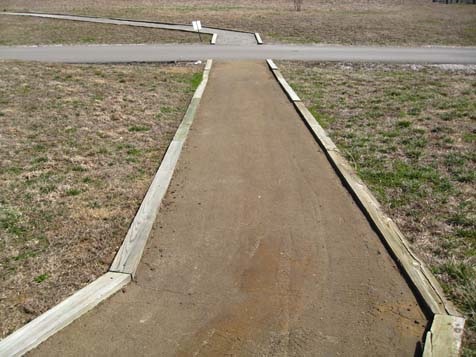
StaLok trail segment previously shown with marks had repaired itself. March 17, 2009.
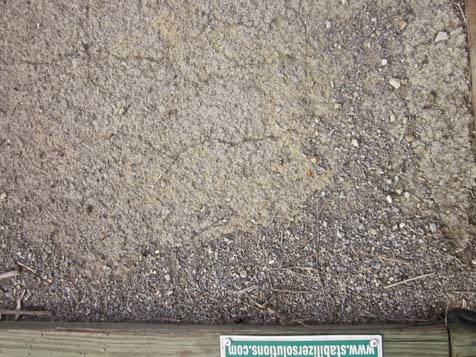
StaLok trail segment shows cracking next to timber edging. November 2, 2011.
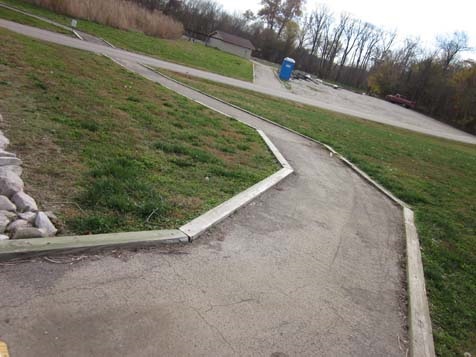
StaLok trail segment had some pooling of water at lower points of the surface. November 2, 2011.
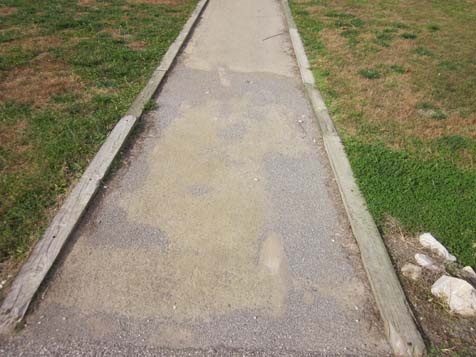
StaLok trail segment with pooling of water. November 2, 2011.
StaLok trail segment maintained itself through first round of testing. October 19, 2007.
Photos were also collected at various points in the 51 months, always at testing and occasionally through the length of the study when major weather and/or events happened. Included in Appendix D are photos of some of the significant changes to the surfaces mentioned above and some additional photos to offer a different glimpse of the surfaces.
Summary of Results
The qualitative and quantitative data show that the trail segments constructed of ¾ inch minus limestone aggregate, Klingstone 400 soil stabilizer, and StaLok stabilizer maintained a more consistently firm and stable surface than the other trail segment surface materials. The implications of these preliminary data are that a trail composed of an all-aggregate material, when constructed to the above-mentioned parameters, could be maintained with little to no maintenance as a firm and stable surface. The intent of the study was to discover a natural surface trail material that utilized a soil stabilizer or aggregate material. However, recommendations for future study call for a cost comparison of aggregate versus soil stabilizer trail surface materials, therefore depending on the results of future research, the best alternative to a concrete, asphalt or boardwalk surface, could be an aggregate surface trail because of the lower cost of aggregate.
Recommendations for Future Research
The evaluation of the 11 trail surface materials in this study has provided valuable information in regards to soil stabilizers and natural aggregate trails installed in the Midwest region. Research of this kind did not exist until the formulation of this study. The information obtained from this study can serve as a point of reference for other entities in the Midwest region that will be installing natural surface trails on areas with low volume of traffic.
Environmental factors such as rain, frost, and thaw conditions, shaded versus sunny trail segments, soil composition, and natural drainage play a critical role in the firmness and stability of a trail surface. Utilizing the data collected from this study to compare to installations of the same materials in other regions of the country are necessary.
The data collected for each trail segment denotes that all of the trail surfaces meet some varying degree of firmness and stability; further research should be conducted using human test subjects to determine the accuracy of the degrees of firmness and stability. A larger sample of individuals with disabilities who use a variety of different mobility devices (manual and power wheelchairs, walkers, crutches, etc.) should be tested on these surfaces.
A cost comparison of natural aggregate trail surfaces and trail surfaces that are composed of soil stabilizers should be conducted. This cost comparison should involve the cost of the product, the cost of any additional aggregate necessary for stabilizer mix and/or the trail base, the equipment and labor costs associated with the installation, and the maintenance costs associated with ensuring the surface maintains itself as a firm and stable surface. The long-term maintenance costs for different surfaces could drive the purchasing decision and have greater influence with decision makers if more research data on this question were available to trail managers.
Part II. National Trail Surface Survey Final Report
I. Introduction
Purpose
In a collaborative effort between the U.S. Access Board, the National Center on Accessibility, and Oklahoma State University, researchers sought to provide qualified professionals, resource specialists and operations staff of parks and other recreational properties with trails in the United States with descriptive and/or comparative information about the status of construction practices of pedestrian/hiker, natural surface trails The purpose of the survey research study was to gain insight from professionals affiliated with trail management pertaining to trails’ construction, repair, and maintenance activities. This study’s objective was to gather information about current natural surface trail construction, the products or applications used on the trails’ surfaces, and the effectiveness of the surfaces to last.
Background
The diversity of trails in this country is only matched by the diversity of environments in which they are located. A surface that might be firm and stable in one region of the country may be not firm and not stable in another; a surface that may be firm and stable in July may be not firm and not stable in December; and a surface that was firm and stable last year, may be not firm and not stable this year. These are just a few of the problems faced by Land Managers who are trying to make decisions on natural surfacing materials that create a firm and stable trail. Currently, there are not enough answers to provide to Land Managers because qualitative data on existing natural surface trails has not been compiled and distributed for specific regions.
As previously reported, the original intent of the National Trail Surface Study was to gather longitudinal data on different natural trail surface materials across a variety of regions throughout the United States to determine the impact of climatic influences and their effect on firmness and stability of those surfaces over time. Owing to the downturn in economic and human resources starting in 2008, parks that had previously committed to participate in the study withdrew, leaving only the original site (Bradford Woods) for testing over the 51 months data were collected. In an effort to gain insight into the types of natural surface materials being used on trails nationally, the researchers proposed a new course of study to gather data via survey method. The new scope of work was to conduct a study of trail managers to gain information on trail construction, repair, and maintenance. The intended outcome was to establish and maintain a database of regionally relevant information on trail surface materials and construction practices. Oklahoma State University was commissioned in 2011 to develop and conduct a survey of trail managers to ascertain information about natural trail surface materials, and construction practices used in different region of the country. The accessibility of the trails and surface materials were not a focus of this survey.
II. Research Methodology
Beginning in 2010 NCA and the Access Board began strategizing on how to provide a useful resource to trail managers on what natural surface materials were being used regionally across the country, and what maintenance issues were associated with different surface materials. There was increasing interest and demand for information about what natural surface materials would be blend into various environments, be eco‐friendly, suitable in different climates, terrains, and remain firm and stable for visitors with disabilities. The creation of a database to which information could be initially populated through a survey of trail managers, maintenance issues updated at least semi‐annually and available for use by the public was the desired outcome.
Prior to participating in this survey, prospective participants were advised to spend some time gathering information pertaining to research elements (trail’s geographic information, surface product information, decisions related to trails etc.). Initially, it was decided that the survey would run for four (4) rounds; however results from the first round made it evident to the research team and the funding agencies that modifications were necessary not only pertaining to the initial instrument, but to the targeted populations. Therefore, a new database, which consisted of the names of all Recreational Trails Program administrators, was constructed based on a contact list with email addresses which was posted on the website of American Trails Organization. Additionally, the research team was able to gather new contact information of trail professionals through networking in a conference. In total, three panels of prospective professionals were created.
Selection of Methodology
The National Center on Accessibility subcontracted with Oklahoma State University (OSU) to develop a research methodology to collect initial data from which a database of trails could be established and to which data could be added and updated over time. A repeated survey measurements method was chosen by which survey respondents would initially complete survey questions within eight research sections:
SECTION #1 Geographic, demographic, and political information (type of management agency, park location, trail name, age of trail, length of trail, traffic on trail, and similar data)
SECTION #2 Trail surface composition (e.g. natural, native, aggregate, soil stabilizer, etc.) information (product type, manufacturer name, warranty/guarantees’ information, and similar data)
SECTION #3 Trail pre‐installation specifications (soil type/composition, slope of surface)
SECTION #4 Sub‐base installation (date of installation, aggregate type used, aggregate depth, installation contractor, and similar data)
SECTION #5 Trail surface installation (date of installation, aggregate type used, aggregate depth, installation contractor, and similar data)
SECTION #6 Maintenance since installation (length of time between installation and first repair, cause for first repair, number of complete replacements, condition of trail’s surface over time)
SECTION #7 Quarterly maintenance (number of maintenance activities performed during the last quarter, condition of the trail during the last quarter, and occurred unusual events)
SECTION #8 Photographs of the trail and surrounding environment
Once completed, respondents would then receive a request to update data quarterly on sections 7 and 8 (maintenance issues and photographs of trail changes). The repeated measurements method would allow for a longitudinal view of changes in natural trail surfaces over time.
Selection of Participants
The principal investigators at OSU were to pilot test the survey instruments with professional contacts in parks and recreation that manage pedestrian trails designed, developed, and maintained with the natural surface materials or applicable bonded synthetic materials. These professional practitioners were in communities and agencies located in Oklahoma, north Texas, western Arkansas, and southern Kansas. The survey was originally developed in the SurveyGizmo platform. The final survey was administered in the Qualtrics platform. Appendix E provides the survey, as it was distributed through OSU Qualtrics.
Requests for participation in the survey were announced through the American Trails website, contacts with national trail or accessibility coordinators in the National Park Service, U.S. Forest Service, and Bureau of Land Management.
III. Results of the Study
Two hundred fifty-three professionals were sent the survey, 154 (61%) of which accessed the survey. Prospective participants were asked to answer questions pertaining to inclusion criteria set by the researchers and the funding agencies–whether the trail was predominately pedestrian/hiker and the trail surface was other than asphalt, concrete or boardwalk. Among those who accessed the survey, only 104 professionals were eligible to participate. For a survey for which participation was estimated not to exceed twenty (20) minutes, the duration mean was documented to be 11 hours and 39 minutes. This probably includes considerable time away from the computer during which time the survey remained “open” on the user’s site.
The rate of full completion of the survey questions was extremely low yielding spotty results for comparison. Of the surveys submitted thirty‐nine provided adequate (albeit not complete) basic information related to surface materials types and construction and were extracted for further examination. Responses were received from across the country and from a variety of agency types with the majority coming from state/local government and federal entities (Table 7).
| Table 7. Agency Representation of Respondents | ||
| Agency | n | Percent |
| City agency | 2 | 5.1% |
| County agency | 5 | 12.8% |
| State agency | 10 | 25.6% |
| Federal agency | 19 | 48.7% |
| Non-profit organization | 3 | 7.7% |
| Total | 39 | 100% |
Respondents were asked if the trail on which they reported was designated as accessible. Table 8 shows that of the qualified surveys, 15 indicated their trail was accessible. However, no other defining information (slopes, tread obstacles, etc.) is available to support the level of accessibility of these trails.
| Table 8. Accessible Trail Designation | ||
| Accessible Trail? | n | Percent |
| Yes | 15 | 38.5% |
| No or unknown | 24 | 61.5% |
| Total | 39 | 100% |
The geographic distribution of qualified respondents were scattered across the United States. Figure N illustrates the location of participating trails in twenty‐two states and the District of Columbia.
Figure N. Regional Distribution of Trail
Of the thirty-nine trails reviewed, ninety-two percent used naturals trail surface materials without stabilizers and only 7.7 percent used a stabilizer product. Table 9 shows that the predominant types of trail materials used were either Native/Natural soils (43.6%) or Crushed Rock/Aggregate (51.3%). Interestingly, however, a general observation notes that for trails that were designated as accessible, the trail material used was overwhelmingly Crushed Rock (93%) vs. Native/Natural soils (7%).
| Table 9. Type of Surface Material Used | ||
| Surface Material | n | Percent |
| Aggregate w/stabilizer | 3 | 7.7% |
| Aggregate w/o stabilizer | 17 | 43.6% |
| Native/natural soil w/o stabilizer | 17 | 43.6% |
| Soil w/ high organic content | 2 | 5.1% |
| Total | 39 | 100% |
When asked if the respondent would recommend the trail surface material used, nineteen respondents indicated that they would (48.7%) . Table 10 shows the surface materials recommended by region and surface composition. Also included are comments provided by respondents about the trail surface or maintenance related issues.
| Table 10. Surface Materials Recommended by Region | |||
| Region | Location | Surface Material | Comments |
| ALASKA REGION | |||
| AK | Tek Mix | First repair was a result of 1" rocks coming to the surface. Rocks were gathered and eliminated. The natural "tek mix" which is processed on site compacts really well and has a very long life span. It is a 3/4 inch minus mix consisting of sand gravel, and other natural occurring materials. Trail resurfaced in 2012 with natural and non-natural surfaces. | |
| AK | Naturally occurring glacial moraine & Geotextile Fabric Underlay | We have had amazing success with this trail. The success is largely because of the type of material we are fortunate to work with. However, the use geotextile is imperative to the trails lasting stability as well. The trail required annual maintenance due to uneven wear. | |
| AK | D−1 minus base crushed aggregate; 1/2" minus top dress | With a base of D−1 or larger aggregate and then the addition of 1/2" minus binds the trail with all the fines. With mechanical compaction, the trail can set up. | |
| MIDWEST REGION | |||
| IA | Crushed Limestone | The trail has instances of uneven wear, ruts and washout/runoff quarterly that requires maintenance. Overall the trail is cheap and easy to maintain. | |
| OH | Cohesive soil, dry soil, moist soil | Trail tread renovations involved rebenching native in-place subsoil materials. In our experience we have found that the performance of a natural soil trail surface depends entirely on the slope and alignment and management of water on the trail surface. | |
| KY | Cohesive Soil | The trail required maintenance due to erosion of the trail tread due to washout/runoff. The trail is maintained for washout/runoff and ruts annually. The surface has been replaced one time to lessen erosion. | |
| KY | Dry and granular soils and mulch pine | By using the native soil along with added mulch pine stabilizer the maintenance has held. Trail is easier to use and is being used more often. Stone cribbing was used to increase drainage. | |
| NORTHEAST REGION | |||
| CT | Crushed Rock and stone dust | The trail has instances of washout/runoff annually and has been repaired for erosion. Ruts have been created in the surface resulting from illegal ATV/motorcycle use. Trail material is cheap and low maintenance. | |
| VA | Klingstone 400 | Trail is an excellent surface. Finding a contractor for installation was difficult. Trail has instances of chipping along the edge quarterly. | |
| MA | 1/2" crusher run | 100% crusher run material at 1/2" size compacts very well and holds up extremely well to New England weather. The trail has instances of settling annually. | |
| DE | Crushed rock and fines | We believe, if built properly, stone trails can be very sustainable. This trail has instances of washout/runoff quarterly. | |
| VA | Crushed rock with Gravel Pave II | Originally constructed unsuccessfully as a natural aggregate trail due to washout. Soil Sement was applied for several years but resulted in washout during minor rains. Now Gravel Pave II is being applied to the areas most prone to wash out. While additional materials need to be replenished after a storm, the base of the trail remains intact. Gravel Pave II was selected based on previous use in the Park on a steeper trail, however it penetrates the surface and should be selected with care (in terms of aesthetics) in any historically significant areas. | |
| NE | Sand and 1" minus river run aggregate | It is difficult working with a sand sub-base, so any correspondence with other groups on what they have tried may become a benefit here. This trail is in the heart of the Sand hills. The trail has instances of uneven wear, ruts and washout/runoff. | |
| WESTERN REGION | |||
| CA | Crushed rock | Inexpensive and easily maintained surface material, one drawback is that the surface is not firm and stable enough for strollers or wheelchairs. Trail has instances of ruts and washout/runoff annually. | |
| UT | Crushed rock | The gravel used as the tread surface was primarily rounded particles, which have worked their way to the surface forming a loose layer of pebbles. The tread gravel material should have been an angular rock 3/4" minus with a good component of fines to bind the material together. This coming field season the trail will be capped with a different type of gravel to allow for a solid tread surface. The trail has instances of settling and washout/runoff annually. | |
| NV | Decomposed Granite | While a decomposed granite surface aesthetically conforms to a natural desert environment, it requires frequent maintenance. In an economy where staffing is minimal, local governments may find this type of surface undesirable. | |
| CA | Crushed rock with clay soil fines | A dirty 3/4" or 3/8" road base with around 20 −30 percent clay fine particles seems to work well in areas that are not consistently wet. The trail has instances of ruts and weeds annually. | |
| UT | Native soil and crushed limestone | The type of soil and geological configurations are very unique and pose difficulties in keeping a trail on a continually eroding area. The trail has instances of uneven wear monthly and ruts and washout/runoff quarterly. | |
| NV | Natural/native soils and rock | This trail material was selected based on the TRTA, USFS and NV State Parks transition to building trails with a purposeful aim toward sustainability. This trail has instances of uneven wear, settling, ruts and washout/runoff annually. | |
Five respondents indicated they would not recommend the trail surface and those responses are found in Table 11. Also included are comments provided by respondents about the trail surface or maintenance related issues. Fifteen respondents did not provide a response.
| Table 11. Trail Surfaces Not Recommended by Region | |||
| Region | Location | Surface Material | Comments |
| MIDWEST REGION | |||
| MN | Crushed limestone | The trail has instances of uneven wear, ruts and washout/runoff annually. | |
| NORTHEAST REGION | |||
| MD | Woodchips with an epoxy product | No Data | |
| MA | Dense grade gravel | Over time the larger (3/4" - 1") stones in the “dense grade gravel" we used tend to rise to the surface resulting in a slightly loose surface that is a bit more difficult for wheels to roll on. We have since found a better material from a different supplier, which is more homogenous and maintains a smooth compact surface. We plan to use this material for future repairs. | |
| SOUTHERN REGION | |||
| GA | Natural/native soils | Due to incorrect installation, the trail does not allow water to run off of the trail tread, which creates the need for continuous maintenance. | |
| WESTERN REGION | |||
| OR | Natural/native soil | The trail has instances of uneven wear, cracking and washout/runoff annually | |
Construction practices varied among agencies. Of the thirty‐nine reported trails only eight had surface materials applied solely by contractors. Agency personnel and/or volunteers were utilized in eighteen of the trails and for an additional five trails agency/volunteer personnel in conjunction with contractors applied the surface materials. Application methods also ranged from hand labor only to various forms of compaction methods. Table 12 shows the types of application methods utilized and the personnel who applied the materials.
| Table 12. Application Methods and Personnel | |||||
| Region | Location | Surface Material | Surface Material Depth | Running Slope | Application Method/ Application By |
| ALASKA REGION | |||||
| AK | Tek Mix | Gravel 0‒4"; 3" minus 5‒8" | Up to 5 percent | Skid Steer/Compactor by Agency | |
| AK | Natural glacial moraine & Geotextile Fabric Underlay | 3/8" minus 6" | Up to 5 percent | Compaction by Agency | |
| AK | D−1 minus base crushed aggregate; 1/2" minus top dress | Moist soil base > 8"; D−1 minus crushed aggregate 1/2" minus (cap) 5‒8" | 5 – 8.33% | Hand spread & mechanically compacted by Agency | |
| SOUTHWEST REGION | |||||
| TX | Cohesive soil and small amounts of gravel | Cohesive soil 5‒8" | Up to 5 percent | Hand tools by Volunteer | |
| MIDWEST REGION | |||||
| KY | Natural native soil (cohesive and fissured) | No Data | No Data | No Data | |
| WI | Cohesive and moist soils | No Data | > 12.5 percent | Constructed tread by Agency/Volunteer | |
| KY | Cohesive and moist soils | Natural ground surface base; Cohesive and moist soil 5‒8" | 8.33 −10.5 percent | Cleared path by Agency | |
| MN | Crushed limestone | > 8" | Up to 5 percent | Highway pavement roller by Contractor/Agency | |
| KY | Crushed rock | Gravel Base 5‒8"; Cohesive Soil 5‒8" | Up to 5 percent | No Data by Agency | |
| IA | Crushed Limestone | Granular soil base > 8"; Crushed limestone | 8.33 −10.5 percent | Tractor and hopper by Contractor | |
| IN | Natural native soil | No Data | No Data | No Data | |
| OH | Cohesive soil, dry soil, moist soil | No Data | > 12.5 percent | No Data Agency/volunteer with contracted trail construction training | |
| KY | Cohesive Soil | Cohesive soil > 8:; Gravel 0‒4" | 5 – 8.33percent | No Data by Agency | |
| KY | Soil with high organic content | Cohesive soil 5‒8" | 8.33 −10.5 percent | Hand labor - digging and raking by Agency/ Volunteer |
|
| KY | Dry and granular soils and mulch pine | Sand 5‒8"; dry soil 5‒8"; granular soil > 8" | > 12.5 percent | Hand labor by Agency | |
| KY | Natural native soil | No Data | 8.33 −10.5 percent | No Data | |
| NORTHEAST REGION | |||||
| CT | Crushed Rock and stone dust | 0‒4" | Up to 5 percent | Paving box by Contractor/Agency | |
| MA | Existing vegetation and soil | Natural Soil 0‒4"; Granular Soil 5‒8" | Up to 5 percent | No Data by Agency | |
| VA | Klingstone 400 | 0‒4" | Up to 5 percent | Compacted and Sprayed by Contractor | |
| MA | 1/2" crusher run | Granular Soil 0‒4"; Dry Soil 5‒8"; Cohesive soil > 8" | Up to 5 percent | No Data by Contractor | |
| DE | Crushed rock and fines | No Record | 5 - 8.33 percent | Spread and compacted by Contractor | |
| NY | Sand, gravel, cinders, crushed brick, wood chips | No Record | 5 - 8.33 percent | Wheel barrow/hand tools by Non-profit trail organization | |
| VA | Crushed rock with Gravel Pave II | Gravel Pave II at base; 4" of crushed stone; 2" finely crushed greenstone | 5 - 8.33 percent | No Data by Agency | |
| MA | Natural/native soil | No Record | 5 - 8.33 percent | No Data | |
| NE | Natural/native soils | Cohesive soil > 8" | Up to 5 percent | Foot and wagon traffic during westward expansion—Natural pioneer trail | |
| MD | Woodchips with an epoxy product | 0‒4" | Up to 5 percent | No Data by Agency | |
| NE | Sand and 1" minus river run aggregate | Granular soil base; Sand and 1" minus river run aggregate 0‒4" | Up to 5 percent | By hand by Contractor/ Youth Conservation Corp | |
| VA | Crusher run gravel and fines | Cohesive Soil 5‒8"; Crusher run gravel 4"; 3/8" crusher fines | 5 - 8.33 percent | Vibratory roller compaction with water spray by Agency | |
| MA | Dense grade gravel | Granular Soil 0‒4:; Unknowns 5‒8"; Dense grade gavel | Up to 5 percent | Bucket spread then rolled by Contractor | |
| SOUTHERN REGION | |||||
| TN | Natural/native soil | Cohesive Soil 5‒8" | 8.33 −10.5 percent | High traffic by Volunteers | |
| GA | Natural/native soils | Cohesive Soil 5‒8" | 5 - 8.33 percent | Dingo compaction by Contractor | |
| WESTERN REGION | |||||
| WA | Natural soils/sandy loam | Granular Soil/Sand > 8" | 5 −8.33 percent | No Data | |
| CA | Crushed rock | Crushed rock 0‒4"; Cohesive Soil 5‒8" | 10 – 12,5 percent | No Data by Contractor | |
| UT | Crushed rock | Crushed rock 5‒8"; Cohesive Soil > 8" | Up to 5 percent | Compaction by Agency | |
| NV | Decomposed Granite | 5‒8" | Up to 5 percent | 4‒6" thick compacted with steel roller by Contractor | |
| CA | Crushed rock with clay soil fines | Crushed rock w/ clay fines 0‒4"; Cohesive Soil 5‒8" | Up to 5 percent | No Data by Agency | |
| UT | Native soil and crushed limestone | No Record | > 12.5 percent | Trail dozer, hand tools, compactor by Agency | |
| OR | Natural/native soil | Moist soils 0‒4"; other soil unknown | 5 - 8.33 percent | No Data | |
| NV | Natural/native soils and rock | Dry soils > 8" | 10 – 12,5 percent | Hand tools | |
Some survey respondents provided photographs of the trail and the surrounding environment. Five aggregate trail surfaces were recommended by responding the trail manager and had accompanying photographs. In addition, all the trails have also been designated as accessible trails. While five trails composed of native soil were recommended surfaces, no photographs were available. Photographs of ten of the thirty-nine trails were provided by respondents and can be found in Appendix F.
Summary of Results
The purpose of the trails surface survey was to provide qualified professionals, resource specialists and operations staff of parks and other recreational properties with trails in the United States with descriptive and/or comparative information about the status of construction practices of pedestrian/hiker, natural surface trails. Despite a sixty-one percent survey access rate of survey invitees, the overall completion rate was extremely low. Therefore, the results can be addressed in terms of a general trend in types of surface materials used. The majority of trail surfaces were natural materials that did not use soil stabilizers. However, information on construction practices and maintenance issues was limited in the responses received. A majority of agencies utilized their own personnel or volunteers to apply surface materials or they worked along with contractors. When asked if respondents would recommend the trail surface materials on which they reported, many (48.7%) indicated they would, however accompanying comments received provided limited supporting information for those recommendations.
Recommendations for Further Action
The National Center on Accessibility continues to receive technical assistance inquiries from the field about what types of natural surface materials are available for use on pedestrian trails and how various surface materials perform in different regions of the country. While the intended outcome of the National Trail Surface survey was to establish a database that trail managers could access for trail surface material information and performance data, the data received were disappointedly sparse. The establishment of a national database of trail surface materials used for pedestrian trails, the firmness and stability of those surfaces and how well those surface materials last over time continues to be an identified need for trail managers.
Currently two national resources are available that provide information to trail users on trail locations and trail characteristics. The National Recreation Trail Database hosted by American Trails (http://www.americantrails.org/NRTDatabase/) contains data provided by federal land management agency trail managers. Trail Explorer (www.trailexplorer.com) developed by Beneficial Designs provides trail characteristic information based on data collected and input by trail managers using the Universal Trail Assessment Process (UTAP). Collaboration with one or both providers -- American Trails and Beneficial Designs -- to expand the collected information to include specific natural surface materials used and performance over time on the reported natural pedestrian trails may be an avenue to explore.
References
Active Living by Design. (2010). Disability and Physical Activity: An Overview of Issues Related to Active
Living. Chapel Hill, North Carolina, USA.
Anasazi Trails, Inc. (2008). Retrieved November 2011, from American Trails:
http://www.americantrails.org/resources/trailbuilding/Rio-Grande-Trail-Surfacing.html
Axelson, P. W., & Chesney, D. (1999). Accessible Exterior Surfaces Technical Article. Washington, D.C.:
U.S. Access Board.
Axelson, P. W., Yamada, D. A., Kirschbaum, J. B., Longmuir, P. E., & Wong, K. m. (1997, November 26).
Beneficial Designs. Retrieved November 2011, from
http://www.beneficialdesigns.com/surfaces/146-Ph1_Lit_Review_ART.pdf
Beard, J. G., & Ragheb, M. G. (1980). Measuring leisure satisfaction. Journal of Leisure Research, 12(1),
20-33.
Beard, J. G., & Ragheb, M. G. (1983). Measuring leisure motivation. Journal of Leisure Research, 15(3),
219-228.
Beggs, B. A., & Elkins, D. J. (2010, July). The Influence of Leisure Motivation on Leisure Satisfaction. The
Cyber Journal of Applied Leisure and Recreation Research.
Beneficial Designs. (2012). Retrieved November 2011, from Beneficial Designs, Inc.:
http://www.beneficialdesigns.com/
Bergmann, R. (2000). Soil Stabilizers On Universally Accessible Trails. Study Results, United States
Department of Agriculture. Retrieved from
http://www.fhwa.dot.gov/environment/recreational_trails/publications/fs_publications/0023120
2/index.cfm
Boone, T. (n.d.). Retrieved November 2011, from American Trails:
http://www.americantrails.org/resources/trailbuilding/ArtCrushedStone.html
Boone, T. (2008). Rio Grande Trail Corridor Study. Anasazi Trails, Inc.
Centers for Disease Control and Prevention (CDC), National Center for Health Statistics. DATA 2010
[Internet database]. Hyattsville, MD: CDC; 2010 [cited 2010 Sep 30]. Available from:
http://wonder.cdc.gov/data2010/focus.htm
Forest Service. (2006). Forest Service Outdoor Recreation Accessibility Guidelines. US Forest Service.
Hall, E. (2005, Spring). Living Well! The Benefits of Leisure for People with Disabilities. Bloomington,
Indiana, United States of America: National Center on Accessibility, Indiana University-
Bloomington. Retrieved from http://www.ncaonline.org/?q=node/737
Henderson, K. A. (1999, January). The Surgeon General's Report and Community Recreation for People
with Disabilities. JOPERD: The Journal Of Physical Education, Recreation & Dance, 70(1), 22-26.
Kessler Foundation, & National Organization on Disability. (2010). The ADA, 20 Year Later. New York:
Harris Interactive. Retrieved from http://www.2010disabilitysurveys.org/pdfs/surveyresults.pdf
Klingstone. (n.d.). Retrieved November 2011, from Klingstone: http://www.klingstone.com/Trails/
Marion, J. L., & Leung, Y.-F. (1996). Environmentally Sustainable Trail Management. In Environmental
Impacts of Ecotourism (pp. 229-244). CABI.
McCormick, B. P. (2000). People with Disabilities - National Survey of Recreation and the Environment. (I.
U.-B. National Center on Accessibility, Ed.) Bloomington, Indiana, United States of America.
Retrieved from http://www.ncaonline.org/?q=node/1295
National Center on Accessibility. (2008). National Center on Accessibility. Retrieved from
http://www.ncaonline.org
PEL Consulting. (2004). Trail Accessibility Research Recommendations. PEL Consulting.
Polypavement. (n.d.). Retrieved November 2011, from Polypavement: http://www.polypavement.com/
Rimmer, J. H., Riley, B., Wang, E., Rauworth, A., & Jurkowski, J. (2004, June). Physical activity participation
among persons with disabilities: Barriers and facilitators. American Journal of Preventative
Medicine, 26(5), 419-425.
Saitta, S., & Snyder, M. (2010). Choosing the Right Trail Surface. (A. Trails, Compiler)
Shank, J. W., Coyle, C. P., Boyd, R., & Kinney, W. B. (1996). A classification scheme of therapeutic
recreation research grounded in the rehabilitative sciences. Therapeutic Recreation Journal,
30(3), 179-197.
Soiltac. (n.d.). Retrieved November 2011, from Soiltac: http://www.soiltac.com/
Stabilizer Solutions. (n.d.). Retrieved November 2011, from Stabilizer Solutions:
http://www.stabilizersolutions.com/
Stumbo, N.J., Y. Wang, & S. Pegg (2011). Issues of access: what matters to people with disabilities as they
seek leisure experiences. World Leisure Journal, 53:2, 91-103.
The U.S. Equal Employment Opportunity Commission. (2009, November 21). Section 902 Definition of the
Term Disability. The Americans With Disabilities Act Amendments Act Of 2008.
U.S. Access Board. (2004). Architectural Barriers Act. Guidelines.
U.S. Access Board. (2007). Notice of Proposed Rulemaking for Outdoor Developed Areas.
U.S. Access Board. (2009). Draft Final Accessibility Guidelines for Outdoor Developed Areas. Guidelines.
World Health Organization (2011). World Report on Disability. [Online]. Available at
http://www.who.int/disabilities/world_report/2011/en/index.html.
Appendix A
National Trails Surface Study Participating Stabilizer Companies
| Participating Stabilizer Companies | |||||
| Man-ufacturer
Stabilizer Product
|
Type | Perm-eable? | Soil Type Preference | Aggregate Type Specs | Depth of Soil and/or Aggregate Mix |
| Klingstone 400
Klingstone Inc.
Klingstone 400
|
Poly-urethene | Two app-lications will waterproof most soils | Any; not for use with organic soils | Round river stone is preferred over crushed or angular stone. Coarse sand is appropriate. Size should range from coarse sand to ½ inch. Rounded 1/16th to 1/4th inch. | Aggregate should be spread 2 inches thick |
| Soil Sement
Midwest Industrial Supply, Inc.
Soil Sement
Road Oyl
|
Polymer Emulsion | No | Native soil/ aggregate screenings | Mix with soil | 4 inches deep |
| Soiltac Soilworks
Soiltac Liquid Mix-in
Soiltac Powder Mix-in |
Vinyl
Acetate Copolymer
|
Moderate application is permeable; heavy applications are not | Any | Any type, pea gravel, crushed stone 1/4in minus preferred or de-composed granite | Existing surface depth should be scared to a depth of 6 inches |
| Stabilizer Stabilizer Solutions Stabilizer
StaLok
|
Organic Plant Material | No | Native soil/ aggregate screenings | No sand stone; de-composed granite or crushed ¼ or 3/8 inch minus aggregate | 3 inches deep for heavy foot traffic or light vehicles |
| Perm-azyme Inter-national Enzymes
Perm-azyme
|
Organic Enzyme Compound | No | Soil should ideally have approx.. 20% cohesive fines | Native soil; 20% colloidal clay; ¾ minus aggregate | Compacted in lifts of 3 max; the thickest of the compacted treated base material should be 6 inches |
| Green Trails Inter-national
PX300
|
Enzymatic Vinyl Copolymer Emulsion | No | Native soil | ||
| DirtGlue
DirtGlue
|
Polymer | Semi | Good for most; no clay | All soil types | Max ¾ inch; the smaller the better; creates smoother surface of finished product |
| Soil Sta-bilization Products Co, Inc
Natural Pave
|
Similar to Pavement | No | |||
| Enviroseal
M10+50
|
Polymer | Yes | |||
Appendix B
Trails Study Participation Press Release
National Center on Accessibility National Trails Surface Study Press Release
NCA Seeks Land Managers with Trails to Participate in National Study
The National Center on Accessibility is seeking land managers with pedestrian trails in public parks, forests, lands, and other recreation areas to participate in a national study on the accessibility of various types of soil stabilization products. This is the second of a four phase national trails study conducted by the National Center on Accessibility at Indiana University with support from the U.S. Access Board.
The development of accessibility guidelines for outdoor recreation areas and trails has culminated in a 10-year process with the recent release of the Draft Final Accessibility Guidelines for Outdoor Developed Areas in October 2009. In many instances, the choice of various surface materials can have a direct impact on the maintenance of the accessible trail and the resulting trail user experience. Even with the development of scoping and technical provisions for trails, lack of information on the effectiveness of various types of surface materials continues to pose trail building and maintenance challenges for trail coordinators.
This national trails study is designed to analyze parameters such as installation procedures, labor requirements, ongoing maintenance needs, costs, and aggregate combination requirements in the use of various soil stabilization products to provide firm and stable trail surfaces.
This four-phase study began with the selection of “green” stabilizer products, and the subsequent application of those products to trail surfaces at Bradford Woods, the 2,400 acre outdoor education and leadership center of Indiana University. The longitudinal study includes a quarterly assessment of maintenance, durability and accessibility of seven stabilizer products. Phase two will include a comprehensive survey of sites that are currently using “green” soil stabilizer products on a trail surface. Categorized into one of six geographic regions throughout the United States, representatives from each site will provide information installation, costs, maintenance and wear in relation to the climate, trail function and use. During phase three, the survey information will be compiled and submitted in report form to the U.S. Access Board, as well as made available publically through the NCA web site. The final phase will utilize the findings to conduct a variety of forum discussions in addition to developing technical assistance and educational curriculum on the topic of accessible trails.
Those interested in participating in the study or who would like additional information, please contact:
Nikki M. Montembeault
Accessibility Specialist
National Center on Accessibility
(812) 856-3680
nmontemb@indiana.edu
Appendix C
National Center on Accessibility - National Trails Surface Study
Rotational Penetrometer Data Form
| Trails Information | |||||||||||
| Trail Name: | |||||||||||
| Trail Lo-cation: | |||||||||||
| RP Oper-ator: | RP Data Recorder: | ||||||||||
| Rotational Penetrometer | |||||||||||
| Man-ufac-turer: | Beneficial Designs | ||||||||||
| Serial num-ber: | BDRP- | Date of last calibration: | |||||||||
| Tire pressure set at 36 psi on (date): | By: | ||||||||||
| Date & Test Conditions | |||||||||||
| Date: | Time: | ||||||||||
| Atmos-pheric Tem-pera-ture: | F | Relative Humidity: | % | ||||||||
| If the temperature is more than 10 F different than the temperature at the tire pressure check, re-inflate tire before starting to test. | |||||||||||
| Test Results | |||||||||||
| 1. Surface at trailhead | |||||||||||
| Sur-face des-crip-tion: | |||||||||||
| Sur-face tem-pera-ture: | F | ||||||||||
| Trial 1 | Firm-ness: | Stability: | |||||||||
| Trial 2 | Firm-ness: | Stability: | |||||||||
| Trial 3 | Firm-ness: | Stability: | |||||||||
| Trial 4 | Firm-ness: | Stability: | |||||||||
| Trial 5 | Firm-ness: | Stability: | |||||||||
| Aver-age: | Firm-ness: | Stability: | |||||||||
| 2. Surface at ________’ | |||||||||||
| Sur-face des-crip-tion: | |||||||||||
| Sur-face tem-pera-ture: | F | ||||||||||
| Trial 1 | Firm-ness: | Stability: | |||||||||
| Trial 2 | Firm-ness: | Stability: | |||||||||
| Trial 3 | Firm-ness: | Stability: | |||||||||
| Trial 4 | Firm-ness: | Stability: | |||||||||
| Trial 5 | Firm-ness: | Stability: | |||||||||
| Aver-age: | Firm-ness: | Stability: | |||||||||
| 3. Surface at ________’ | |||||||||||
| Sur-face des-crip-tion: | |||||||||||
| Sur-face tem-pera-ture: | F | ||||||||||
| Trial 1 | Firm-ness: | Stability: | |||||||||
| Trial 2 | Firm-ness: | Stability: | |||||||||
| Trial 3 | Firm-ness: | Stability: | |||||||||
| Trial 4 | Firm-ness: | Stability: | |||||||||
| Trial 5 | Firm-ness: | Stability: | |||||||||
| Aver-age: | Firm-ness: | Stability: | |||||||||
Appendix D
Bradford Woods Trails Study Photos
(see slideshow at top of page)
Appendix E
National Trail Surface Study Survey
SECTION#1
For the following questions, please answer every item pertaining to the geographic, demographic, and political information asked. Leave blank if the response choice is not applicable to you. Some questions require you to fill in the blank with a corresponding answer.
1. Is this trail designed and managed predominantly as a pedestrian/hiker trail?
Yes
No
If “No” is selected, then skip to “End of Survey” (Qualtrics Option). If “Yes is selected, then skip to Question #2.
2. Is this trail primarily surfaced with a material other than asphalt, concrete, or boardwalk?
Yes
No
If “No” is selected, then skip to “End of Survey” (Qualtrics Option). If “Yes is selected, then skip to Question #3.
3. Have you participated in the National Trails Study Survey previously?
Yes
No
If “No” is selected, then skip to “Question #4” (Qualtrics Option). If “Yes is selected, then skip to “Question #33 – Section#7”. Attention: This addition (Question#3) will be available for Round#2 of this new survey!
4. Please indicate the type of agency you represent:
City agency
County agency
State agency
Federal agency
Non-profit organization
Private landowner
Other (please specify):
5. Please indicate the zip code in which your agency is geographically located (state):
6. Please indicate the name, address and telephone number of your agency:
7. Please indicate the name of the park location in which this trail is located:
8. Please indicate the name of the trail:
9. Please indicate the year in which this trail was constructed:
10. Please indicate the length (in miles and feet):
11. Please name the trail’s site coordinator:
12. Please indicate your (the survey respondent) job title or position within your agency.
13. Please indicate the average traffic per month on trail/visitor usage:
<100
101<x<500
501<x<1000
1001<x<5000
5001<x<10000
>10001
Unknown
N/A
14. Please indicate the types of use permitted on this trail in addition to pedestrian/hiker (choose all that apply):
Motorized recreation (i.e. motorcycle, snowmobile)
Mountain bike
Equestrian
Skateboard
Unknown
N/A
Other (please specify):
15. Is this trail designated as an “accessible” trail?
Yes
No
Unknown
N/A
SECTION#2
For the following questions, please answer every item pertaining to the trail surface composition. Some questions require you to fill in the blank with a corresponding answer.
16. Please indicate the composition of the trail by selecting the material(s) installed:
Natural/Native soil with stabilizer
Natural/Native soil without stabilizer
Soil with high organic content
Crushed rock with stabilizer
Crushed rock without stabilizer
Engineered wood fibers
Wood Chips (bark, cedar, generic)
N/A
Other (please specify):
17. If a soil stabilizer was installed as part of the trail surface material, please indicate the product name.
18. If a soil stabilizer was not used, please indicate the application method and material(s) used to achieve the natural surface.
| Materials | Application Method |
19. Please indicate the duration of the warranty/guarantees offered for the surface product used by the sales representative/vendor.
Less than 1 year
Between 1 year and 2 years
More than 2 years, but 5 years or less
No warranty/guarantees
Unknown
Other (please specify)
SECTION#3
For the following questions, please answer every item pertaining to the trail pre-installation specifications. Leave blank if the response choice is not applicable to you. Some questions require you to fill in the blank with a corresponding answer.
20. Please indicate the trail’s soil composition/type, and the depth at which it can be found (choose all that apply):
| Soil composition/ type | Depth
0”- 4” |
Depth
5”- 8” |
Depth
>8” |
Depth
“Unknown” |
| Cemented soil
(particles are held together by a chemical agent, such as calcium carbonate) |
||||
| Cohesive soil
(examples of cohesive soils are: clay, silty clay, sandy clay, clay loam and, in some cases, silty clay loam and sandy clay loam) |
||||
| Dry soil
(does not exhibit visible signs of moisture content) |
||||
| Fissured soil
(has a tendency to break along definite planes of fracture with little resistance, or a material that exhibits open cracks) |
||||
| Granular soil
(gravel, sand, or silt with little or no clay content) |
||||
| Moist soil
(soil looks and feels damp) |
||||
| Plastic soil
(allows the soil to be deformed or molded without cracking) |
||||
| Saturated soil (voids are filled with water) | ||||
| Unknown |
Other (please specify):
21. Please indicate the typical slope the particular trail has prior to trail installation:
Up to 5%
Between 5% (1:20) and 8.33% (1:12)
Between 8.33% (1:12) and 10% (1:10)
Between 10% (1:10) and 12.5% (1:8)
Greater than 12.5% (1:8)
SECTION#4
For the following questions, please answer every item pertaining to the sub-base installation, if the sub-base installation was necessary due to the installation of the trail surface material. Leave blank if the response choice is not applicable to you. Some questions require you to fill in the blank with a corresponding answer.
22. Please indicate the date (year) of the sub-base installation:
23. Please indicate the aggregate type used and the depth at which it can be found (choose all that apply):
| Aggregate Type | Depth
0”- 4” |
Depth
5”- 8” |
Depth
>8” |
Depth
“Unknown” |
| Sand | ||||
| Gravel | ||||
| Cinders | ||||
| Crushed brick | ||||
| Unknown |
Other (please specify):
SECTION#5
For the following questions, please answer every item pertaining to the trail surface installation. Leave blank if the response choice is not applicable to you. Some questions require you to fill in the blank with a corresponding answer.
25. Please indicate the date (year) of trail surface installation:
26. Please indicate who installed the trail surface (choose all that apply):
Manufacturer
Contractor
Agency/Organization/Park staff
Volunteer
Unknown
27. If a contractor was hired for the installation of the product, please indicate the name of the installation contractor:
SECTION#6
For the following questions, please answer every item pertaining to the maintenance since installation. Leave blank if the response choice is not applicable to you. Some questions require you to fill in the blank with a corresponding answer.
28. Have you performed any routine maintenance, repair or replacement of the surface since installation?
Yes
No
If “No” is selected, then skip to “Question #32” (Qualtrics Option). If “Yes is selected, then skip to Question #29.
29. Please indicate what the length of time was between the installation of the trail surface material and the first necessary repair:
| 1 month | 3 months | 6 months | 1 year | 2 years | |
| Time between installation to first repair |
Other (please specify):
30. What caused the need for the first repair?
31. Please indicate the number of the complete replacements of the trail surface that you have already performed (in total, so far):
32. Please indicate the condition of the trail’s surface characteristics over a period of time (choose all that apply):
| Trail’s Surface characteristics | Monthly | Quarterly | Annually |
| Uneven wear | |||
| Settling | |||
| Cracking | |||
| Buckling | |||
| Ruts | |||
| Washout/Runoff | |||
| Other |
Other (please specify):
SECTION#7
For the following questions, please answer every item pertaining to the trail’s quarterly maintenance. Some questions require you to fill in the blank with a corresponding answer.
33. Please indicate the number of maintenance activities that have been performed the last quarter, on the surface of the trail:
| Specific Maintenance Activity | Quarterly |
| Spot surfacing | |
|
Surface replacement (similar material) |
|
|
Surface replacement (different material) |
|
|
Surface repair and removing loose material |
|
| N/A |
34. Please indicate the condition of the trail’s surface characteristics within the last quarter (choose all that apply):
| Trail’s Surface Characteristics | Choose all that apply |
| Uneven wear | |
| Settling | |
| Cracking | |
| Buckling | |
| Ruts | |
| Washout/Runoff |
35. Please indicate any unusual events that occurred during the last quarter that affected the surface of the trail (e.g., inclement weather conditions, major program use, special events, etc.):
36. Would you recommend the methods of construction and/or soil stabilizer application to others with similar trail compositions/environments?
Yes
No
N/A
37. Please indicate Why or Why Not:
SECTION#8
For the following questions, please send to the lead investigator (Dr. Lowell Caneday) at trailstudy@okstate.edu and email with Title: Photographs of the trail and surrounding environment, and attach to it trail’s photographs. You can upload up to 5 pictures.
Appendix F
Photos of Trails Provided by Survey Respondents
Alaska Region
Alaska
Glacial moraine and geotextile fabric-recommended surface
Northeast Region
Massachusetts
Natural/native soil—not recommended surface
Northeast Region
Virginia
Klingstone 400—recommended surface
Northeast Region
Massachusetts
1/2” Crusher Run-recommended surface
Northeast Region
Delaware
Crushed rock and fines-recommended surface
Northeast Region
Virginia
Crushed rock with Gravel Pave II-recommended surface
Northeast Region
Massachusetts
Dense grade gravel—not recommended surface. Note respondent indicated with smaller fines this would be a good surface
Northeast Region
Massachusetts
Natural/native soil—recommended surface
Western Region
Washington
Natural soil/sandy loam—no recommendation provided
Western Region
Oregon
Natural/native soil—not recommended surface
User Comments/Questions
Add Comment/Question