8.3 Results and Discussion
Figure 24 shows the range of preferred listening levels selected by the listeners who participated in this study. The highest level of 111 dB SPL was selected by a listener with a moderate-to-severe flat hearing loss. The dB SPL values were referenced to the level of a 1000 Hz calibration tone whose RMS level is equivalent to the average RMS level of the sentences.
Signal
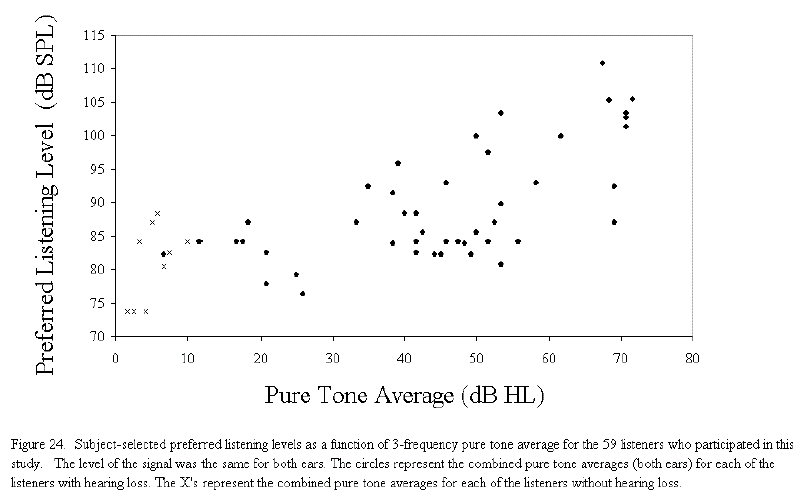
For purposes of statistical data management the qualitative ratings were converted to numerical values. The excellent rating was converted to a score of 4, good was converted to 3, marginal was converted to 2, and unacceptable was converted to 1. Tables 1 through 5 show the median ratings for each of the five listening conditions. These median values were initially divided into groups according to degree and configuration of hearing loss. It is interesting to note that the median ratings cluster together regardless of the degree and configuration of hearing loss.
Table 1. Median listener ratings for the Auditorium condition
Listener/Speaker Distance in Feet
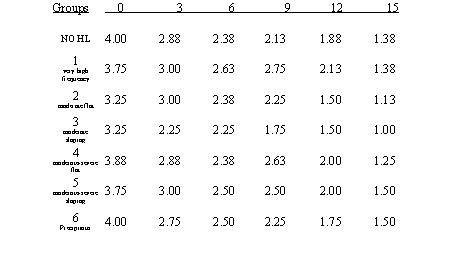
Table 2. Median listener ratings for the Conference Room condition
Listener/Speaker Distance in Feet
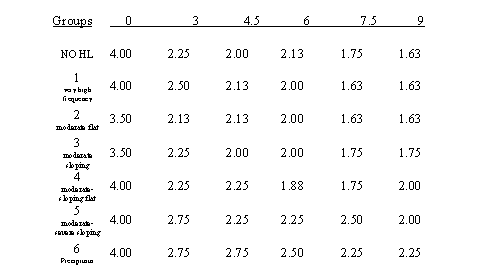
Table 3. Median listener ratings for each of the six experimental groups for the Classroom condition.
Listener/Speaker Distance in Feet
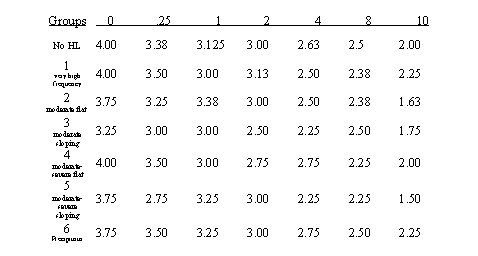
Table 4. Median listener ratings for the FM Teleloop Noise condition
Signal to Noise Ratio in dB
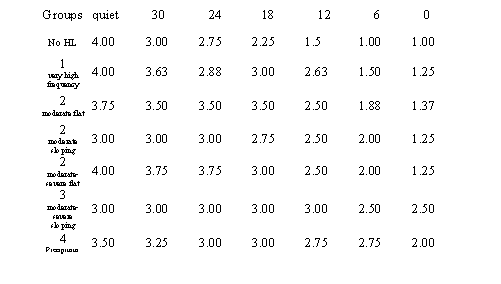
Table 5. Median listener ratings for the Peak Clipping condition
Clipping Levels re: Peak
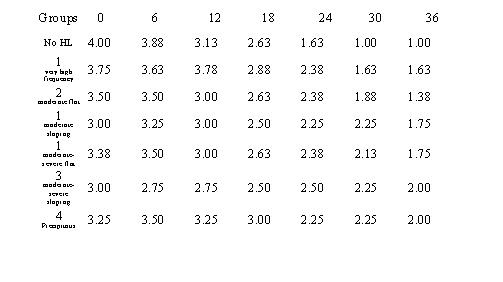
Because all of the groups rated the quality of the sentences similarly, recommendations stemming from this report are independent of degree of hearing impairment. Results, however, for the 10 listeners without hearing loss were excluded in arriving at the recommendations. Furthermore, in the interest of being more inclusive, the 75th percentile was chosen over the median (50th percentile). As opposed to an average (mean or median) which does not take into account those listeners with more strict listening criteria, the ratings for 75 percent of the listeners with hearing loss were considered in arriving at the recommendations.
A minimally acceptable rating of 2.25 was chosen. This value represents the average if a listener rated at least one of the four presentations for a particular subcondition as good: marginal (2), marginal (2), marginal (2), and good (3). Tables 6 through 10 show the rating level above which 75 percent of the listeners’ scores fell for each of the five listening conditions. Values that are below the minimal criterion of 2.25 are both italicized and highlighted. For the auditorium condition the microphone distance cannot be greater than 3 feet from the talker. For the classroom condition the microphone distance cannot be greater than 2 feet from the talker. For the conference room condition all of the microphone distances were judged to be unacceptable. For the induction loop condition the signal-to-noise ratio cannot be poorer than 18 dB. Finally, for the peak clipping condition the level of peak clipping down from the peak level cannot exceed 18 dB.
| Table 6. Seventy-fifth percentile ratings for the Auditorium condition. In parentheses following each subcondition are the corresponding STI values. | |||||
| Quiet |
3 feet (.842) |
6 feet (.777) |
9 feet (.729) |
12 feet (.632) |
15 feet (.506) |
| 3.25 | 2.25 | 1.81 | 1.56 | 1.25 | 1.00 |
| Table 7. Seventy-fifth percentile ratings for the Classroom condition. In parentheses following each subcondition are the corresponding STI values. | ||||||
| Quiet |
3 inches (.965) |
1 foot (.889) |
2 feet (.816) |
4 feet (.785) |
8 feet (.748) |
10 feet (.731) |
| 3.25 | 2.75 | 2.75 | 2.5 | 2.0 | 2.0 | 1.25 |
| Table 8. Seventy-fifth percentile ratings for the Conference Room condition. In parentheses following the subcondition are the corresponding STI values. | |||||
| Quiet |
3 feet (.562) |
4 1/2 feet (.566) |
6 feet (.561) |
7 1/2 feet (.523) |
9 feet (.512) |
| 3.50 | 1.75 | 1.75 | 1.63 | 1.5 | 1.5 |
| Table 9. Seventy-fifth percentile ratings for the Induction Loop noise condition. | ||||||
| Quiet | 30 dB S/N | 24 dB S/N | 18 dB S/N | 12 dB S/N | 6 dB S/N | 0 dB S/N |
| 3.13 | 3.00 | 2.88 | 2.63 | 2.13 | 1.50 | 1.00 |
| Table 10. Seventy-fifth percentile ratings for the Peak Clipping condition. | ||||||
| Quiet | 6 dB | 12 dB | 18 dB | 24 dB | 30 dB | 36 dB |
| 3.00 | 2.88 | 2.75 | 2.25 | 1.75 | 1.50 | 1.00 |
Figure 25 shows 75th percentile ratings as a function of the STI results from the reverberation plus noise conditions combined for the three different environments. Also shown on this graph is the best fit, first order regression line to the data. For a minimally acceptable criterion of 2.25 the STI value cannot be less than .84. Note that with our criteria (a 2.25 rating for 75% of the listeners and an STI value of .84) only a few data points can be found in the unacceptable region. Note that these two data points (x’s) are for Group 5 with the greatest degree of hearing impairment.
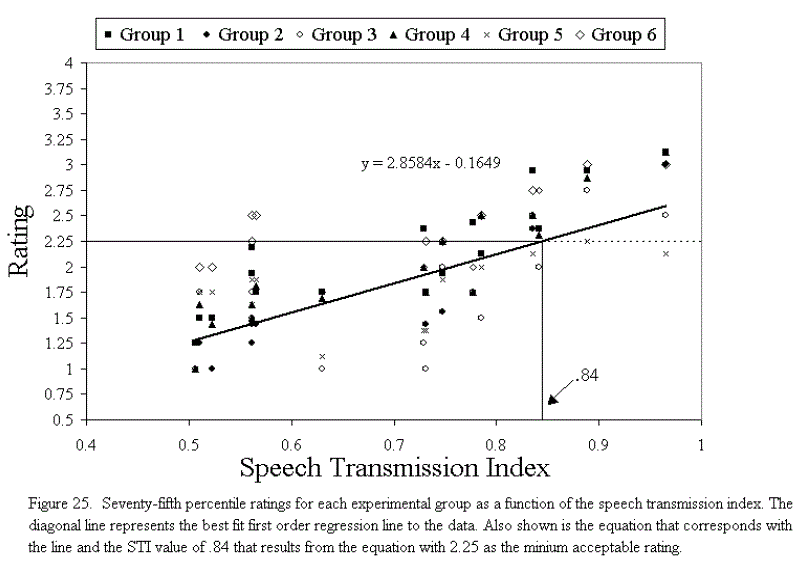
The STI was chosen as the criterion metric over a simple distance measure because different STI values can be recorded at the same distance depending on the level of the background noise in the environment (See Figure 20).

User Comments/Questions
Add Comment/Question