8.2.2 Stimuli
Six pairs of sentences (one male and one female talker) were selected from the corpus of the Lexington Dialogue Sentences. These materials were developed at Lexington specifically for evaluation of hearing aids. The six pairs of Lexington Dialogue Sentences selected were as follows.
1. I would like to try these shoes. What size shoes do you wear?
2. Where did you go to school? I went to school in New York City
3. That bookcase fits in nicely with your other furniture. I tried to find the perfect place for it.
4. Did you do anything special over the weekend? I went to the movies and read a lot.
5. The basket is on the table. It is filled with beautiful flowers.
6. Did you watch the movie on television last night? No, I watched a documentary instead.
The original sentences were subjected to three types of distortion created under either live or computer simulated listening conditions. Stimuli for the reverberation plus noise condition were recorded in three separate environments: a classroom, an auditorium, and a conference room. For the teleloop noise and peak clipping conditions digital signal processing techniques were used to simulate real-world listening conditions. The following is a brief description of how the three types of stimuli were prepared:
1. Reverberation plus noise.
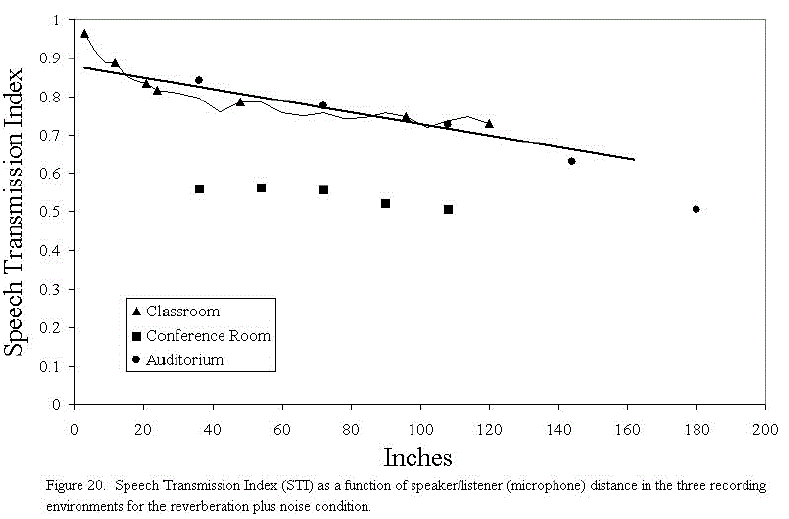
In three separate recording environments sentence materials were delivered from a B & K artificial mouth at successive distances from the recording microphone. The environments were selected to represent those where a person with hearing loss is likely to encounter an assistive listening system: a classroom, a conference room, and an auditorium. A high quality microphone attached to a sound level meter picked up the signals and delivered them to a digital audio tape recorder. Speech Transmission Index (STI) measurements were made immediately following the recording of each sentence pair at each microphone location. The recorded signals were then redigitized and stored onto a computer disk for presentation during the experiment.
Figure 20 shows the STI at each of the recording distances from the microphone. Note that STI values for the conference room at equivalent distances to those for the other rooms were comparatively quite poor. This is because of the constant background noise created by the ventilation system in the conference room.

2. Induction Loop Noise
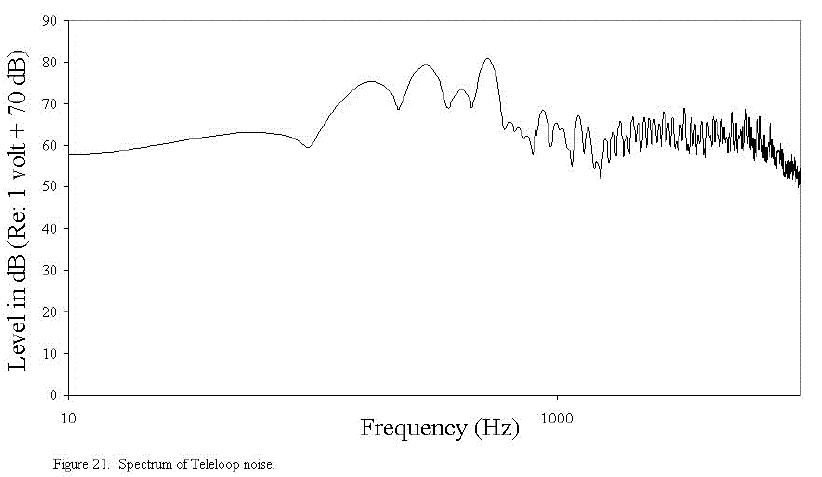
A digital recording was made of the noise created by a poorly installed induction loop. This noise was digitally mixed with the original sentences at six signal to noise ratios ranging from 0 to 30 dB in 6 dB steps. Figure 21 shows the spectrum of the induction loop noise.

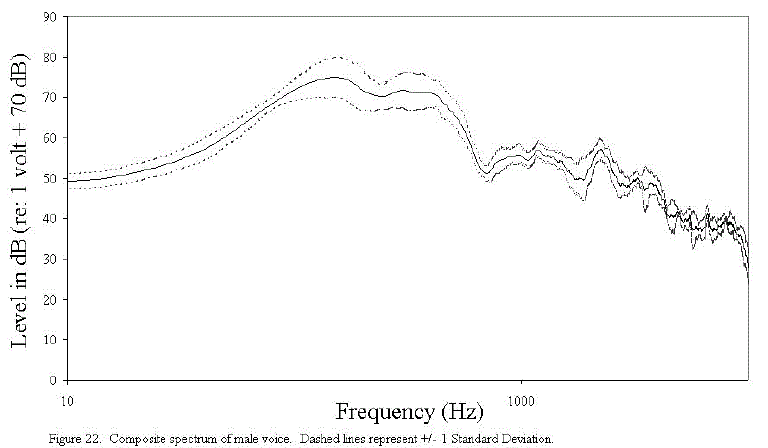
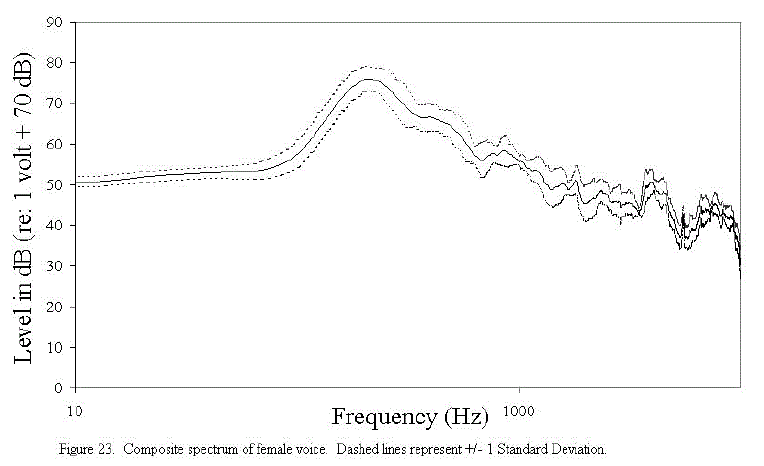
The noise largely consists of a background "buzz " (see primary at 60 Hz with harmonics) and a high-frequency hiss. Also shown in Figures 22 and 23 are the composite spectra of the male and female voices, respectively, for the Lexington Sentences that were chosen.


3. Peak clipping
The signals were digitally and symmetrically clipped at six different levels down from the peak level. The following outline summarizes the three listening conditions.
1. Reverberation and background noise - expressed as distance from the recording microphone. Also shown are the corresponding STI measurements
| A. Auditorium | |
| Distance | STI |
| 3 feet | 0.842 |
| 6 feet | 0.777 |
| 9 feet | 0.729 |
| 12 feet | 0.632 |
| 15 feet | 0.506 |
| B. Conference Room | |
| Distance | STI |
| 3 feet | 0.562 |
| 3.5 feet | 0.566 |
| 6 feet | 0.561 |
| 7.5 feet | 0.523 |
| 9 feet | 0.512 |
| Classroom | |
| Distance | STI |
| 3 inches | 0.965 |
| 12 inches | 0.899 |
| 24 inches | 0.816 |
| 48 inches | 0.785 |
| 96 inches | 0.748 |
| 120 inches | 0.731 |
2.Internally Generated Induction Loop Noise - expressed as signal to noise ratio of the RMS of speech to the RMS of noise.
0 dB
6 dB
12 dB
18 dB
24 dB
30 dB
3.Peak clipping - expressed in level down from the peak amplitude
6 dB
12 dB
18 dB
24 dB
30 dB
36 dB

User Comments/Questions
Add Comment/Question