Improved Engineered Wood Fiber (EWF) Surfaces for Accessible Playgrounds Field Performance Testing: Final Report II
Moisture and Durability
Due to the in-situ nature of this testing and the size of the test surfaces, we did not have a means for non-destructively evaluating moisture or durability in these surfacing systems. Thus, the visual evaluation of the surfaces was relied upon during the 6 months and MC samples were removed after the test period (Figure 6 and 7). A summary of the surface layer density and moisture content and the EWF moisture content just under the surface layer is given in Table 5 and Figure 8.
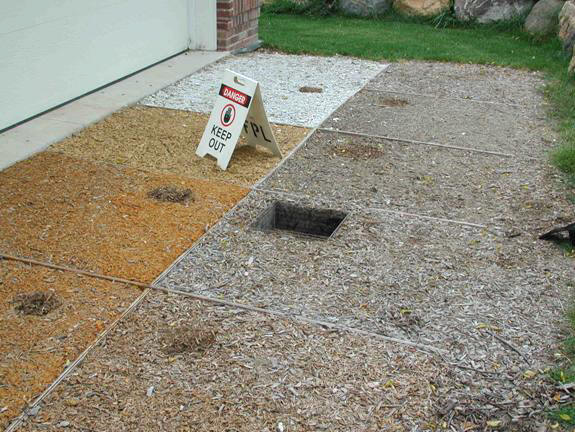
Figure 6. Each tested surface had a small portion removed following the impact test to determine density and moisture content of the layer and the EWF beneath the surface.
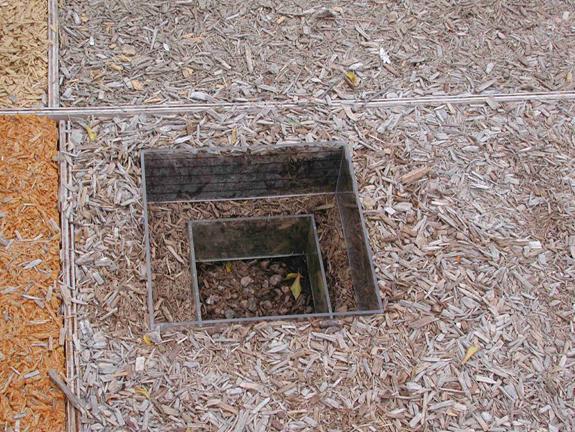
Figure 7. A close-up view of the archeological-type excavation done to determine the moisture profile of the E2 surface. Note the gravel is shown at the bottom of the .3m (12”) excavation.
Figure 8. A comparison of the average moisture content of the stabilized surface layers with the moisture content immediately below that surface.
Table 5. Surface layer specific gravity and moisture content of EWF under surface
| Surface | Surface layer dry specific gravity | Average moisture content of surface layer (%) | Moisture Content (%) under surface layer |
|---|---|---|---|
| A2 | .265 | 22 | 131 |
| B | .293 | 48 | 123 |
| C | .438 | 45 | 160 |
| D | .416 | 35 | 132 |
| E2 | .206 (Top 25 mm) | 24 (Top 12 mm) | 76 (sampled at 25mm) |
| F | .179 | 31 | 156 |
| G | .149 | 18 | 82 |
| H | .514 | 33 | 134 |
Moisture content measurements indicate that the bonded surface layers, on average, are not as wet (by weight) as the E2 surface (unstabilized EWF). This measurement is misleading due to the binder’s non-hygroscopic properties. However, the EWF under the stabilized surfaces would appear to be much wetter. This would lead one to presume that the binder/EWF surface layer is retarding the drying process. This in turn causes the underlying EWF to be saturated. Another representation of the moisture in the EWF is shown from the data of Table 6 and illustrated in the moisture content profile of Figure 9. The trendline fitted to the data of the moisture profile in E2 indicates that it is saturated at a depth of approximately 100 mm (4”) and continues to be saturated to the drainage bed. This is an area where additional study would yield some knowledge of the rate of decay under these very wet/saturated conditions. We have no quantified model for predicting the loss (decay) of woody material under these moisture conditions. We could easily presume development of a Resin-EWF System with reduced MC in the unbound EWF would result in a beneficial reduction of decay rates. This in-turn would then extend the life of EWF in-situ for playground surfaces.
Figure 9. Profile of moisture content through the EWF of surface E2 and a trendline fitted through the measurements.
Table 6. Moisture profile data for EWF and layer surfaces
| Surface E | Z-depth (mm) | Wet Wt. (g) | Dry Wt. (g) | MC (%) |
|---|---|---|---|---|
| E0 | 12 | 26.3 | 21.22 | 24 |
| E1 | 25 | 23.8 | 13.5 | 76 |
| E2 | 50 | 24.7 | 11.3 | 119 |
| E3 | 75 | 25.8 | 10.7 | 141 |
| E6 | 150 | 23.6 | 9.5 | 148 |
| E9 | 225 | 25.9 | 10.4 | 149 |
| E12 | 300 | 24.5 | 9.6 | 155 |
| Surface Layer | Wet Wt. (g) | Dry Wt (g) | Area (cm2) | Depth (cm) | Volume (cm3) | Dry SG | MC (%) |
|---|---|---|---|---|---|---|---|
| A | 253 | 207.5 | 156.3 | 5 | 782 | 0.265 | 22 |
| B | 339.7 | 229.3 | 156.3 | 5 | 782 | 0.293 | 48 |
| C | 367.8 | 253 | 156.3 | 3.7 | 578 | 0.438 | 45 |
| D | 219.3 | 162.6 | 156.3 | 2.5 | 391 | 0.416 | 35 |
| F | 227.4 | 173.7 | 156.3 | 6.2 | 969 | 0.179 | 31 |
| G | 170.9 | 144.6 | 156.3 | 6.2 | 969 | 0.149 | 18 |
| H | 394.2 | 297.1 | 156.3 | 3.7 | 578 | 0.514 | 33 |
User Comments/Questions
Add Comment/Question