Improved Engineered Wood Fiber (EWF) Surfaces for Accessible Playgrounds Field Performance Testing: Final Report II
Accessibility
Tests of the surfaces with the rotational penetrometer (Figure 3 and 4) began one week after the surfaces were formed and continued monthly (Tables 2 and 3). The test was performed at a different location each time so that the variability of the results may be seen in large part to the test being run in different locations. There is an inherent inaccuracy in the test method and a temperature-related fluctuations in the Resin-EWF surface properties present two other contributors to the fluctuation of the penetrometer readings.
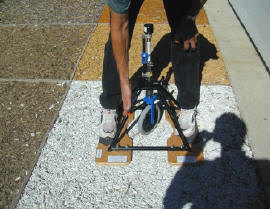
Figure 3. Rotational penetrometer shown in use on surface A2.
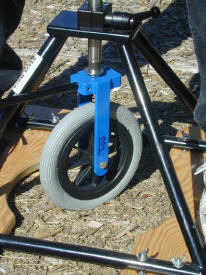
Figure 3. Rotational penetrometer shown in use on surface A2.
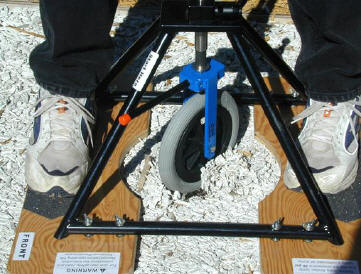
Figure 4. After the rotational penetrometer caster wheel is rotated on the surface 360 degrees, the stability reading is taken. In this case, the left photo shows surface A2 indicates poor stability as shown by the amount of silcone-coated EWF displaced by the rotated caster wheel. The right photo shows surface G with little damage from the rotated caster wheel.
Table 2. Rotational Penetrometer measured "firmness" in inches (x25.4 yields mm)
| Surface | 1 week | 1 month | 2 months | 3 months | 4 months | 5 months | 6 months |
|---|---|---|---|---|---|---|---|
| A2 | .38 | .48 | .56 | .39 | .40 | .42 | .39 |
| B | .41 | .38 | .43 | .37 | .37 | .38 | .40 |
| C | .20 | .20 | .20 | .29 | .31 | .18 | .15 |
| D | .25 | .20 | .19 | .40 | .31 | .24 | .17 |
| E2 | .40 | .34 | .36 | .32 | .42 | .41 | .31 |
| F | .40 | .30 | .34 | .40 | .43 | .47 | .38 |
| G | .38 | .33 | .38 | .47 | .34 | .34 | .34 |
| H | .23 | .20 | .19 | .50 | .39 | .32 | .26 |
Table 3. Rotational Penetrometer measured “stability” in inches (x25.4 yields mm)
| Surface | 1 week | 1 month | 2 months | 3 months | 4 months | 5 months | 6 months |
|---|---|---|---|---|---|---|---|
| A2 | .60 | 1.34 | 1.19 | .93 | .98 | .79 | .98 |
| B | .78 | 1.20 | .89 | 1.07 | .84 | .88 | .95 |
| C | .22 | .25 | .23 | .34 | .37 | .26 | .21 |
| D | .30 | .22 | .22 | .40 | .36 | .30 | .23 |
| E2 | .75 | .75 | .71 | .72 | .77 | .79 | .77 |
| F | .44 | .34 | .38 | .48 | .52 | .51 | .42 |
| G | .41 | .41 | .44 | .54 | .48 | .49 | .45 |
| H | .27 | .23 | .23 | .55 | .44 | .36 | .29 |
The classifications of firmness and stability, as categorized by Axelson and Chesney (1999), were used as appropriate for these comparisons during the six months of testing. These rankings were developed after extensive surface testing with full-scale (400 m) test courses. The total mechanical energy expended by 39 human subjects traversing these courses was correlated with the rotational penetrometer device readings to indicate which surfaces presented a physiological challenge to the ambulatory disabled and users of mobility aids. Moderately Firm and Moderately Stable rankings were deemed acceptable for short distances traveled. Play areas would be considered short distances for travel whereas trails and paths would be considered long distances and would require the Firm and Stable rankings.
Firmness is a direct measure of the depression of a surface when a controlled load is placed on it. The categories suggested by Axelson and Chesney (1999) are:
Firm (depresses 7.6 mm [.3”])or less,
Moderately Firm (depresses more than 7.6mm [.3”] less than 12.7 mm [.5”]), and
Not Firm (depresses 12.7mm [.5”] or more).
In only one instance, there was a surface rated as Not Firm. For one reading in May the A2 surface (a silicone binder) became Not Firm. Most of the polyurethane readings from surfaces C, D,and H, yield ratings of Firm. During the heat, and dryness, of summer, the polyurethanes as a class, moved into the Moderately Firm ranking and then by Fall, all three polyurethanes moved back to Firm at the end of testing. All other surfaces, including the EWF consistently were rated as Moderately Firm.
Stability is a measure that includes the simulated wheelchair caster’s depression of the surface and its ability to resist further erosion/indentation due to four 90-degree rotational movements of the simulated wheelchair caster. Axelson and Chesney suggested Stability rankings similar to the way firmness was ranked:
Stable (indents/erodes surface 12.7mm[.5”] or less),
Moderately Stable (indents/erodes surface more than 12.7 mm and up to 25.4mm)
Not Stable (indents/erodes surface more than 25.4mm [1.0”]).
In the six months of testing, the stability of the A2 and B Silicone surfaces could be ranked as Moderately Stable or even Not Stable on numerous occasions while the other treatments were typically rated as Stable (see Figure 4). The unstabilized EWF surface (E2) was consistently Moderately Stable. There were several isolated instances when the latex and non-foaming polyurethane fell into that Moderately Stable ranking. In the summary, the polyurethane systems were rated as Stable in nearly all tests and conditions. The latex systems performed much better than the silicone and the control surface EWF. Most noteworthy is that the silicones became Unstable within the first month and did not improve. We could visually observe the silicone-coated wood elements in the silicone systems coming apart in the first month of the test. The silicone was not able to bond the wood fiber in a matrix after the EWF became wet. Within two months the entirety of surfaces A2 and B became loose (unbound) surfaces with the top layer being composed of silicone-coated wood fiber.
User Comments/Questions
Add Comment/Question