Database Development
Three goals drove the development of the database software:
1. Provide a flexible tool for standards developers to assess the implications of decisions in a “what if” mode.
2. Provide a resource that can support human modeling of wheeled mobility device users.
3. Provide a foundation for future multi-site and international research in this field.
Most anthropometry results are conveyed through tables and two-dimensional illustrations of the body. The availability of 3-D anthropometry tools like the ones we used and 3-D computer graphics provides the opportunity to develop much more sophisticated design tools that can be integrated into the design process for everyday use. Designers are rapidly adopting 3-D design software since lower cost products like SketchUp became available and increased competition. While most designers are not currently using digital human modeling software to test their designs for human fit on an everyday basis, there will someday be a market for low cost easy to use human modeling tools. Anticipating this eventuality, we developed a database with the ability to integrate the data with human modeling and 3-D design software. The 3-D coordinate data for each individual are archived as individual datasets in a relational database. This provides the ability to retrieve and analyze the data in many ways, including the ability to construct 3-D static digital representations of the individual and mobility device (D'Souza et al., 2007; 2010a), as well as generate summary statistics on a number of different body and device dimensions (Paquet & Feathers, 2004).
The visual interface software to the database was developed using Microsoft Visual C++ and OpenGL (D’Souza et al., 2010a). The software application generates in runtime both graphical and numeric displays such as histograms, summary statistics, percentile values, etc. for a sub-group of individuals based on user-selected demographic and anthropometric variables (Figure 5-1), or digital human models of specific individual cases. These individual cases can be selected from a sub-sample using an interactive histogram that helps identify individuals who possess extreme or ‘outlier’ values for a particular dimension, i.e. starting at the tails of the distribution. This provides designers and standards developers with in-depth information on the characteristics and functional abilities of certain individuals who present design needs beyond that of the typical wheelchair sub-sample.
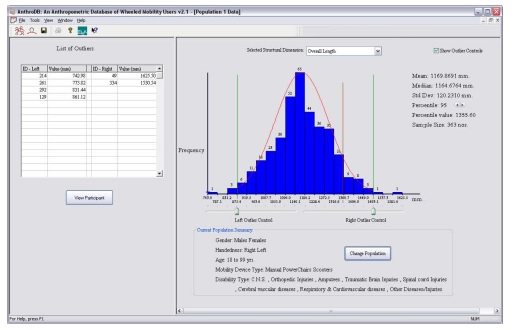
Figure 5-1. Example of interactive histogram of an anthropometric dimension (here overall length) that allows individuals (listed on the left) to be selected for additional analysis.
The user interface allows designers and standards developers to identify who could successfully fit in a clear floor space, or complete a maneuvering or reaching task in a particular environment in real time and who cannot (outliers). For example, in Figure 5-1 above, the histogram has two vertical lines on each side of the distribution. By sliding the lines right or left, the operator can define a target population by manipulating the parameters of the environment, in this case occupied length of the device. Data on that selected population appears at the top right as the bars are moved.
We have also integrated other information search capabilities. For example, a list of “outliers”, cases who are not accommodated by the parameters selected appear in the list at the top left of the screen in Figure 5-1. By clicking on any case, a window opens with the data for the individual selected. Photographs of that individual and the figure model can be accessed from that new screen (Figure 5-2). Using menu driven tools on the screen, operators can define sub-samples to analyze by selecting values for variables like age, gender, type of device used, etc., and the data for the selected sub-samples immediately appears. The data can be saved for comparison purposes. We developed interactive tools like this for device and occupant characteristics, maneuvering performance tasks, grip strength and reaching tasks (D'Souza et al., 2009a).
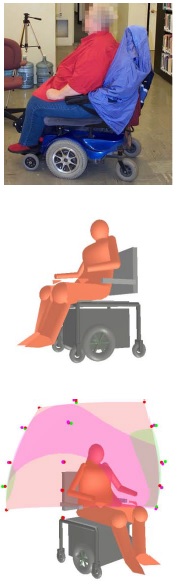
Figure 5-2. 3D human model and visualization of reach data of a female power wheelchair user.
Long Description: Figure 5-2 shows a photograph of a female power wheelchair user in the database along with the corresponding digital model and superimposed reach envelopes color-coded for different object weight conditions. Using 3-D coordinate data for constructing the model helps to create digital models that reflect the relative size, position and spatial orientation of individual body size and postures, and device size and shape. Reach envelopes are constructed using maximum reach distances recorded electromechanically in an object transfer task. These reach distances were measured in 3-D at five normalized shelf heights in three different directions (lateral, forward and an intermediate 45 degrees) resulting in 15 reach data points for each of four different weight conditions 0 kg, 0.45 kg, 1.36 kg and 2.27 kg (0, 1, 3, 5 lbs.) to simulate reach and object placement conditions one might attempt during typical activities of daily living.
Through data collection activities with two subcontractors, we developed a training program and manual to teach other researchers how to collect the data. We also developed error-checking software that researchers can use once data is collected from a participant to reduce measurement error in the field. Finally, we developed software tools that allow us to complete quality assurance on data sets developed by others in order to identify missing data and errors in measurement. These can then be used to correct data before adding it to the database or delete inadequate data records. This last set of software tools also manages the input of the new data set with our existing archive.
Now that data collection is complete, we will begin conducting other outreach activities that will include inviting other researchers to use our data and collect new data sets to add to the archive and potentially merge with ours. We will also offer use of the database to standards developers and policy makers, including the Access Board. We have considered providing web based access to the database but have concluded that it would take significant effort to support it. Thus, we are hesitant to make it widely available without having the resources to provide the support needed.
We have approached human modeling software developers to ascertain their interest in using the database to incorporate human modeling of wheelchair users into their programs. One company that makes ergonomic modeling software has shown interest but, at this date, they have not been willing to invest their own funds to develop such applications. We believe that this lack of interest indicates that there is not yet a clear market for such a product. Most commercial human modeling software are used for biomechanical analysis (e.g. evaluation of low back stress during lifting, etc.) and for animation. Thus, commercial tools are focused primarily on those activities, not anthropometric fit. We will continue discussions with them and engage discussion with other companies. We may also seek funding to develop our own “plug-ins” that can interface with commercial programs.
User Comments/Questions
Add Comment/Question